


This event study aims to investigate the impact of the trade policy shift, specifically the government of Pakistan's restriction on financial institutions issuing trading instruments, that is letters of credit.
The event was determined in two ways. The first is the adverse impact on the Karachi Stock Exchange (KSE-100 index). Second, Pakistan's shipping sector plays a significant role in determining the extent of this event. This event study has grouped the data set from Pakistan's shipping sector, listed on the Karachi Stock Exchange (KSE-100 index), and is designed with a 41-day window. A time series dataset is gathered from the investing.com website to assess this event. This measure started being practised on 19 May 2022.
A significant weakness of this event had a profound impact on Pakistan's import, export and operational activities. The study's findings revealed that inefficient markets, such as those in Pakistan, Sri Lanka and Turkey, are immediately affected by such events, government announcements and climate complexities.
The study reports various local and international severities that may affect Pakistan in the event of future repetition or the occurrence of any other similar measures. Concurrently, research has identified policy implications to address such events.
1. Introduction
Trade is the backbone of a country's economic growth and development. Every country and nation participate in trade, and the magnitude of trade depends on the strength of trade openness established by the respective governments. In the current era of economic growth, it is challenging to find any country that exempts itself from this competition and remains isolated from trade. The trade volume of different countries does not remain constant; it exhibits various fluctuations and patterns over time.
Trade openness refers to a country's ability to engage in trading activities or the degree to which the government increases its income and production (Managi et al., 2009). Trade openness simultaneously boosts various internal activities and enables a country to utilize its resources most effectively. Trade openness has a direct and positive relationship with production level, external factors and capital formation (Hasan, 2022; Larissa-Margareta et al., 2009; Rodríguez et al., 2023). Similarly, Destek et al. (2022) depicted that developing nations entirely depend on their natural resources for trade.
To promote trade openness, countries adjust their economic development plans, share their practical technologies and soften the terms and conditions of trade for both local and external traders (Jiang and Liu, 2023). For local development or to attain an international standard position, every country is doing its best to establish trade consortia with neighbouring, regional and economically robust countries. By doing so, countries are expanding their trade volumes by setting off different (short and long-term) trade agreements like FTA (Free Trade Agreement), GATT (General Agreement on Tariff and Trade), WTO (World Trade Organization), Custom Unions (CUs); established various EMUs (Economic and Monitory Units), Economic Units (EUs) and trade blocks with regional and other countries (Baier and Bergstrand, 2007; Kohl et al., 2016; Kumar, 2016). Pakistan is violating such trading agreements in contemplating the measure of banned LCs as Pakistan had put a ban on the import of all luxurious items, essential commodities, intermediate goods, raw materials, industrial equipment, automobile vehicles and items of regular use, thereby, reflecting this step taken by the Ministry of Commerce or Finance, government of Pakistan (Tariq, 2022); current research is going to check its adversity on the Pakistan's stock market. Thus, this study aims to investigate the adversity of trade barriers in the stock market and compute abnormal returns when a deliberate ban is imposed on financial institutions. Further, this study determines the irregular pattern of the KSE-100 index in response to the smoothness of trade openness, where the government has stopped issuing letters of credit (LCs) by all financial institutions, that is banks. Next, the study examined the impact of banned LCs on shipping companies whose operational activities are heavily dependent on trading moments.
This study formulated research questions to achieve its aim. RQ1: What is the impact of the self-taking measure (banning the issuance of LCs) by the government of Pakistan on the country's trading activities? RQ2: What is the trend in stock market dispersion in tandem with this trade barrier? RQ3: How do shipping companies obtain abnormal returns under the influence of this measure?
This study will likely contribute to enhancing the importance of trade openness. Theoretically, this study illustrates the emerging consequences of trade barriers imposed by governments and other regulatory bodies. Practically, it provides empirical evidence of the adverse impact on trading units, that is, shipping companies.
2. Literature review
Traditionally, firm-specific fundamental factors have been considered the primary determinants of stock prices; therefore, a three-factor model, comprising market size, exposure and book-to-market ratio, is assumed to be the primary determinant of the cross-sectional returns of the market (Fama and French, 1992; Farooq et al., 2022). However, a few contradictory theories have been found in the available literature that show that stock fluctuations result from investors' psychology, perceptions and other behavioural practices (Ryu et al., 2016). Additionally, numerous national and international factors, measures and movements have a direct or indirect impact on stock prices.
Trade has a significant impact on a country's economic growth and GDP (Yanikkaya, 2003). International trade theory also emphasizes a smooth and steady flow of trading activities between countries (Vetsikas and Stamboulis, 2022). Likewise, Kostakis et al. (2023) make significant contributions, evaluating that resource-wealthy countries generate a substantial amount of income through trade openness and improve their environmental quality. Xu et al. (2023) elaborated on this aspect and found that product advancement and technological progress improve institutional quality. Furthermore, Mohamed Sghaier (2021) considered trade openness as a driver of technological transformation among trading countries.
The current and prior governments of developed and developing countries are prioritising their core preferences for trade openness and often take extreme measures to promote exports, which ultimately increase their reserves and remittances (Tchekoumi and Nya, 2023). In this way, various state representatives came forward, negotiated different trade agreements and agreed on establishing distinct economic monetary units (EMUs). Such contracts enable countries to adjust the terms of trade and liberalise both exports and imports (Sunde et al., 2023). Through this process, countries are liable to adhere to their agreed-upon terms and conditions in full letter and spirit until the execution of the agreed-upon contracts (Brülhart, 2010). Subsequently, countries that have agreed may attract a larger pool of foreign investors who have shown interest in trading or monitoring activities; consequently, they increase the pool of Foreign Direct Investment (FDI) and reserves in foreign currencies (Narteh-Yoe et al., 2022; Sugozu et al., 2023). Meanwhile, countries are making their economic development through optimum utilization of resources (Gu et al., 2023), attract the residents to invest and simultaneously deliver its benefit to the foreign investors to boost the magnitude of trade (Hao, 2023).
Trade disruptions, when poorly enforced can increase consumer prices and hit disproportionately different economic strata (Gayathri et al., 2024). Literature highlighted current and future expected adversity associated with such repetition at home and in other international countries.
2.1 Impacts on the local country
2.1.1 Economic disruption
Universally, it is considered trustworthy that if a trade-dependent country like Pakistan were to stop its trade activities, a severe disruption would appear in its economic structure (Das, 2022). Consequently, the higher prices of commodities in regular use exert an additional burden on residents, increasing the element of deadweight loss.
2.1.2 Retribution
The rest of the countries may impose their trade restrictions or become reluctant to engage in trade activities with Pakistan (Masood et al., 2023). Consequently, other countries may also impose or restrict their local exporters from supplying goods to Pakistan. Therefore, Pakistan may lose access to and competitiveness in international markets.
2.1.3 Supply chain disruption
Most of Pakistan's industries are dependent on global supply chains. A cut-off from this global chain may lower access to the raw materials, leading to production delays or higher production costs (Fan et al., 2022).
2.1.4 Currency depreciation
The trade ban reduced export opportunities and led to the depreciation of local currency (Rahmati et al., 2021). Subsequently, fluctuation and higher volatility seem to be observed in international, foreign exchange and local reserves.
2.2 Impacts on the other countries
2.2.1 Reshaping of the global supply chain
Other countries may reduce or end their reliance on trade-banning countries. For a smooth flow of the global supply chain, countries that repeat this practice of banning trade would be exempted or replaced by other suppliers (Borin et al., 2023).
2.2.2 Isolation
A ban on LCs, leads a country to risk isolation from the global supply chain (Larionova, 2023); international organisations may exclude Pakistan from international forums. As a result, Pakistan would not be part of international and mutual activities set at global forums.
2.2.3 The threat of losing the trade partners
As a trade-banning country, Pakistan may lose its efficient trade partners, such as the United Kingdom and the USA. Moreover, other countries may also face a shortage of the goods supplied by Pakistan. Thereby, countries may find substitute products from different countries (Peterson and Zeng, 2021).
2.2.4 Black market and smuggling
Both black market and smuggling would be promoted in response to the trade ban (Garcia and Nguyen, 2023). Potential taxpayers and industrialists may switch to the black market and become willing to utilise the linkages of black marketers to sustain their regular or short-term activities. Then, Pakistan may fall into the category of countries whose official economies comprise a substantial segment of the shadow economy.
3. Methodology
The event study methodology estimates abnormal returns, allowing researchers to test its significance and empirically review aspects in different contexts (Armitage, 1995). Event studies are usually based on theoretically efficient markets and assume that security prices include all prevailing information regarding the market (Daniel and Moskowitz, 2016; Konchitchki and O'Leary, 2011). Country's trading activities serve as engines of growth and development (Sahoo and Sethi, 2020; Sunde et al., 2023). Trade encompasses both import- and export-based activities; countries that generate higher incomes from trade tend to pay more attention to exports than imports (Kazemzadeh et al., 2022; Sunde et al., 2023).
This study has chosen an event related to trade openness in Pakistan. On 19 May 2022, the Government of Pakistan, imposed restrictions on financial institutions regarding the further issuance of trade documents, specifically LCs'. After this, Pakistan's trading activities began to decline, directly impacting its shipping units. Both national and international shipping companies have rendered freight services in Pakistan. Companies owned by Pakistan and listed on the KSE-100 index are part of this research. The government took this step for an unannounced period, which was released on 2 January 2023 (Abbas, 2023). Furthermore, the consequences of this step reduced the balance of trade by 83.31% until December 2022; thus, the imposed restrictions were released in January 2023. This restriction was imposed to counter the higher flights of dollars, stabilise the economy and maintain the country's foreign currency reserves. The actual semi-annual trade balance figure decreased by 83.31% from July to December 2022 and declined by 32.31% annually (Rasool, 2023). Local traders and businesspeople strike as they become workless due to a shortage of raw materials.
To analyse the data of shipping companies, a study formed a window of 41 days, including s = −20 and s = +20. The window's length was maintained for 41 days, allowing for an immediate impact and trend to be observed. The time-series dataset was taken from the investing.com Website. As the government of Pakistan restricted the financial institutions from further issuing LCs on 19 May, shipping companies fulfilled their due tasks and freight. Subsequently, a stream of adverse impacts appeared after a few days of the event.
The computation of stock returns shown in Equation 3.1.
The general form of the regression is as follows:
Following the current study, the equation becomes:
Next, we calculate the abnormal return by subtracting the expected return from the actual return.
The computation of Cumulative Average Abnormal Return (CAAR) is performed by:
T-statistics can be computed as:
Then, a decision was made regarding the significance of the t-statistics.
Further, the current study uses ARCH/GARCH family models to assess volatility and detect leverage or cluster effects (Al-Najjar, 2016). Their findings help the researcher to determine the best model.
4. Results
Table 1 presents a brief overview of prices and returns. The dataset used for analysis contained 293 observations. The normality of the data was assessed using the mean, standard deviation, skewness, kurtosis and Jarque-Bera tests. The currently displayed data outlook enabled us to proceed to the next part of the analysis, where a detailed examination took place.
Descriptive characteristics
| Statistical indicators | Price | Return |
|---|---|---|
| Observations | 293 | 292 |
| Mean | 45429.85 | 0.0000283 |
| St. Deviation | 1723.359 | 0.00955 |
| Minima | 40879.93 | 0.036848 |
| Maxima | 48726.08 | 0.04938 |
| Skewness | 0.0643 | 0.0002 |
| Kurtosis | 0.0100 | 0.0000 |
| Jarque-Bera | 0.0101 | 0.0000 |
Next, the general trend and pattern of stock prices are displayed in Figure 1, showing a downward trend resulting from the steps taken to ban the issuance of LCs. The three steps of Box and Jenkins (1970) were followed to test the time-series data.
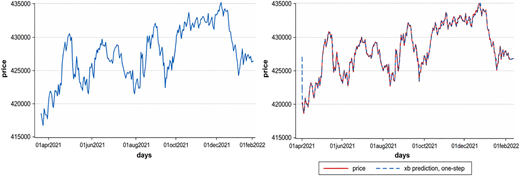
In the first step of identification, the general trend of time-series data was observed through graphs, correlograms and tests; then compared with actual ones. The correlogram was run at zero and with first differences. Two types of tests, namely Dickey-Fuller and Phillips-Perron, were performed to determine the unit root in the time series data set (see Table 2). The Dickey-Fuller test enables a researcher to obtain critical values that generally ignore their possible dependence on their lag orders (Cheung and Lai, 1995). Correspondingly, the Phillips–Perron test helps to determine the pattern of fluctuations in time-series data (Franses, 1998).
Determination of unit root in time series data
| Augmented dickey-fuller test | At zero difference | At first difference | ||
|---|---|---|---|---|
| t-statistics | Prob* | t-statistics | Prob* | |
| −2.630 | 0.009 | −16.430 | 0.000 | |
| Test Critical Values | 1% level | −3.988 | 1% level | −3.457 |
| 5% level | −3.428 | 5% level | −2.878 | |
| 10% level | −3.130 | 10% level | −2.570 | |
| Phillips Perron test | At zero difference | At first difference | ||
|---|---|---|---|---|
| t-statistics | Prob* | t-statistics | Prob* | |
| 49.290 | 0.000 | 0.560 | 0.573 | |
| Test Critical Values | 1% level | −3.988 | 1% level | −3.457 |
| 5% level | −3.428 | 5% level | −2.878 | |
| 10% level | −3.130 | 10% level | −2.570 | |
Ten days were added in the step of the estimation, and the lead values were computed. Subsequently, based on autocorrelation and partial autocorrelation, the values of p and q were determined by setting the difference to 1. Here, (p, d, q) is equivalent to (10, 1, 15), and the ARIMA model was run to best estimate the trend and depict its forecast (see Table 3). The impact of banning LC issuance did not appear immediately.
ARIMA regression
| Variables | (1) | (2) | (3) |
|---|---|---|---|
| Price | ARMA | Sigma | |
| L.ar | 1.335 | ||
| (1.250) | |||
| L2.ar | −0.620 | ||
| (1.827) | |||
| L3.ar | −0.514 | ||
| (1.302) | |||
| L4.ar | 0.972 | ||
| (1.120) | |||
| L5.ar | −0.805 | ||
| (2.042) | |||
| L6.ar | 0.129 | ||
| (2.069) | |||
| L7.ar | 0.368 | ||
| (1.118) | |||
| L8.ar | 0.0686 | ||
| (1.025) | |||
| L9.ar | −0.374 | ||
| (0.921) | |||
| L 10.ar | 0.307 | ||
| (0.445) | |||
| L.ma | −1.370 | ||
| (342.5) | |||
| L2.ma | 0.570 | ||
| (594.8) | |||
| L3.ma | 0.583 | ||
| (731.6) | |||
| L4.ma | −1.077 | ||
| (549.6) | |||
| L5.ma | 0.836 | ||
| (383.8) | |||
| L6.ma | −0.00611 | ||
| (166.7) | |||
| L7.ma | −0.485 | ||
| (244.1) | |||
| L8.ma | −0.0807 | ||
| (228.7) | |||
| L9.ma | 0.421 | ||
| (199.5) | |||
| L10.ma | −0.213 | ||
| (139.2) | |||
| L11.ma | −0.131 | ||
| (75.46) | |||
| L12.ma | 0.0185 | ||
| (91.90) | |||
| L13.ma | 0.120 | ||
| (82.47) | |||
| L14.ma | −0.212 | ||
| (71.22) | |||
| L15.ma | 0.0254 | ||
| (8.533) | |||
| Constant | 12.21 | 394.9 | |
| (12.54) | (66,668) | ||
| Observations | 292 | 292 | 292 |
Note(s): Standard errors in parentheses
***p < 0.01, **p < 0.05, *p < 0.1
Subsequently, the validity of the ARIMA regression was confirmed using the log-likelihood, Akaike Information Criterion (AIC) and Schwarz Criterion (SC); depicting Figures 4375.292 and 4445.15, respectively. A smaller value seems to be a good fit which ensured its robustness.
Moreover, the selected ARIMA Model underwent the eigenvalue stability condition, with an output figure of 0.968, where ar(10) and ma(15) fell within their paths and were surrounded by a circular boundary. This condition seems to ensure the significance of the chosen model by satisfying the stability condition.
The first shipping company, Pakistan International Container Terminal (PICT), received the impact of the restriction announced to impose a ban on financial institutions to stop their operating work for the issuance of trading documents, that is, the letter of credit LCs on the 12th day of the event occurrence (Table 4). This delayed impact is caused by the shipping unit continuing its prior or due activities and sustaining its functions. Later, after a three-day pause, it became significant again; similarly, after another three days, it became substantial on the 20th day of the window and had this impact. The remaining lag values of the window showed a stream of insignificance except for one (Figure 2).
Returns, abnormal return and significance of shipping unit PICT (Pakistan International Container Terminal)
| KSE | PICT | KSE return | PICT return | ER | AR | CAR | t-test | Significance |
|---|---|---|---|---|---|---|---|---|
| 41730.16 | 161 | 0.0070 | 0.0019 | −0.0012 | 0.0031 | 0.0031 | 0.3436 | Insignificant |
| 41438.79 | 161.31 | 0.0093 | −0.0040 | −0.0016 | −0.0025 | 0.0006 | −0.2774 | Insignificant |
| 41054.68 | 160.66 | 0.0043 | −0.0010 | −0.0007 | −0.0003 | 0.0003 | −0.0342 | Insignificant |
| 40879.93 | 160.5 | −0.0278 | −0.0016 | 0.0048 | −0.0064 | −0.0061 | −0.7142 | Insignificant |
| 42014.73 | 160.25 | 0.0066 | −0.0016 | −0.0011 | −0.0005 | −0.0066 | −0.0514 | Insignificant |
| 41735.96 | 160 | 0.0044 | −0.0063 | −0.0007 | −0.0056 | −0.0122 | −0.6217 | Insignificant |
| 41553.16 | 159 | −0.0004 | 0.0006/ | 0.0001 | 0.0005 | −0.0116 | 0.0578 | Insignificant |
| 41568.41 | 159.1 | −0.0002 | −0.0003 | 0.0001 | −0.0004 | −0.0120 | −0.0443 | Insignificant |
| 41577.21 | 159.05 | 0.0063 | 0.0047 | −0.0010 | 0.0057 | −0.0063 | 0.6396 | Insignificant |
| 41314.88 | 159.8 | −0.0223 | 0.0044 | 0.0039 | 0.0005 | −0.0059 | 0.0502 | Insignificant |
| 42237.91 | 160.5 | −0.0123 | −0.0031 | 0.0022 | −0.0053 | −0.0111 | −0.5900 | Insignificant |
| 42756.04 | 160 | −0.0075 | 0.0105 | 0.0013 | 0.0091 | −0.0020 | 1.0145 | Insignificant |
| 43078.14 | 161.69 | 0.0009 | −0.0042 | −0.0001 | −0.0041 | −0.0061 | −0.4519 | Insignificant |
| 43040.14 | 161.02 | 0.0042 | 0.0030 | −0.0007 | 0.0036 | −0.0025 | 0.4061 | Insignificant |
| 42861.45 | 161.5 | 0.0075 | −0.0189 | −0.0012 | −0.0176 | −0.0201 | −1.9637 | Significant |
| 42541.71 | 158.51 | 0.0124 | −0.0032 | −0.0021 | −0.0011 | −0.0212 | −0.1252 | Insignificant |
| 42012.66 | 158 | 0.0015 | 0.0009 | −0.0002 | 0.0012 | −0.0200 | 0.1291 | Insignificant |
| 41950.32 | 158.15 | −0.0117 | 0.0015 | 0.0021 | −0.0006 | −0.0206 | −0.0615 | Insignificant |
| 42440.25 | 158.39 | −0.0156 | 0.0038 | 0.0027 | 0.0011 | −0.0195 | 0.1224 | Insignificant |
| 43100.70 | 159 | 0.0027 | −0.0038 | −0.0004 | −0.0034 | −0.0229 | −0.3749 | Insignificant |
| 42983.45 | 158.4 | −0.0010 | 0.0038 | 0.0002 | 0.0036 | −0.0193 | 0.3959 | Insignificant |
| 43026.88 | 159 | 0.0070 | −0.0032 | −0.0012 | −0.0020 | −0.0213 | −0.2220 | Insignificant |
| 42726.06 | 158.5 | 0.0014 | −0.0032 | −0.0002 | −0.0030 | −0.0243 | −0.3314 | Insignificant |
| 42667.32 | 158 | −0.0192 | 0.0094 | 0.0034 | 0.0060 | −0.0182 | 0.6728 | Insignificant |
| 43486.46 | 159.5 | 0.0135 | −0.0095 | −0.0023 | −0.0072 | −0.0254 | −0.8026 | Insignificant |
| 42898.44 | 158 | 0.0008 | −0.0080 | −0.0001 | −0.0079 | −0.0333 | −0.8781 | Insignificant |
| 42863.15 | 156.75 | −0.0150 | 0.0142 | 0.0026 | 0.0115 | −0.0218 | 1.2836 | Insignificant |
| 43504.36 | 159 | 0.0026 | −0.0063 | −0.0004 | −0.0059 | −0.0277 | −0.6613 | Insignificant |
| 43393.14 | 158 | −0.0334 | 0.0186 | 0.0058 | 0.0128 | −0.0149 | 1.4284 | Insignificant |
| 44840.81 | 161 | −0.0091 | 0.0092 | 0.0016 | 0.0075 | −0.0074 | 0.8411 | Insignificant |
| 45249.41 | 162.49 | −0.0063 | −0.0033 | 0.0011 | −0.0045 | −0.0118 | −0.4978 | Insignificant |
| 45533.30 | 161.95 | −0.0062 | −0.0072 | 0.0011 | −0.0083 | −0.0201 | −0.9227 | Insignificant |
| 45817.67 | 160.8 | −0.0056 | 0.0485 | 0.0010 | 0.0475 | 0.0274 | 5.2950 | Significant |
| 46073.25 | 169 | 0.0113 | −0.0060 | −0.0019 | −0.0040 | 0.0234 | −0.4509 | Insignificant |
| 45553.02 | 168 | −0.0022 | −0.0091 | 0.0004 | −0.0095 | 0.0139 | −1.0582 | Insignificant |
| 45652.62 | 166.49 | −0.0064 | −0.0121 | 0.0011 | −0.0132 | 0.0006 | −1.4761 | Insignificant |
| 45943.16 | 164.5 | −0.0085 | −0.0186 | 0.0015 | −0.0201 | −0.0195 | −2.2392 | Significant |
| 46333.36 | 161.5 | −0.0045 | 0.0031 | 0.0008 | 0.0023 | −0.0172 | 0.2530 | Insignificant |
| 46539.59 | 162 | −0.0013 | 0.0092 | 0.0003 | 0.0089 | −0.0083 | 0.9917 | Insignificant |
| 46601.54 | 163.5 | 0.0025 | 0.0061 | −0.0004 | 0.0065 | −0.0018 | 0.7208 | Insignificant |
| 46484.43 | 164.5 | 0.0069 | −0.0281 | −0.0011 | −0.0270 | −0.0288 | −3.0075 | Significant |
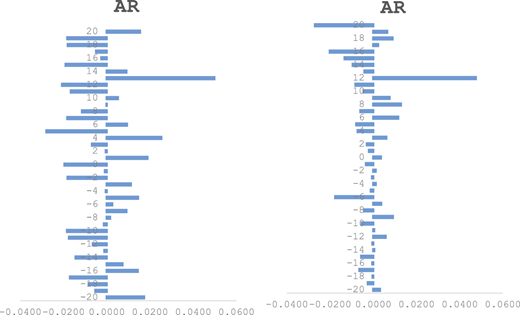
For (PICT) and (PNSC) average abnormal returns (ARR) of the event window of shipping companies
For (PICT) and (PNSC) average abnormal returns (ARR) of the event window of shipping companies
The second shipping company, the Pakistan National Shipping Corporation (PNSC) got the significance of the event even before it occurred. It also displayed importance on the event day, which mostly remained significant. A days, including the event days, were substantial. Next, two days depicted insignificance under the contemplation of the proposed event. Next, the trend over the next two days showed an insignificant trend, but it became significant. Next, with a one-day gap, significance appeared again, but the next four consecutive days became insignificant, suggesting the event had been absorbed. The shipping company soaked up the event's impact for only four days and moulded itself towards significance for the next couple of days. A day of insignificance merged with this trend, and a reversal of insignificance appeared for the next two days. They seemed to be significant on the 18th and 19th days. Lastly, in the last days of the window, the shipping company absorbed the occurrence of an event with an insignificant trend. Overall, the shipping company was directly affected by this event. The remaining lag values of the window showed a stream of insignificance, except for three values (Table 5).
Returns, abnormal return and significance of shipping unit PNSC (Pakistan National Shipping Cooperation)
| KSE | PNSC | Market return | Stock return | ER | AR | CAR | t-test | Significance |
|---|---|---|---|---|---|---|---|---|
| 41730.16 | 48.5 | 0.0070 | 0.0185 | 0.0012 | 0.0173 | 0.0173 | 1.9441 | Insignificant |
| 41438.79 | 47.62 | 0.0094 | −0.0038 | 0.0015 | −0.0052 | 0.0121 | −0.5895 | Insignificant |
| 41054.68 | 47.8 | 0.0043 | −0.0075 | 0.0008 | −0.0083 | 0.0037 | −0.9339 | Insignificant |
| 40879.93 | 48.16 | −0.0270 | −0.0201 | −0.0031 | −0.0170 | −0.0133 | −1.9113 | Insignificant |
| 42014.73 | 49.15 | 0.0067 | 0.0155 | 0.0011 | 0.0144 | 0.0011 | 1.6137 | Insignificant |
| 41735.96 | 48.4 | 0.0044 | 0.0081 | 0.0008 | 0.0073 | 0.0084 | 0.8176 | Insignificant |
| 41553.16 | 48.01 | −0.0004 | −0.0142 | 0.0002 | −0.0144 | −0.0060 | −1.6200 | Insignificant |
| 41568.41 | 48.7 | −0.0002 | −0.0008 | 0.0003 | −0.0011 | −0.0071 | −0.1219 | Insignificant |
| 41577.21 | 48.74 | 0.0063 | −0.0053 | 0.0011 | −0.0064 | −0.0135 | −0.7197 | Insignificant |
| 41314.88 | 49 | −0.0219 | −0.0200 | −0.0025 | −0.0175 | −0.0310 | −1.9689 | Significant |
| 42237.91 | 50 | −0.0121 | −0.0196 | −0.0012 | −0.0184 | −0.0494 | −2.0637 | Significant |
| 42756.04 | 51 | −0.0075 | −0.0020 | −0.0007 | −0.0013 | −0.0507 | −0.1460 | Insignificant |
| 43078.14 | 51.1 | 0.0009 | 0.0020 | 0.0004 | 0.0016 | −0.0491 | 0.1751 | Insignificant |
| 43040.14 | 51 | 0.0042 | 0.0099 | 0.0008 | 0.0091 | −0.0401 | 1.0207 | Insignificant |
| 42861.45 | 50.5 | 0.0075 | 0.0038 | 0.0012 | 0.0025 | −0.0375 | 0.2845 | Insignificant |
| 42541.71 | 50.31 | 0.0126 | 0.0164 | 0.0019 | 0.0145 | −0.0231 | 1.6269 | Insignificant |
| 42012.66 | 49.5 | 0.0015 | 0.0000 | 0.0005 | −0.0005 | −0.0235 | −0.0539 | Insignificant |
| 41950.32 | 49.5 | −0.0115 | 0.0100 | −0.0012 | 0.0112 | −0.0124 | 1.2558 | Insignificant |
| 42440.25 | 49.01 | −0.0153 | −0.0198 | −0.0017 | −0.0181 | −0.0305 | −2.0396 | Significant |
| 43100.70 | 50 | 0.0027 | −0.0002 | 0.0006 | −0.0008 | −0.0314 | −0.0941 | Insignificant |
| 42983.45 | 50.01 | −0.0010 | −0.0194 | 0.0002 | −0.0196 | −0.0509 | −2.2002 | Significant |
| 43026.88 | 51 | 0.0070 | 0.0200 | 0.0012 | 0.0188 | −0.0321 | 2.1148 | Significant |
| 42726.06 | 50 | 0.0014 | 0.0000 | 0.0005 | −0.0005 | −0.0326 | −0.0523 | Insignificant |
| 42667.32 | 50 | −0.0188 | −0.0089 | −0.0021 | −0.0068 | −0.0394 | −0.7665 | Insignificant |
| 43486.46 | 50.45 | 0.0137 | 0.0273 | 0.0020 | 0.0253 | −0.0141 | 2.8386 | Significant |
| 42898.44 | 49.11 | 0.0008 | −0.0275 | 0.0004 | −0.0279 | −0.0421 | −3.1382 | Significant |
| 42863.15 | 50.5 | −0.0147 | 0.0078 | −0.0016 | 0.0094 | −0.0327 | 1.0524 | Insignificant |
| 43504.36 | 50.11 | 0.0026 | −0.0176 | 0.0006 | −0.0183 | −0.0510 | −2.0524 | Significant |
| 43393.14 | 51.01 | −0.0323 | −0.0153 | −0.0038 | −0.0114 | −0.0624 | −1.2862 | Insignificant |
| 44840.81 | 51.8 | −0.0090 | −0.0010 | −0.0009 | −0.0001 | −0.0625 | −0.0122 | Insignificant |
| 45249.41 | 51.85 | −0.0062 | 0.0047 | −0.0005 | 0.0052 | −0.0574 | 0.5790 | Insignificant |
| 45533.30 | 51.61 | −0.0062 | −0.0171 | −0.0005 | −0.0166 | −0.0740 | −1.8706 | Insignificant |
| 45817.67 | 52.51 | −0.0055 | −0.0211 | −0.0004 | −0.0207 | −0.0947 | −2.3214 | Significant |
| 46073.25 | 53.64 | 0.0114 | 0.0516 | 0.0017 | 0.0498 | −0.0448 | 5.5995 | Significant |
| 45553.02 | 51.01 | −0.0022 | 0.0091 | 0.0000 | 0.0091 | −0.0358 | 1.0213 | Insignificant |
| 45652.62 | 50.55 | −0.0063 | −0.0196 | −0.0005 | −0.0191 | −0.0548 | −2.1442 | Significant |
| 45943.16 | 51.56 | −0.0084 | −0.0033 | −0.0008 | −0.0025 | −0.0573 | −0.2819 | Insignificant |
| 46333.36 | 51.73 | −0.0044 | −0.0052 | −0.0003 | −0.0049 | −0.0623 | −0.5531 | Insignificant |
| 46539.59 | 52 | −0.0013 | −0.0179 | 0.0001 | −0.0181 | −0.0803 | −2.0303 | Significant |
| 46601.54 | 52.95 | 0.0025 | −0.0176 | 0.0006 | −0.0182 | −0.0986 | −2.0497 | Significant |
| 46484.43 | 53.9 | 0.0069 | 0.0166 | 0.0012 | 0.0154 | −0.0831 | 1.7343 | Insignificant |
The abnormal returns and insignificance of shipping companies are also illustrated through graphical alignment. The graph is an appropriate scheme for the dispersion of data, where the trend and behaviour of the sampled data can be determined more precisely (Dezső et al., 2011). The extreme left figure shows the PICT trend along with its significance level. The blue bars represent the trend and pattern of events during the 41-day windows. The graphically accurate figure illustrates the dispersion of the PNSC for a similar window spanning 41 days (Figure 2). Both graphs plot the abnormal returns and event windows.
Next, the time-series dataset of the current study was analysed for ARCH/GARCH effects. A time-series line graph was drawn to assess the impact of ARCH or GARCH effects (Figure 3). The visual evidence of the low-volatility cluster shows low-variance spikes between higher-variance spikes, and these spikes also die out at specific points. This suggests that the context of this study best aligns with the ARCH model.
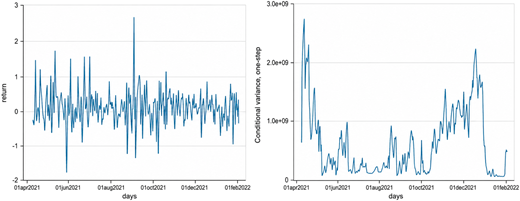
From the perspective of the ARCH effects, lag one has fallen below the acceptance criterion of significance and depicts a probability value within the confidence interval (Table 6). The ARCH model prevents the researcher from forecasting unfavourable variances. The lag fits the best model for current time-series data.
ARCH family regression
| Price | Coef | St.Err | t-value | p-value | [95% Conf | Interval] | Sig |
|---|---|---|---|---|---|---|---|
| Constant | 45100.568 | 38.706 | 1165.20 | 0 | 45024.705 | 45176.431 | *** |
| L | 1.09 | 0.238 | 4.57 | 0 | 0.623 | 1.557 | *** |
| L2 | −0.078 | 0.059 | −1.32 | 0.187 | −0.194 | 0.038 | |
| L3 | 0.027 | 0.066 | 0.41 | 0.679 | −0.102 | 0.156 | |
| Constant | 99328.397 | 41921.399 | 2.37 | 0.018 | 17163.965 | 181492.83 | ** |
| Mean dependent var | 45429.850 | SD dependent var | 1723.359 | ||||
| Number of obs | 293 | Chi-square | |||||
| Prob > χ2 | Akaike crit. (AIC) | 4987.235 | |||||
Note(s): ***p < 0.01, **p < 0.05, *p < 0.1
Finally, the one-sided conditional mean variance of the time-series data was plotted (Figure 3). The plotted line graph shows a high volatility spike, followed by a transition to low volatility spikes, and then the spike dissipates. These spikes represent the volatility of the stock market during an event.
5. Discussion and policy implications
Globally, a nation's trading activities remain a matter of concern for its governing bodies and governments. The strength and ability of a country to participate in trading activities vary according to the production level, abundance of resources, local skills, economies of scale and differentiated technology (Dowrick, 2004; Jia and Yang, 2022). Both trade openness and economic growth are essential footprints of a country's livelihood. Kassi et al. (2023) suggested that countries with higher trade openness tend to mitigate environmental degradation and adopt advanced technologies.
A step of banning the issuance of LCs taken by the government adversely affected the stock market KSE-100 index and transformed its impact on the listed shipping companies of Pakistan. The time series data of the KSE-100 index were analysed using the three steps of Box and Jenkins (1970): identification, estimation and forecasting. Then, the values of (p, d, q) were taken, and the ARIMA model was executed. In the next part of the analysis, two shipping companies were selected and found to have abnormal returns. The significance of this event has often been displayed by adjusting the window to 41 days. Two shipping companies, PICT and PNSC, were chosen for the time series analysis. PNSC had a more decisive influence on this event than PICT did. At the national level, Pakistan's balance of trade declined by 83.31% as of December 2022; thus, the imposed restrictions were released in January 2023.
The government of Pakistan has to take other corrective measures instead of putting an entire ban on issuing the LCs. Like, Pakistan can settle bilateral trade agreements with debtor and creditor countries. Pakistan may import raw materials, finished goods or heavy machinery in exchange for its abundant natural resources, such as salt or coal. According to Papież et al. (2022), consumption of natural resources is relatively higher in developed countries. Typically, bilateral trade binds countries together and enables them to exchange goods with similar trading partners. This practice has prior evidence and validity in the context of different debts and economic and financial crises. In the past, they have efficiently formulated strategies to rescue or securitize developed countries from global financial crises. Second, Pakistan is a member of various trade agreements and trading blocks. The core objective of establishing the trading block is to resolve economic disputes between nations (Cassing, 2009); thus, trade unions play a dynamic role in overcoming conflicts and disputes among countries. Instead of putting a ban on financial institutions regarding issuing LCs, Pakistan may appeal to relatively robust member countries under its trade consortiums. Subsequently, the stock market (KSE-100 index) and shipping companies could be rescued from this adversity.
Policymakers and economists in Pakistan must design a footprint to soften the terms of trade for local exporters.
The government should complete the deferred work on the China–Pakistan Economic Corridor (CPEC) or resume its functions and inaugurate a new trade route.
The government should impose barriers to luxury imports with relaxing the import of pharmaceutical materials and other essential items of regular use.
The government should encourage local investors to invest in the production of commodities within the country, rather than importing them.
The government should exempt taxes, tariffs and excise duties on the import of heavy machinery and production units.
The government must establish new business units and industrial states for the local industrialists; by giving interest free-loans to both.
To attract FDI, the government must develop consortia of local investors with foreign investors, allowing for a joint commencement of work.
The government should give rebates to local exporters for raising the segment of export.
The government should establish additional reserves for foreign currencies, enabling exporters to benefit from and feel more secure when trading with foreign countries.
The government should shrink the time required for the issuance of trading instruments and the documentation verification process, specifically letters of credit from financial institutions.
The imposed ban had a lasting impact on the home country that could be difficult to regain; diffuses its implications to all those countries that are trading partners, members of trade consortia and trade dependents of a particular country. The size of this influence varies depending on the country's economy and magnitude of its trade. Thus, this study reports on the current and future expected adversity associated with such repetition at home and in other international countries.
6. Limitations and future research directions
This study has a few limitations. First, the current study focuses on only two operating shipping units. Therefore, researchers are encouraged to design a mechanism that caters to non-listed shipping companies, allowing for a more even distribution of events across the entire sector. Second, the current study focuses on trade openness and economic growth, and future researchers should explore the joint impact of trade openness and political instability in the context of Pakistan. Finally, the current research has focused on the development and implications of different trading policies, and future studies are suggested to examine the robustness and practicality of these policies' implications.
7. Conclusion
The current event study reflects the impact of the abnormal return of the KSE-100 index in the contemplation of a restriction inserted by the Ministry of Commerce, the government of Pakistan, on financial institutions for the further issuance of trading documents, that is, the letter of credit LCs. This study analyses the stock abnormality of the shipping sector in response to the imposition of a severe ban on financial institutions regarding the issuance of trading documents, specifically the issuance of a letter of credit. It is argued that abnormal returns compelled local traders to shut down their operational activities. Therefore, the performance of the shipping industry was tested by forming an event window.
Moreover, and manufacturers became unemployed or fell into a state where they could no longer sustain their daily activities. An adversity has fallen in the shipping sector and appeared in heavy distress; examined in Pakistan's stock market (the KSE-100 Index) along with two of listed firms, the PICT and PNSC. From analysis, it was observed that PNSC soaks up the adversity of the event occurrence compared to PICT. Consequently, abnormal returns were not observed in the case of PICT at the aggressive PICT level.
From May 2022, a restriction on the issuance of trading documents was imposed for an unannounced period, which declined trade balance by 83.31% at the end of December 2022. The government of Pakistan could not implement this measure of imposing a ban on trade; instead, the government could consider bilateral contracts, raise its FDI or soften the terms of trade so that an actual revival of the economy may occur. A smooth and steady trend of trade can be achieved.

