Skip to article sections
Purpose

There are significant differences in the corrosion protection performance of commonly used cleaning agents for high-speed railways. In order to study the dual requirements of cleaning efficiency and corrosion inhibition, explore the differences in corrosion protection performance of cleaning agents, effectively protect metal substrates, and ensure the safe, economical, and environmentally friendly operation of high-speed railways, this study is hereby carried out.

Design/methodology/approach

This study investigated the corrosion behaviour of Q235 steel exposed to acidic, neutral, and alkaline cleaning agents through metallographic analysis, electrochemical testing, and scanning electron microscopy (SEM).

Findings

Electrochemical behaviour was assessed at concentrations of 5%, 10%, 15%, and 20% using electrochemical impedance spectroscopy (EIS) and Tafel tests. The results indicate that the protective efficacy of acidic, neutral, and alkaline cleaning agents follows the order: alkaline > neutral > acidic.

Originality/value

Microstructural analysis and energy-dispersive X-ray spectroscopy (EDS) surface element quantification reveal that acidic cleaning agents cause the most severe corrosion and offer the poorest protection for Q235 steel, whereas neutral and alkaline agents provide protective effects by retarding corrosion. Conducting in-depth research on the differences in corrosion protection performance of cleaning agents can effectively safeguard metal substrates, eliminate corrosion risks, and ensure the safe operation of high-speed railways.

Q235 steel is widely used in the fields of railway vehicles and transportation. In railway vehicle manufacturing, Q235 steel is commonly used for key components such as frames and wheels, which can effectively improve the vehicle's load-bearing capacity and driving stability. In terms of railway transportation infrastructure, Q235 steel is used to manufacture bridge structural components, which helps reduce the weight of bridges and improve their load-bearing capacity. However, the corrosion resistance of Q235 steel is relatively poor, so it is necessary to study the corrosion resistance of Q235 steel. Research literature has found that eucalyptus leaf extract, as a green corrosion inhibitor, exhibits good environmental characteristics in sulfuric acid and phosphoric acid solutions. It can effectively adsorb onto the surface of low carbon steel to form a protective film, significantly slowing down the corrosion rate and demonstrating the potential to replace traditional chemical corrosion inhibitors in industrial environments (Pan, Cai, & Yu, 2010). As a corrosion inhibitor for Q235 steel, diethanolamide lauric acid can effectively inhibit its corrosion. Its mechanism of action involves physical adsorption and chemical bonding to form a protective film, and it has the potential for environmentally friendly and sustainable applications (Luo et al., 2021a, b). As the core carrier of modern transport, high-speed rail operates under conditions characterised by high speeds, long distances, and diverse operational scenarios. Steel components, subjected to prolonged exposure to high-velocity airflow (200–300 km/h) and complex climatic conditions (such as rain, snow, and salt spray), readily develop corrosion products including scale and rust layers on their surfaces. Taking high-speed rail bogies as an example, with daily operational distances reaching 2,000 kilometres, failure to promptly remove corrosion products may lead to reduced structural strength. Accumulation of corrosion products induces stress concentration, accelerating metal fatigue and compromising operational safety. Untreated corrosion may cause localised perforation, substantially increasing maintenance costs.

Current high-speed rail cleaning agents primarily fall into 3 categories: acidic, neutral, and alkaline, exhibiting significant differences in corrosion protection performance (Deng et al., 2023; Du et al., 2024; Liu, 2020). Acidic cleaners (e.g., organic acids) efficiently dissolve metal oxides through their strong acidity but readily induce hydrogen embrittlement and pitting corrosion in metal substrates, with corrosion rates markedly increasing in humid environments (Wang, Xin, Chen, Wang, & Cheng, 2025). Alkaline cleaners rapidly decompose grease through strong alkaline reactivity, yet prolonged use may induce intergranular corrosion in metals. Consequently, investigating the variations in corrosion protection among cleaning agents is not only an urgent requirement for ensuring the safe, economical, and environmentally sound operation of high-speed railways, but also enables synergistic improvements in cleaning efficiency, material protection, and sustainable development through scientific evaluation and optimisation. Therefore, metal cleaning agents used in railways need to meet the dual requirements of cleaning efficiency and corrosion inhibition, and their corrosion behaviour research can fill the gap in the field of railway material protection. At the same time, in-depth exploration of the differences in corrosion protection performance of cleaning agents can not only optimise cleaning efficiency, but also effectively protect metal substrates, avoid corrosion hazards, and ensure the safe, economical, and environmentally friendly operation of high-speed railways.

Q235 steel specimens measuring 50 mm × 25 mm × 2 mm were selected and ground smooth using 500-grit sandpaper. Chemical composition was determined according to GB/T 4336–2016 “Determination of Multi-Element Content in Carbon Steel and Medium-Low Alloy Steel-Spark Emission Atomic Emission Spectroscopy”. The composition results for Q235 steel are shown in Table 1 (Ji, Ji, & Fan, 2023; Zhang et al., 2016).

Selection of cleaning agent solutions: acidic cleaner (principal components: oxalic acid, thiourea, water); neutral cleaner (surfactant alchohol polyoxyethylene ether sulphate (AES), water); alkaline cleaner (triethanolamine, benzotriazole (BTA), water). Investigation of the electrochemical behaviour and surface microstructure of Q235 steel in the 3 cleaning agent solutions at different dilution concentrations.

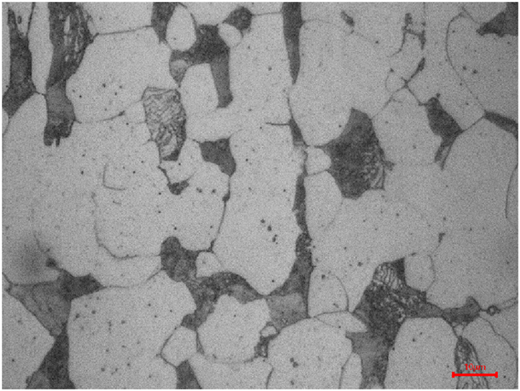
Q235 steel specimens measuring 10 mm × 10 mm were cut, ground with emery paper, polished with polishing compound, etched with 4% nitric acid, and examined for metallographic structure using a Leica DM6M metallographic microscope (Huang et al., 2015; Zhang, Li, Wang, & Chen, 2007; Zhang, Han, & Song, 2018).

Q235 steel specimens were procured from a local supplier. The working area for electrochemical testing was 1 × 1 cm2, with the opposite side of the Q235 steel block sealed using epoxy resin. Electrochemical testing employed a Gamry 600+ workstation. The three-electrode system comprised a working electrode (1 cm3 Q235 steel block), a saturated calomel electrode, and a platinum electrode (4 cm2 platinum disc). Electrodes were immersed in the test solution until a steady state was achieved, at which point the self-corrosion potential was measured. Electrochemical impedance spectroscopy (EIS) was conducted within the frequency range of 105 to 10–2 Hz under a 5 mV sinusoidal disturbance (Guo, He, & Bai, 2016; Luo et al., 2021a, b; Zheng, Yi, Zhao, Zhang, & Li, 2017). Following EIS testing, dynamic polarisation curves were measured. The test potential was set at ±250 mV around the self-corrosion potential, with a scan rate of 1 mV/s.

The corrosion extent of Q235 steel in different test solutions was observed using scanning electron microscopy (SEM) (German ZEISS Gemini SEM 300) (Rouifi et al., 2021; Haque et al., 2023; Wang et al., 2024). Q235 steel specimens were polished using sandpaper (400 to 7,000 grit). After immersion in the test solutions for 6 hours, specimens were cleaned with deionised water and anhydrous ethanol, then dried.

As shown in Figure 1, Q235 steel belongs to carbon structural steel, composed of ferrite and pearlite. The pearlite typically exhibits a lamellar structure, alternating with ferrite in a layered arrangement.

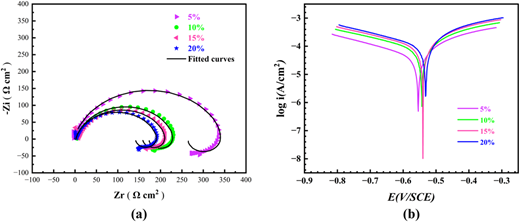
The primary constituents of the acidic cleaning agent are oxalic acid and thiourea, with thiourea serving as the corrosion inhibitor. The corresponding Nyquist plots and polarisation curves for acidic cleaning agents at different dilution concentrations are shown in Figure 2. As evident from Figure 2(a), the Nyquist plot comprises a capacitive arc in the high-frequency region and an inductive arc in the low-frequency region. Both arcs exhibit reduced radii with increasing cleaning agent concentration. Optimal protective efficacy is demonstrated at a 5% cleaning agent concentration; whilst the worst protection was observed at 20% concentration, indicating that a denser protective film formed on the Q235 steel surface at 5% concentration. Subsequently, despite increased cleaner concentration, the solution's heightened acidity inhibited the protective action of thiourea molecules, reducing the capacitive arc radius. The emergence of inductive reactance at low frequencies may be attributed to either a rougher electrode surface or the adsorption of corrosive media from the solution onto the electrode surface.

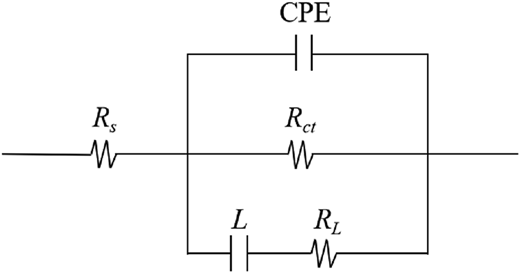
Fitting impedance data for Q235 steel in an acidic cleaning solution using ZsimDemo software yielded the equivalent circuit shown in Figure 3, with electrochemical parameters listed in Table 2. Here, Rs denotes solution resistance, Rct represents charge transfer resistance, L and RL denote inductive reactance and inductive reactance resistance respectively, while CPE denotes the constant phase element. Table 2 indicates that the value of Rct increases as the cleaning agent concentration decreases. At a 5% concentration, Rct rises to 349.5 Ω cm2, signifying progressively greater resistance to the corrosion process and enhanced corrosion inhibition. Concurrently, the CPE exhibits an overall decreasing trend with diminishing detergent concentration. The CPE value reflects water absorption capacity, where a higher CPE indicates stronger water absorption. This demonstrates that as detergent concentration increases, the water absorption capacity of Q235 steel continuously rises, thereby adversely affecting the corrosion protection of carbon steel. Thus, lower concentrations of the acidic cleaning agent yield superior protective performance for Q235 steel. Both Rct and CPE data collectively demonstrate that Q235 steel exhibits identical corrosion patterns across varying concentrations of acidic cleaning agents, wherein protective efficacy diminishes with increasing acid concentration.

As depicted in Figure 2(b) showing dynamic polarisation curves for acidic cleaning agents at varying concentrations, the polarisation curve shifts upwards with increasing agent concentration, accompanied by heightened corrosion current density and more severe corrosion behaviour. Furthermore, the corrosion potential decreases as agent concentration diminishes, with reduced corrosion current density observed in both anodic and cathodic regions. This indicates simultaneous inhibition of anodic and cathodic reactions by the cleaning agent.

Table 3 presents the relevant electrochemical parameters obtained via extrapolation. As shown in Table 3, the corrosion current density decreases with reduced cleaning agent concentration. Concurrently, the corrosion potential diminishes with increasing concentration, though the shift remains below 85 mV, classifying it as a mixed-type corrosion inhibitor. Furthermore, βa and βc exhibit minimal variation across different detergent concentrations. As depicted in Figure 2(b), the anodic and cathodic segments of the curves run parallel, indicating substantially consistent slopes. This confirms that the protective mechanism of the detergent for Q235 steel remains consistent, with the corrosion inhibitor primarily mitigating corrosion by reducing reaction rates. From the above results, it can be inferred that thiourea molecules form a dense protective film on the Q235 steel surface, preventing direct contact between the corrosive medium and the steel, thereby achieving corrosion inhibition. The corrosion behaviour of Q235 steel obtained from dynamic polarisation curves is highly consistent with the electrochemical impedance test results.

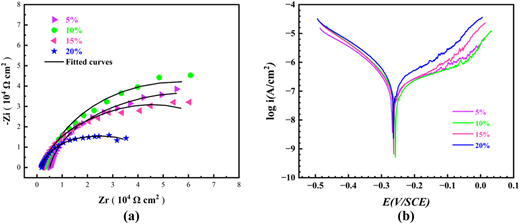
The primary component of the neutral cleaning agent is sodium fatty AES, which is a non-ionic surfactant. The corresponding Nyquist plots and polarisation curves for the neutral cleaning agent at different dilution concentrations are shown in Figure 4. As evident from Figure 4(a), the Nyquist plot comprises a large capacitive arc, indicating a relatively dense adsorption film of AES on the Q235 steel surface. Under these conditions, corrosion of carbon steel is primarily controlled by charge transfer processes. Furthermore, as the concentration of the neutral cleaning agent increases, the radius of the capacitive arc first enlarges and then diminishes, with the 10% concentration yielding the maximum capacitive arc. Moreover, at the same dilution concentration, the radius of the capacitive arc is significantly larger than that of the acidic cleaning agent, differing by 2 orders of magnitude. Neutral corrosive media exhibit greatly reduced corrosivity compared to acidic media, providing superior protection for carbon steel. The results indicate that AES demonstrates good corrosion inhibition effects on Q235 steel in neutral solutions, with the neutral cleaning agent concentration of 10% exhibiting the optimal protective effect; whilst the worst protection was observed at a 20% concentration. It can be inferred that prior to reaching a 10% concentration, increasing detergent concentration leads to progressively denser protective films forming on the Q235 steel surface, enhancing protection. Beyond this point, further increases in AES concentration may induce localised corrosion on the steel surface, reducing the capacitive arc radius.

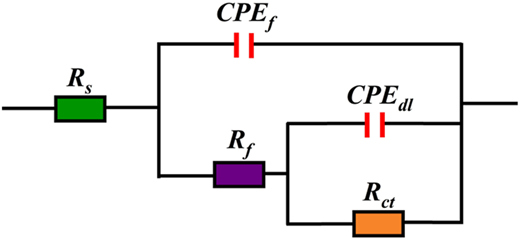
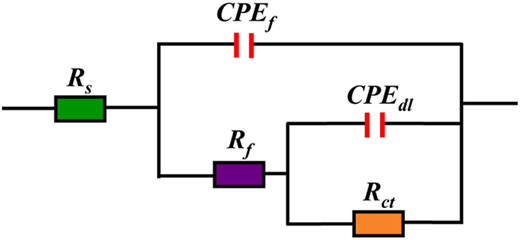
Impedance data for Q235 steel in the neutral cleaning solution was fitted using ZsimDemo software. The equivalent circuit is shown in Figure 5, with the obtained electrochemical parameters listed in Table 4. It is evident that the value of the polarisation resistance Rp first increases and then decreases with increasing detergent concentration, indicating that the resistance to corrosion behaviour initially increases before decreasing. The Rp value is highest at a 10% detergent concentration, demonstrating superior corrosion inhibition performance. Furthermore, the values of Cf and Cdl decrease as the detergent concentration increases from 5% to 10%, indicating adsorption behaviour of detergent molecules on the metal surface. When the concentration rises from 10% to 20%, Cf and Cdl increase, enhancing water absorption capacity and thereby adversely affecting the corrosion protection of carbon steel. The combined data for Rp, Cf, and Cdl collectively indicate that the protective efficacy of Q235 steel in neutral cleaning agents of varying concentrations first increases and then decreases with rising agent concentration.

The dynamic potential polarisation curves of Q235 steel in neutral cleaning agents of varying concentrations are depicted in Figure 4(b). It can be observed that as the cleaning agent concentration increases, the corrosion potential on the polarisation curve first shifts positively and then negatively. The cathodic portions of the polarisation curves for different concentrations are nearly superimposed, indicating that AES does not inhibit the cathodic reaction of Q235 steel in neutral cleaning agents. However, in the anodic section, the corrosion current density first decreases and then increases with rising detergent concentration, exhibiting greater displacement at higher concentrations. This demonstrates that AES significantly inhibits the anodic reaction of Q235 steel in neutral detergents.

As shown in Table 5, the corrosion current density icorr initially decreases then increases with rising cleaning agent concentration. Concurrently, the corrosion potential Ecorr initially increases then decreases with increasing cleaning agent concentration, though the displacement amplitude remains below 85 mV. As compound AES inhibits only the anodic reaction and the corrosion potential shift is less than 85 mV, it should be classified as a “modest” or “moderate” anodic corrosion inhibitor. Furthermore, βa and βc remained constant across varying detergent concentrations. As evident in Figure 4(b), the anodic and cathodic segments of the curves run parallel, indicating substantially identical slopes. This demonstrates that the protective mechanism of neutral detergents for Q235 steel is consistent, with the corrosion inhibitor primarily slowing the corrosion process by reducing reaction rates. From the above results, it can be inferred that AES achieves corrosion inhibition by forming a dense protective film on the Q235 steel surface, thereby preventing direct contact between the corrosive medium and the steel. The corrosion behaviour of Q235 steel obtained from dynamic polarisation curves is highly consistent with electrochemical impedance testing results.

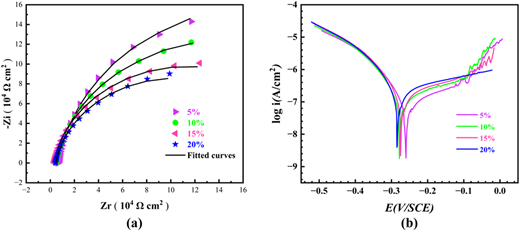
The primary constituents of the alkaline cleaning agent are triethanolamine and BTA, with BTA serving as the corrosion inhibitor component. Corresponding Nyquist plots and polarisation curves for alkaline cleaning agents at different dilution concentrations are shown in Figure 6. As evident from Figure 6(a), the Nyquist plot comprises a large capacitive arc, indicating that the BTA adsorption film on the Q235 steel surface is relatively dense. Under these conditions, carbon steel corrosion is primarily controlled through charge transfer processes. Furthermore, as the alkaline cleaning agent concentration increases, the radius of the capacitive arc decreases. At the same dilution concentration, the capacitive arc radius of the alkaline cleaning agent is larger than that of both acidic and neutral cleaning agents. In alkaline solutions, iron within carbon steel cannot react directly with alkalis. Furthermore, alkaline cleaning agents contain BTA corrosion inhibitors, rendering them the most effective protective agent among acidic, neutral, and alkaline cleaning solutions. Optimal protective performance was observed at a 5% alkaline cleaning agent concentration, while the worst protective effect was noted at 20% concentration. This indicates that at 5% concentration, a more compact protective film forms on the Q235 steel surface. Subsequently, despite increased cleaner concentration and heightened solution alkalinity, iron in the carbon steel undergoes slow oxidation reactions with water and oxygen. This generates trivalent iron ions that react with the alkali, thereby promoting corrosion and suppressing the protective action of BTA molecules, resulting in a reduced impedance arc radius.

Impedance data for Q235 steel in alkaline cleaning solutions were fitted using ZsimDemo software. The equivalent circuit is shown in Figure 7, with electrochemical parameters presented in Table 6. Table 6 indicates that the polarisation resistance Rp increases as cleaning agent concentration decreases, signifying enhanced resistance to corrosion behaviour and improved corrosion inhibition performance. Furthermore, the values of Cf and Cdl exhibit a decreasing trend with diminishing detergent concentration, indicating adsorption behaviour of the corrosion inhibitor molecules on the metal surface. This adsorption represents the gradual replacement of water molecules at the metal/solution interface by BTA. The combined data for Rp, Cf, and Cdl collectively indicate that the protective efficacy of Q235 steel in alkaline cleaning agents of varying concentrations diminishes as the concentration of the alkaline cleaning agent increases.

The dynamic potential polarisation curves of Q235 steel in alkaline cleaning agents of varying concentrations are depicted in Figure 6(b). It can be observed that as the cleaning agent concentration increases, the corrosion potential of the polarisation curve shifts negatively. The cathodic portions of the polarisation curves for different concentrations of cleaning agent are nearly superimposed, indicating that BAT does not inhibit the cathodic reaction of Q235 steel in alkaline cleaning agents. However, the anodic portion shows a decrease in corrosion current density as the cleaning agent concentration decreases, demonstrating that BAT significantly inhibits the anodic reaction of Q235 steel in alkaline cleaning agents.

Table 7 indicates that the corrosion current density icorr increases with rising cleaning agent concentration, whilst the corrosion potential Ecorr decreases concurrently. However, the displacement magnitude remains below 85 mV. As the compound BAT only inhibits the anodic reaction and the corrosion potential shift is less than 85 mV, it should be classified as a “modest” or “moderate” anodic corrosion inhibitor. Furthermore, the anodic polarisation curve exhibits significant alterations under different concentrations of alkaline cleaning agents, likely due to the presence of polar groups conferring strong anchoring adsorption properties to BAT. From the above results, it can be inferred that BAT achieves corrosion inhibition by forming a dense protective film on the Q235 steel surface, thereby preventing direct contact between the corrosive medium and the steel substrate. The corrosion behaviour of Q235 steel obtained from dynamic polarisation curves is highly consistent with electrochemical impedance testing results.

In summary, the protective efficacy of the 3 cleaning agents follows the order: alkaline > neutral > acidic. The steel exhibits the highest susceptibility to corrosion in the acidic cleaning agent and the lowest susceptibility in the alkaline cleaning agent.

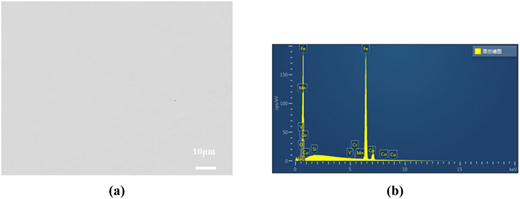
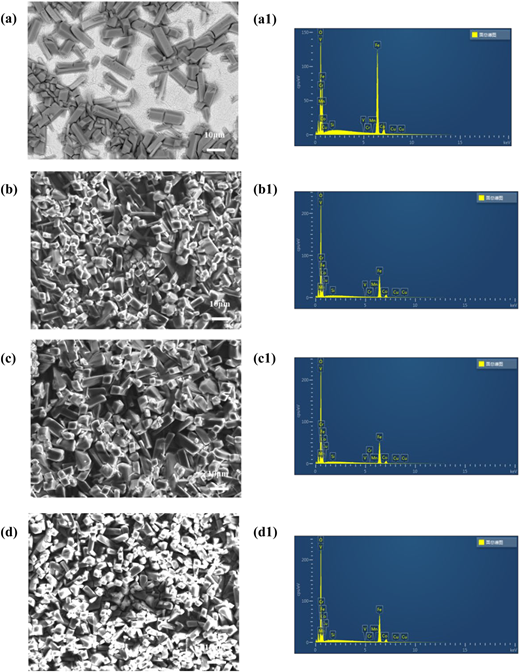
SEM and energy-dispersive X-ray spectroscopy (EDS) quantitative analysis of freshly polished Q235 steel are shown in Figure 8 below. After polishing, Q235 steel samples were immersed in acidic cleaning agents diluted to varying concentrations (containing 5%, 10%, 15%, and 20% cleaning agent). The SEM images and EDS results for these samples are presented in Figure 9 below. As depicted in Figure 8(a), the freshly polished Q235 steel surface exhibits a smooth, lustrous finish with only minor scratches visible post-grinding. Following immersion in acidic cleaning solutions of varying concentrations for 6 hours, Figure 9(a)–(d) reveal numerous fluffy, rod-like corrosion products forming on the steel surface. This phenomenon indicates that Q235 steel exhibits poor resistance to oxalic acid corrosion. The corrosion products become denser with increasing acid cleaner concentration, suggesting that thiourea molecules effectively adsorb onto the metal surface to form a protective film that inhibits corrosion. However, as the acid cleaner concentration increases, the corrosion products proliferate, with the most severe corrosion occurring at a 20% cleaner concentration.

As indicated by the quantitative analysis in Figure 8(b) EDS, the freshly polished Q235 steel surface primarily consists of Fe, accounting for 99.03% of the composition. Figure 9(a1)–(d1) demonstrate that following immersion in the acidic cleaning solution, the Fe content decreases while O content increases significantly. This is attributable to corrosion of the Q235 steel in the acidic cleaning solution, resulting in the formation of oxidation products. In the 5% acidic cleaning solution, the Fe content was 83.04% and the O content was 16.74%; in the 20% acidic cleaning agent, the Fe content was 39.74% and the O content was 54.78%. The higher the concentration of the acidic cleaning agent, the more severe the oxidation, i.e., the more severe the corrosion. This is consistent with the aforementioned electrochemical results, namely that the 5% acidic cleaning agent exhibits the best corrosion prevention effect, while the 20% acidic cleaning agent exhibits the worst corrosion prevention effect.

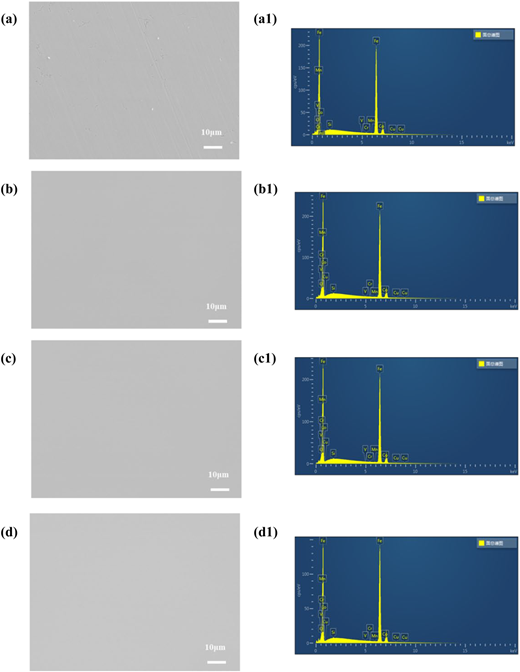
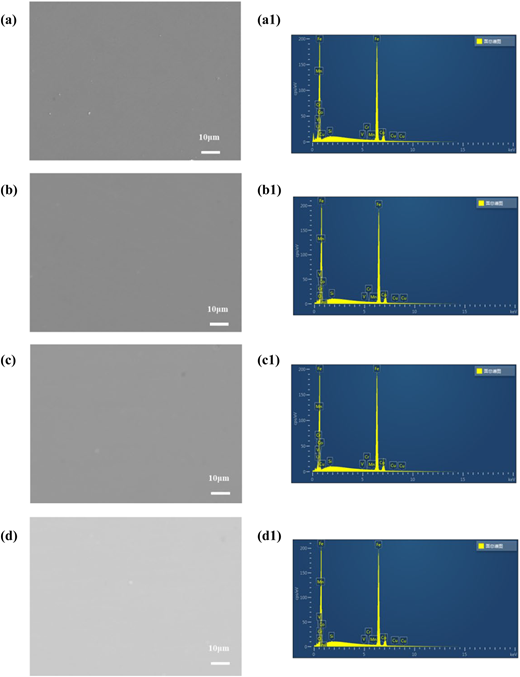
Q235 steel was polished and immersed in neutral and alkaline cleaning agents diluted to different concentrations (containing 5%, 10%, 15%, and 20% cleaning agent). The SEM images and EDS results for the Q235 steel samples are shown in Figures 10 and 11 below following immersion for 6 hours in neutral and alkaline cleaning agents at varying concentrations. Figures 10(a)–(d) and 11(a)–(d) reveal that the Q235 steel surface exhibits reduced gloss compared to the freshly polished, untreated surface in Figure 8(a). Nevertheless, the surface remains smooth with minimal corrosion product formation. This phenomenon indicates that neutral and alkaline cleaning agents provide effective protective action for Q235 steel, significantly mitigating corrosion.

As shown in Figures 10(a1)–(d1) and 11(a1)–(d1), following immersion in neutral and alkaline cleaning agents, the Q235 steel surface predominantly contained only iron Fe. After exposure to neutral cleaning agents of varying concentrations, the Fe content on the Q235 steel surface exceeded 98% in all cases. Similarly, after immersion in alkaline cleaning agents of different concentrations, the Fe content on the Q235 steel surface exceeded 99% in all instances. These results indicate that Q235 steel exhibits excellent protective performance in both neutral and alkaline cleaning agents, with virtually no corrosion occurring. No significant differences were observed in surface microstructure or quantitative elemental analysis between cleaning agents of varying concentrations.

A comprehensive comparison of the microstructure and EDS surface element quantification of Q235 steel in 3 types of cleaning agents–acidic, neutral, and alkaline–at varying dilution concentrations reveals that acidic cleaning agents cause the most severe corrosion and provide the poorest protection for Q235 steel. Neutral and alkaline cleaning agents, however, offer excellent protective effects, effectively delaying corrosion.

  1. Thiourea molecules in acidic cleaning agents form a protective film on the surface of Q235 steel through physical adsorption and chemical bonding, effectively inhibiting corrosion. Due to the concentration balance and synergistic effect, the stability of the film is enhanced. The best effect is achieved at a concentration of 5%, but excessive acidity inhibits the corrosion inhibitor effect. The alkaline cleaning agent containing triethanolamine and BTA forms a dense protective film on the surface of Q235 steel. The best protective effect is achieved at a concentration of 5%, but corrosion is promoted at a concentration of 20% due to increased alkalinity; A stable film is formed when the concentration of neutral cleaning agent (including AES) is 10%, and the protective effect is optimal, but excessive concentration may induce local corrosion.

  2. Through electrochemical research, the protective effects of acid, medium, and alkaline cleaning agents meet the requirements of alkaline > neutral > acidic. It is most prone to corrosion in acidic cleaning agents and less prone to corrosion in alkaline cleaning agents. The synergistic effect of corrosion inhibitors (such as BTA, thiourea) and cleaning agent concentration is the key factor affecting the protective effect. At low concentrations, the corrosion inhibitor molecules adsorb uniformly, forming a dense film; When the concentration is high, the acidity and alkalinity of the cleaning agent increase, which destroys the stability of the membrane and leads to a decrease in corrosion inhibition efficiency.

  3. Optimising the concentration of cleaning agents is the key to improving protective performance. Alkaline cleaning agents should be controlled at around 5%, neutral cleaning agents at 10% concentration, and acidic cleaning agents should maintain a concentration of 5% to avoid corrosion inhibitor deactivation. This provides a scientific basis for industrial cleaning and emphasises the balance between concentration and the synergistic effect of corrosion inhibitors.
Deng
,
Y. C.
,
Xu
,
X. Y.
,
Wang
,
F.
,
Feng
,
Z. H.
,
Ji
,
C.
, &
Liu
,
L. X.
(
2023
).
Corrosion behaviors of three metals used in heat exchangers after being treated with an alkaline cleaner
.
Electroplating and Finishing
,
42
(
12
),
17
22
.
Du
,
W.
,
Shao
,
Q.
,
Zhang
,
B.
,
Yin
,
Z. Y.
,
Xiang
,
R. H.
,
Liu
,
Y. S.
,
Li
,
Y.
(
2024
).
Comparative study on performance of gearbox cleaning agent
.
Advanced Materials of High-Speed Railway
,
3
(
2
),
53
56
.
Guo
,
J.
,
He
,
B.
, &
Bai
,
X. H.
(
2016
).
Effect of chloride contaminated sand on the electrochemical corrosion behavior of X70 steel in early stage
.
Science Technology and Engineering
,
16
(
32
),
325
331
.
Haque
,
J.
,
Zulkifli
,
M. F. R.
,
Ismail
,
N.
,
Quraishi
,
M. A.
,
Ghazali
,
M. S. M.
,
Berdimurodov
,
E.
, &
Nik
,
W. M. N. B. W.
(
2023
).
Environmentally benign water-soluble sodium L-2-(1-Imidazolyl) alkanoic acids as new corrosion inhibitors for mild steel in artificial seawater
.
ACS Omega
,
8
(
28
),
24797
24812
. doi: .
Huang
,
L.
,
Liu
,
Z. Y.
,
Du
,
C. W.
,
Liu
,
R. K.
,
Wang
,
B.
,
Li
,
Y. Q.
, &
Li
,
X. G.
(
2015
).
Stress corrosion cracking failure of Q235B steel used for sulfur-containing waste water tank
.
Surface Technology
,
44
(
03
),
52
56
.
Ji
,
F. D.
,
Ji
,
D. D.
, &
Fan
,
X.
(
2023
).
Preparation and performance study of an environmentally friendly metal cleaner
.
Speciality Petrochemicals
,
40
(
6
),
51
55
.
Liu
,
H. P.
(
2020
).
Overview of water-based metal cleaner technology
.
Tianjin Chemical Industry
,
34
(
6
),
1
4
.
Luo
,
T.
,
Chen
,
Y.
,
Zhou
,
X.
,
Wang
,
Z. L.
,
Chen
,
M. J.
,
Hu
,
J.
, &
Yu
,
H. L.
(
2021a
).
Synthesis and performance study of Q235 carbon steel corrosion inhibitor lauric acid diethanolamine
.
Neijiang Technology
,
42
(
11
),
20
21
.
Luo
,
W. J.
,
Xu
,
Y. Q.
,
Le
,
X. G.
,
Zhang
,
L. R.
,
Song
,
J. W.
, &
Deng
,
J. H.
(
2021b
).
Study on corrosion rate of acid cleaning agent to stainless steel
.
China Cleaning Industry
,
5
,
59
63
.
Pan
,
M. Z.
,
Cai
,
J.
, &
Yu
,
M.
(
2010
).
Corrosion inhibition of gum leaves extracts in acidic medium for A3 steel
.
Chemical Engineer
,
24
(
2
),
70
72
.
Rouifi
,
Z.
,
Benhiba
,
F.
,
Faydy
,
M.
,
Laabaissi
,
T.
,
Oudda
,
H.
,
Lakhrissi
,
B.
,
Zarrouk
,
A.
(
2021
).
8-Hydroxyquinoline grafted triazole derivatives as corrosion inhibitors for carbon steel in H2SO4 solution: Electrochemical and theoretical studies
.
Ionics
,
27
(
5
),
2267
2288
. doi: .
Wang
,
S.
,
Liang
,
Z.
,
Hong
,
Q.
,
Wang
,
B.
,
Cao
,
Y.
,
Ren
,
G.
,
Chen
,
D.
(
2024
).
Green route to prepare robust and multifunctional superhydrophobic coatings
.
Ceramics International
,
50
(
3
),
Part B
,
5857
5867
. doi: .
Wang
,
P. S.
,
Xin
,
T.
,
Chen
,
P.
,
Wang
,
S.
, &
Cheng
,
Di.
(
2025
).
Buoyancy characteristic analysis and optimization of precast concrete slab track during casting process of self-compacting concrete
.
Railway Sciences
,
4
(
2
),
159
173
. doi: .
Zhang
,
S. L.
,
Li
,
M. J.
,
Wang
,
X. B.
, &
Chen
,
S. B.
(
2007
).
Intergranular corrosion of 18-8 austenitic stainless steel
.
Journal of Chinese Society for Corrosion and Protection
,
2
,
124
128
.
Zhang
,
L. L.
,
Jiao
,
Q. Z.
,
Wang
,
J.
,
Yang
,
T.
,
Jiang
,
X. Y.
,
Lin
,
L. J.
,
Zhao
,
Y.
(
2016
).
Development of corrosion inhibitor JLL-1 at high temperature using solid cleaning agent
.
Cleaning World
,
32
(
3
),
29
34
.
Zhang
,
Y. L.
,
Han
,
L.
, &
Song
,
X. L.
(
2018
).
Stress corrosion cracking behavior of austenitic stainless steel in sulfur containing waste water
.
Corrosion Science and Protection Technology
,
30
(
5
),
513
517
.
Zheng
,
F. D.
,
Yi
,
S. Z.
,
Zhao
,
H. H.
,
Zhang
,
L. H.
, &
Li
,
J. H.
(
2017
).
Development of a weak acidic rust remover
.
Electroplating & Pollution Control
,
37
(
5
),
41
43
.
Published in Railway Sciences. Published by Emerald Publishing Limited. This article is published under the Creative Commons Attribution (CC BY 4.0) licence. Anyone may reproduce, distribute, translate and create derivative works of this article (for both commercial and non-commercial purposes), subject to full attribution to the original publication and authors. The full terms of this licence may be seen at Link to the terms of the CC BY 4.0 licence.

Data & Figures

Figure 1
A micrograph shows polygonal grains with darker boundary regions and a red 10-micrometer scale bar.The image is a grayscale metallographic micrograph showing a polycrystalline microstructure composed of irregular, polygonal grains. Light gray regions form the majority of the field and represent individual grains, separated by darker gray to black interconnected boundary networks. Several grains contain faint internal contrast patterns, while numerous small dark speckles are scattered throughout the microstructure, indicating fine pores, precipitates, or etching artifacts. Grain shapes vary in size and geometry, with curved and straight boundaries forming a continuous network across the image. Some darker regions appear clustered along grain boundaries and triple junctions, emphasizing intergranular contrast. At the bottom right corner, a red scale bar labeled “10 micrometers” provides spatial reference.

Metallographic analysis of Q235 steel. Source(s): Authors’ own work

Figure 1
A micrograph shows polygonal grains with darker boundary regions and a red 10-micrometer scale bar.The image is a grayscale metallographic micrograph showing a polycrystalline microstructure composed of irregular, polygonal grains. Light gray regions form the majority of the field and represent individual grains, separated by darker gray to black interconnected boundary networks. Several grains contain faint internal contrast patterns, while numerous small dark speckles are scattered throughout the microstructure, indicating fine pores, precipitates, or etching artifacts. Grain shapes vary in size and geometry, with curved and straight boundaries forming a continuous network across the image. Some darker regions appear clustered along grain boundaries and triple junctions, emphasizing intergranular contrast. At the bottom right corner, a red scale bar labeled “10 micrometers” provides spatial reference.

Metallographic analysis of Q235 steel. Source(s): Authors’ own work

Close modal
Figure 2
A graph shows electrochemical impedance and polarization curves for four samples: 5 percent through 20 percent.The figure contains two side-by-side plots labeled (a) and (b), comparing electrochemical behavior for four compositions: 5 percent, 10 percent, 15 percent, and 20 percent. Panel (a) presents Nyquist plots with the horizontal axis labeled “Z r (Ohm squared centimeters)” ranging from negative 100 to 400 with an interval of 50 and the vertical axis labeled “negative Z i (Ohm squared centimeters)” ranging from negative 100 to 400 with an interval of 50. Distinct symbols at the legend represent experimental data for each composition: 5 percent (right-pointing triangles), 10 percent (circles), 15 percent (left-pointing triangles), and 20 percent (stars). Solid lines labeled “Fitted curves” overlay each dataset. All curves form depressed semicircular arcs typical of impedance spectra. The 5 percent sample shows the largest semicircle, extending furthest to the right (Z r near 350) and the highest negative Z i values (around 140). The 10 percent and 15 percent samples display intermediate arc sizes, while the 20 percent sample exhibits the smallest semicircle, centered around Z r values near 150–200 with peak negative Z i near roughly 70–80. The trend indicates decreasing impedance arc diameter with increasing percentage from 5 percent to 20 percent. Panel (b) shows polarization curves plotted as “log i (A per centimeter square)” on the vertical axis ranging from negative 8 to negative 3 with an interval of 1 versus “E (V per S C E)” on the horizontal axis ranging from negative 0.9 to negative 0.3 with an interval of 0.1. Four lines correspond to the same compositions: 5 percent, 10 percent, 15 percent, and 20 percent. Each curve exhibits a sharp minimum near E equals negative 0.55, forming a V-shaped profile characteristic of corrosion polarization behavior. The 15 percent curve reaches the lowest current density at the minimum (around log i equals 8), while the other compositions show slightly higher minima. Toward both more negative and more positive potentials, all curves rise smoothly, with the 20 percent sample generally exhibiting higher current densities than the others over much of the potential range. Note: All the numerical data values are approximated.

Electrochemical impedance spectra (a) and potentiodynamic polarisation curves (b) of Q235 steel in acidic cleaning agents containing different concentrations (5%, 10%, 15%, 20%) at 298 K. Source(s): Authors’ own work

Figure 2
A graph shows electrochemical impedance and polarization curves for four samples: 5 percent through 20 percent.The figure contains two side-by-side plots labeled (a) and (b), comparing electrochemical behavior for four compositions: 5 percent, 10 percent, 15 percent, and 20 percent. Panel (a) presents Nyquist plots with the horizontal axis labeled “Z r (Ohm squared centimeters)” ranging from negative 100 to 400 with an interval of 50 and the vertical axis labeled “negative Z i (Ohm squared centimeters)” ranging from negative 100 to 400 with an interval of 50. Distinct symbols at the legend represent experimental data for each composition: 5 percent (right-pointing triangles), 10 percent (circles), 15 percent (left-pointing triangles), and 20 percent (stars). Solid lines labeled “Fitted curves” overlay each dataset. All curves form depressed semicircular arcs typical of impedance spectra. The 5 percent sample shows the largest semicircle, extending furthest to the right (Z r near 350) and the highest negative Z i values (around 140). The 10 percent and 15 percent samples display intermediate arc sizes, while the 20 percent sample exhibits the smallest semicircle, centered around Z r values near 150–200 with peak negative Z i near roughly 70–80. The trend indicates decreasing impedance arc diameter with increasing percentage from 5 percent to 20 percent. Panel (b) shows polarization curves plotted as “log i (A per centimeter square)” on the vertical axis ranging from negative 8 to negative 3 with an interval of 1 versus “E (V per S C E)” on the horizontal axis ranging from negative 0.9 to negative 0.3 with an interval of 0.1. Four lines correspond to the same compositions: 5 percent, 10 percent, 15 percent, and 20 percent. Each curve exhibits a sharp minimum near E equals negative 0.55, forming a V-shaped profile characteristic of corrosion polarization behavior. The 15 percent curve reaches the lowest current density at the minimum (around log i equals 8), while the other compositions show slightly higher minima. Toward both more negative and more positive potentials, all curves rise smoothly, with the 20 percent sample generally exhibiting higher current densities than the others over much of the potential range. Note: All the numerical data values are approximated.

Electrochemical impedance spectra (a) and potentiodynamic polarisation curves (b) of Q235 steel in acidic cleaning agents containing different concentrations (5%, 10%, 15%, 20%) at 298 K. Source(s): Authors’ own work

Close modal
Figure 3
A circuit diagram shows an equivalent electrical model with a resistor in series and three parallel branches.The figure presents an equivalent electrical circuit model drawn horizontally from left to right. At the far left, a resistor labeled R subscript S (solution resistance) is connected in series to the rest of the network. After R subscript S, the circuit splits into a rectangular parallel arrangement consisting of three branches that reconnect at the right side before continuing to the output. The upper branch contains a component labeled “C P E”, represented by two vertical capacitor-style plates, indicating a constant phase element. This C P E spans directly between the left and right nodes of the parallel section. The middle branch consists of a single resistor labeled R subscript c t, positioned centrally between the same two nodes, representing the charge-transfer resistance. The lower branch contains two elements connected in series: an inductor labeled L on the left, followed by a resistor labeled R subscript L on the right. Together, L and R subscript L form a series sub-branch that also connects between the left and right nodes of the parallel network.

Equivalent circuit used for fitting electrochemical impedance spectra of acidic cleaning agents. Source(s): Authors’ own work

Figure 3
A circuit diagram shows an equivalent electrical model with a resistor in series and three parallel branches.The figure presents an equivalent electrical circuit model drawn horizontally from left to right. At the far left, a resistor labeled R subscript S (solution resistance) is connected in series to the rest of the network. After R subscript S, the circuit splits into a rectangular parallel arrangement consisting of three branches that reconnect at the right side before continuing to the output. The upper branch contains a component labeled “C P E”, represented by two vertical capacitor-style plates, indicating a constant phase element. This C P E spans directly between the left and right nodes of the parallel section. The middle branch consists of a single resistor labeled R subscript c t, positioned centrally between the same two nodes, representing the charge-transfer resistance. The lower branch contains two elements connected in series: an inductor labeled L on the left, followed by a resistor labeled R subscript L on the right. Together, L and R subscript L form a series sub-branch that also connects between the left and right nodes of the parallel network.

Equivalent circuit used for fitting electrochemical impedance spectra of acidic cleaning agents. Source(s): Authors’ own work

Close modal
Figure 4
A graph shows electrochemical impedance and polarization curves for four samples: 5 percent through 20 percent.The figure contains two side-by-side plots labeled (a) and (b), comparing electrochemical behavior for four compositions: 5 percent, 10 percent, 15 percent, and 20 percent. Panel (a) presents Nyquist plots with the horizontal axis labeled “Z r (10 to the power 4 Ohm squared centimeters)” ranging from 0 to 8 with an interval of 1, and the vertical axis labeled “negative Z i (10 to the power 4 Ohm squared centimeters)” ranging from 0 to 8 with an interval of 1. Distinct symbols in the legend represent experimental data for each composition: 5 percent (right-pointing triangles in magenta), 10 percent (green circles), 15 percent (left-pointing triangles in pink), and 20 percent (blue stars). Black solid lines labeled “Fitted curves” overlay each dataset. All curves form rising, depressed semicircular impedance arcs. The 10 percent sample shows the largest arc, reaching Z r values near 6.5 and negative Z i near about 4.5. The 5 percent and 15 percent samples show intermediate responses, with peak negative Z i around 3 to 3.8. The 20 percent sample exhibits the smallest arc, with Z r below about 4 and peak negative Z i around 1.5. Overall, the impedance magnitude decreases from 10 percent to 20 percent, with 20 percent showing the lowest values. Panel (b) shows polarization curves plotted as “log i (A per centimeter square)” on the vertical axis ranging from negative 10 to negative 4 with an interval of 1 versus “E (V per S C E)” on the horizontal axis ranging from approximately negative 0.5 to 0.1 with an interval of about 0.1. Four colored curves correspond to the same compositions: 5 percent (magenta), 10 percent (green), 15 percent (pink), and 20 percent (blue). Each curve displays a pronounced V-shaped minimum near E equals approximately negative 0.26, characteristic of corrosion polarization behavior. The 10 percent curve reaches the lowest current density at the minimum (around log i equals negative 9.4), while the 20 percent curve shows the highest current densities on both anodic and cathodic branches. Toward both more negative and more positive potentials, all curves rise smoothly, with separation between compositions becoming more evident at higher potentials. Note: All numerical data values are approximated.

Electrochemical impedance spectra (a) and potentiodynamic polarisation curves (b) of Q235 steel at 298 K in neutral cleaning agents containing different concentrations (5%, 10%, 15%, 20%). Source(s): Authors’ own work

Figure 4
A graph shows electrochemical impedance and polarization curves for four samples: 5 percent through 20 percent.The figure contains two side-by-side plots labeled (a) and (b), comparing electrochemical behavior for four compositions: 5 percent, 10 percent, 15 percent, and 20 percent. Panel (a) presents Nyquist plots with the horizontal axis labeled “Z r (10 to the power 4 Ohm squared centimeters)” ranging from 0 to 8 with an interval of 1, and the vertical axis labeled “negative Z i (10 to the power 4 Ohm squared centimeters)” ranging from 0 to 8 with an interval of 1. Distinct symbols in the legend represent experimental data for each composition: 5 percent (right-pointing triangles in magenta), 10 percent (green circles), 15 percent (left-pointing triangles in pink), and 20 percent (blue stars). Black solid lines labeled “Fitted curves” overlay each dataset. All curves form rising, depressed semicircular impedance arcs. The 10 percent sample shows the largest arc, reaching Z r values near 6.5 and negative Z i near about 4.5. The 5 percent and 15 percent samples show intermediate responses, with peak negative Z i around 3 to 3.8. The 20 percent sample exhibits the smallest arc, with Z r below about 4 and peak negative Z i around 1.5. Overall, the impedance magnitude decreases from 10 percent to 20 percent, with 20 percent showing the lowest values. Panel (b) shows polarization curves plotted as “log i (A per centimeter square)” on the vertical axis ranging from negative 10 to negative 4 with an interval of 1 versus “E (V per S C E)” on the horizontal axis ranging from approximately negative 0.5 to 0.1 with an interval of about 0.1. Four colored curves correspond to the same compositions: 5 percent (magenta), 10 percent (green), 15 percent (pink), and 20 percent (blue). Each curve displays a pronounced V-shaped minimum near E equals approximately negative 0.26, characteristic of corrosion polarization behavior. The 10 percent curve reaches the lowest current density at the minimum (around log i equals negative 9.4), while the 20 percent curve shows the highest current densities on both anodic and cathodic branches. Toward both more negative and more positive potentials, all curves rise smoothly, with separation between compositions becoming more evident at higher potentials. Note: All numerical data values are approximated.

Electrochemical impedance spectra (a) and potentiodynamic polarisation curves (b) of Q235 steel at 298 K in neutral cleaning agents containing different concentrations (5%, 10%, 15%, 20%). Source(s): Authors’ own work

Close modal
Figure 5
A circuit diagram shows a resistor in series with parallel branches containing four elements in a subnetwork.The figure presents a color-coded equivalent electrical circuit model arranged horizontally from left to right. On the far left, a green rectangular resistor labeled R subscript S (solution resistance) is connected in series to the remainder of the circuit. Immediately after R subscript S, the circuit splits into a large parallel block with two main paths. The upper path contains a capacitor-style element labeled C P E subscript f, representing a constant phase element associated with the film or surface layer. This upper branch runs directly from the left junction to the right output node. The lower path begins with a rectangular resistor labeled R subscript f. After R subscript f, this lower branch splits again into a smaller parallel subnetwork. In the upper part of this subnetwork is a capacitor-style element labeled C P E subscript d l (double-layer constant phase element). In the lower part is another rectangular resistor labeled R subscript c t (charge-transfer resistance). These two components, C P E subscript d l and R subscript c t, are arranged in parallel with each other and reconnect at the right side. The outputs of the upper main branch (C P E subscript f) and the lower main branch (containing R subscript f followed by the C P E subscript d l–R subscript c t parallel pair) join at the rightmost node, completing the circuit.

Equivalent circuit used for fitting electrochemical impedance spectra of neutral and alkaline cleaning agents. Source(s): Authors’ own work

Figure 5
A circuit diagram shows a resistor in series with parallel branches containing four elements in a subnetwork.The figure presents a color-coded equivalent electrical circuit model arranged horizontally from left to right. On the far left, a green rectangular resistor labeled R subscript S (solution resistance) is connected in series to the remainder of the circuit. Immediately after R subscript S, the circuit splits into a large parallel block with two main paths. The upper path contains a capacitor-style element labeled C P E subscript f, representing a constant phase element associated with the film or surface layer. This upper branch runs directly from the left junction to the right output node. The lower path begins with a rectangular resistor labeled R subscript f. After R subscript f, this lower branch splits again into a smaller parallel subnetwork. In the upper part of this subnetwork is a capacitor-style element labeled C P E subscript d l (double-layer constant phase element). In the lower part is another rectangular resistor labeled R subscript c t (charge-transfer resistance). These two components, C P E subscript d l and R subscript c t, are arranged in parallel with each other and reconnect at the right side. The outputs of the upper main branch (C P E subscript f) and the lower main branch (containing R subscript f followed by the C P E subscript d l–R subscript c t parallel pair) join at the rightmost node, completing the circuit.

Equivalent circuit used for fitting electrochemical impedance spectra of neutral and alkaline cleaning agents. Source(s): Authors’ own work

Close modal
Figure 6
A graph shows electrochemical impedance and polarization curves for four samples: 5 percent through 20 percent.The figure contains two side-by-side plots labeled (a) and (b), comparing electrochemical behavior for four compositions: 5 percent, 10 percent, 15 percent, and 20 percent. Panel (a) presents Nyquist plots with the horizontal axis labeled “Z r (10 to the 4 power Ohm squared centimeters)” ranging from approximately negative 2 to 16 with an interval of about 2, and the vertical axis labeled “negative Z i (10 to the 4 power Ohm squared centimeters)” ranging from approximately negative 2 to 16 with an interval of about 2. Distinct symbols in the legend represent experimental data for each composition: 5 percent (right-pointing triangles), 10 percent (circles), 15 percent (left-pointing triangles), and 20 percent (stars). Solid lines labeled “Fitted curves” overlay each dataset. All curves form rising, depressed semicircular impedance arcs. The 5 percent sample exhibits the largest arc, extending to Z r near about 13 and peaking at negative Z i around 14. The 10 percent sample shows slightly smaller values, reaching Z r near 11–12 with peak negative Z i near 12. The 15 percent sample reaches Z r around 10 with peak negative Z i near 10. The 20 percent sample displays the smallest arc, with Z r below about 9 and peak negative Z i near 8.5. Overall, the impedance magnitude decreases progressively from 5 percent to 20 percent. Panel (b) shows polarization curves plotted as “log i (A per centimeter square)” on the vertical axis ranging from approximately negative 9 to negative 4 with an interval of 1 versus “E (V per S C E)” on the horizontal axis ranging from approximately negative 0.5 to 0.0 with an interval of about 0.1. Four colored curves correspond to the same compositions: 5 percent (magenta), 10 percent (green), 15 percent (pink), and 20 percent (blue). Each curve displays a sharp V-shaped minimum near E equals approximately negative 0.26-0.28, characteristic of corrosion polarization behavior. The 5 percent curve reaches the lowest current density at the minimum (around log i equals negative 8.8 to negative 9), while the 20 percent curve generally shows higher current densities on both anodic and cathodic branches. Toward more positive potentials, the 10 percent and 15 percent curves rise more steeply, whereas the 20 percent curve remains comparatively flatter. Note: All numerical data values are approximated.

Electrochemical impedance spectra (a) and potentiodynamic polarisation curves (b) of Q235 steel at 298 K in alkaline cleaning agents containing different concentrations (5%, 10%, 15%, 20%). Source(s): Authors’ own work

Figure 6
A graph shows electrochemical impedance and polarization curves for four samples: 5 percent through 20 percent.The figure contains two side-by-side plots labeled (a) and (b), comparing electrochemical behavior for four compositions: 5 percent, 10 percent, 15 percent, and 20 percent. Panel (a) presents Nyquist plots with the horizontal axis labeled “Z r (10 to the 4 power Ohm squared centimeters)” ranging from approximately negative 2 to 16 with an interval of about 2, and the vertical axis labeled “negative Z i (10 to the 4 power Ohm squared centimeters)” ranging from approximately negative 2 to 16 with an interval of about 2. Distinct symbols in the legend represent experimental data for each composition: 5 percent (right-pointing triangles), 10 percent (circles), 15 percent (left-pointing triangles), and 20 percent (stars). Solid lines labeled “Fitted curves” overlay each dataset. All curves form rising, depressed semicircular impedance arcs. The 5 percent sample exhibits the largest arc, extending to Z r near about 13 and peaking at negative Z i around 14. The 10 percent sample shows slightly smaller values, reaching Z r near 11–12 with peak negative Z i near 12. The 15 percent sample reaches Z r around 10 with peak negative Z i near 10. The 20 percent sample displays the smallest arc, with Z r below about 9 and peak negative Z i near 8.5. Overall, the impedance magnitude decreases progressively from 5 percent to 20 percent. Panel (b) shows polarization curves plotted as “log i (A per centimeter square)” on the vertical axis ranging from approximately negative 9 to negative 4 with an interval of 1 versus “E (V per S C E)” on the horizontal axis ranging from approximately negative 0.5 to 0.0 with an interval of about 0.1. Four colored curves correspond to the same compositions: 5 percent (magenta), 10 percent (green), 15 percent (pink), and 20 percent (blue). Each curve displays a sharp V-shaped minimum near E equals approximately negative 0.26-0.28, characteristic of corrosion polarization behavior. The 5 percent curve reaches the lowest current density at the minimum (around log i equals negative 8.8 to negative 9), while the 20 percent curve generally shows higher current densities on both anodic and cathodic branches. Toward more positive potentials, the 10 percent and 15 percent curves rise more steeply, whereas the 20 percent curve remains comparatively flatter. Note: All numerical data values are approximated.

Electrochemical impedance spectra (a) and potentiodynamic polarisation curves (b) of Q235 steel at 298 K in alkaline cleaning agents containing different concentrations (5%, 10%, 15%, 20%). Source(s): Authors’ own work

Close modal
Figure 7
A circuit diagram shows a resistor in series with parallel branches containing other elements in a subnetwork.The figure presents a color-coded equivalent electrical circuit model arranged horizontally from left to right. On the far left, a green rectangular resistor labeled R subscript S (solution resistance) is connected in series to the remainder of the circuit. Immediately after R subscript S, the circuit splits into a large parallel block with two main paths. The upper path contains a capacitor-style element labeled C P E subscript f, representing a constant phase element associated with the film or surface layer. This upper branch runs directly from the left junction to the right output node. The lower path begins with a rectangular resistor labeled R subscript f. After R subscript f, this lower branch splits again into a smaller parallel subnetwork. In the upper part of this subnetwork is a capacitor-style element labeled C P E subscript d l (double-layer constant phase element). In the lower part is another rectangular resistor labeled R subscript c t (charge-transfer resistance). These two components, C P E subscript d l and R subscript c t, are arranged in parallel with each other and reconnect at the right side. The outputs of the upper main branch (C P E subscript f) and the lower main branch (containing R subscript f followed by the C P E subscript d l–R subscript c t parallel pair) join at the rightmost node, completing the circuit.

Equivalent circuit used for fitting electrochemical impedance spectra of neutral and alkaline cleaning agents. Source(s): Authors’ own work

Figure 7
A circuit diagram shows a resistor in series with parallel branches containing other elements in a subnetwork.The figure presents a color-coded equivalent electrical circuit model arranged horizontally from left to right. On the far left, a green rectangular resistor labeled R subscript S (solution resistance) is connected in series to the remainder of the circuit. Immediately after R subscript S, the circuit splits into a large parallel block with two main paths. The upper path contains a capacitor-style element labeled C P E subscript f, representing a constant phase element associated with the film or surface layer. This upper branch runs directly from the left junction to the right output node. The lower path begins with a rectangular resistor labeled R subscript f. After R subscript f, this lower branch splits again into a smaller parallel subnetwork. In the upper part of this subnetwork is a capacitor-style element labeled C P E subscript d l (double-layer constant phase element). In the lower part is another rectangular resistor labeled R subscript c t (charge-transfer resistance). These two components, C P E subscript d l and R subscript c t, are arranged in parallel with each other and reconnect at the right side. The outputs of the upper main branch (C P E subscript f) and the lower main branch (containing R subscript f followed by the C P E subscript d l–R subscript c t parallel pair) join at the rightmost node, completing the circuit.

Equivalent circuit used for fitting electrochemical impedance spectra of neutral and alkaline cleaning agents. Source(s): Authors’ own work

Close modal
Figure 8
A two-panel figure shows a surface micrograph and an E D S elemental spectrum of the sample.The figure contains two panels labeled (a) and (b), presenting surface morphology and elemental composition of the material. Panel (a) shows a grayscale microscopic image of the sample surface. The field of view appears smooth and uniform, with faint diagonal polishing marks and a few tiny scattered dark specks. A scale bar in the lower right corner is labeled “10 micrometers”, indicating the spatial reference of the micrograph. Panel (b) presents an energy-dispersive X-ray spectroscopy (E D S) spectrum plotted with a horizontal axis labeled “kiloelectron volts” ranging from 0 to 15 with an interval of 5 and the vertical axis labeled “c p s per electron volt”, ranging from 0 to 150 with an interval of 50. The spectrum is displayed as a yellow-filled curve on a blue background. Two dominant peaks labeled “F e” appear near low energies of 0.7 kiloelectron volts and around 6.5 kiloelectron volts, indicating iron as the primary element. Additional smaller labeled peaks correspond to “M n”, “C r”, “V”, “C o”, “S i”, O”, and “C u”, appearing mainly below 10 kiloelectron volts. Minor “C u” peaks are visible at higher energies, likely associated with the measurement setup.

(a) SEM image; (b) EDS quantitative analysis image of newly polished Q235 steel at 298 K. Source(s): Authors’ own work

Figure 8
A two-panel figure shows a surface micrograph and an E D S elemental spectrum of the sample.The figure contains two panels labeled (a) and (b), presenting surface morphology and elemental composition of the material. Panel (a) shows a grayscale microscopic image of the sample surface. The field of view appears smooth and uniform, with faint diagonal polishing marks and a few tiny scattered dark specks. A scale bar in the lower right corner is labeled “10 micrometers”, indicating the spatial reference of the micrograph. Panel (b) presents an energy-dispersive X-ray spectroscopy (E D S) spectrum plotted with a horizontal axis labeled “kiloelectron volts” ranging from 0 to 15 with an interval of 5 and the vertical axis labeled “c p s per electron volt”, ranging from 0 to 150 with an interval of 50. The spectrum is displayed as a yellow-filled curve on a blue background. Two dominant peaks labeled “F e” appear near low energies of 0.7 kiloelectron volts and around 6.5 kiloelectron volts, indicating iron as the primary element. Additional smaller labeled peaks correspond to “M n”, “C r”, “V”, “C o”, “S i”, O”, and “C u”, appearing mainly below 10 kiloelectron volts. Minor “C u” peaks are visible at higher energies, likely associated with the measurement setup.

(a) SEM image; (b) EDS quantitative analysis image of newly polished Q235 steel at 298 K. Source(s): Authors’ own work

Close modal
Figure 9
A multi-panel figure shows S E M microstructures and corresponding E D S spectra for four samples labeled (a)–(d).The figure presents paired scanning electron microscopy (S E M) images and energy-dispersive X-ray spectroscopy (E D S) spectra for four conditions, arranged in four rows. The left column shows S E M morphology images labeled (a), (b), (c), and (d), while the right column shows the corresponding E D S spectra labeled (a 1), (b 1), (c 1), and (d 1). Each S E M image includes a scale bar of 10 micrometers. Panel (a) shows rod-like and plate-like particles distributed unevenly across a lighter background, with several clustered regions of elongated rectangular grains. Individual particles appear relatively large and sparsely packed, with noticeable agglomeration in localized areas. Panel (a 1) displays the E D S spectrum for (a), plotted as counts per second per electron volt versus energy in kiloelectron volts. The horizontal axis is labeled “kiloelectron volts”, ranging from 0 to 15 with an interval of 5, and the vertical axis is labeled “c p s per electron volt”, ranging from 0 to 150 with an interval of 50. Strong peaks are labeled for O, V, and F e, with additional smaller peaks corresponding to elements such as M n, C r, S i, and C u. Iron and oxygen dominate the spectrum, indicating an F e-based oxide composition with minor alloying elements. Panel (b) shows a denser microstructure composed of smaller, more uniformly distributed blocky and angular particles. Compared with (a), the grains are more compact and closely packed, forming a continuous granular surface. Panel (b 1) has the horizontal axis labeled “kiloelectron volts”, ranging from 0 to 15 with an interval of 5, and the vertical axis labeled “c p s per electron volt”, ranging from 0 to 200 with an interval of 50. The E D S spectrum for (b), again, shows prominent O, V, and F e peaks, with detectable signals from M n, C r, S i, and C u. The relative intensities differ slightly from (a 1), but iron and oxygen remain the primary constituents. Panel (c) presents a microstructure of tightly packed, short prismatic, and cuboid-shaped particles with sharper edges. The surface appears more homogeneous than in (a) and (b), with reduced large agglomerates and a finer overall grain size. Panel (c 1) shows the corresponding E D S spectrum, featuring strong O, V, and F e peaks and smaller contributions from M n, C r, S i, and C u. The elemental profile is similar to (b 1), with iron and oxygen still predominant. The axes are the same as in b 1. Panel (d) displays the most compact morphology among the four, consisting of densely packed, irregular polygonal particles. The grains appear smaller and more uniformly distributed, producing a relatively continuous textured surface. Panel (d 1), the E D S spectrum for (d), again highlights O, V, and F e as the major elements, accompanied by minor peaks for M n, C r, S i, and C u. Compared with the other spectra, the relative peak heights show subtle variations, but the overall elemental composition remains consistent across all samples. The axes are the same as in b 1. Note: All the numerical data values are approximated.

SEM images of Q235 steel samples at 298 K under different concentrations of acidic cleaning agents (a–d): (a) 5% cleaning agent, (b) 10% cleaning agent, (c) 15% cleaning agent,(d) 20% cleaning agent; EDS quantitative analysis images (a1-d1), (a1) 5% cleaning agent, (b1) 10% cleaning agent, (c1) 15% cleaning agent, (d1) 20% cleaning agent. Source(s): Authors’ own work

Figure 9
A multi-panel figure shows S E M microstructures and corresponding E D S spectra for four samples labeled (a)–(d).The figure presents paired scanning electron microscopy (S E M) images and energy-dispersive X-ray spectroscopy (E D S) spectra for four conditions, arranged in four rows. The left column shows S E M morphology images labeled (a), (b), (c), and (d), while the right column shows the corresponding E D S spectra labeled (a 1), (b 1), (c 1), and (d 1). Each S E M image includes a scale bar of 10 micrometers. Panel (a) shows rod-like and plate-like particles distributed unevenly across a lighter background, with several clustered regions of elongated rectangular grains. Individual particles appear relatively large and sparsely packed, with noticeable agglomeration in localized areas. Panel (a 1) displays the E D S spectrum for (a), plotted as counts per second per electron volt versus energy in kiloelectron volts. The horizontal axis is labeled “kiloelectron volts”, ranging from 0 to 15 with an interval of 5, and the vertical axis is labeled “c p s per electron volt”, ranging from 0 to 150 with an interval of 50. Strong peaks are labeled for O, V, and F e, with additional smaller peaks corresponding to elements such as M n, C r, S i, and C u. Iron and oxygen dominate the spectrum, indicating an F e-based oxide composition with minor alloying elements. Panel (b) shows a denser microstructure composed of smaller, more uniformly distributed blocky and angular particles. Compared with (a), the grains are more compact and closely packed, forming a continuous granular surface. Panel (b 1) has the horizontal axis labeled “kiloelectron volts”, ranging from 0 to 15 with an interval of 5, and the vertical axis labeled “c p s per electron volt”, ranging from 0 to 200 with an interval of 50. The E D S spectrum for (b), again, shows prominent O, V, and F e peaks, with detectable signals from M n, C r, S i, and C u. The relative intensities differ slightly from (a 1), but iron and oxygen remain the primary constituents. Panel (c) presents a microstructure of tightly packed, short prismatic, and cuboid-shaped particles with sharper edges. The surface appears more homogeneous than in (a) and (b), with reduced large agglomerates and a finer overall grain size. Panel (c 1) shows the corresponding E D S spectrum, featuring strong O, V, and F e peaks and smaller contributions from M n, C r, S i, and C u. The elemental profile is similar to (b 1), with iron and oxygen still predominant. The axes are the same as in b 1. Panel (d) displays the most compact morphology among the four, consisting of densely packed, irregular polygonal particles. The grains appear smaller and more uniformly distributed, producing a relatively continuous textured surface. Panel (d 1), the E D S spectrum for (d), again highlights O, V, and F e as the major elements, accompanied by minor peaks for M n, C r, S i, and C u. Compared with the other spectra, the relative peak heights show subtle variations, but the overall elemental composition remains consistent across all samples. The axes are the same as in b 1. Note: All the numerical data values are approximated.

SEM images of Q235 steel samples at 298 K under different concentrations of acidic cleaning agents (a–d): (a) 5% cleaning agent, (b) 10% cleaning agent, (c) 15% cleaning agent,(d) 20% cleaning agent; EDS quantitative analysis images (a1-d1), (a1) 5% cleaning agent, (b1) 10% cleaning agent, (c1) 15% cleaning agent, (d1) 20% cleaning agent. Source(s): Authors’ own work

Close modal
Figure 10
A multi-panel figure shows S E M surface morphologies and corresponding E D S spectra for four samples.The figure presents eight panels arranged in four rows and two columns, comparing surface morphology and elemental composition for four samples. The left column shows S E M images labeled (a), (b), (c), and (d), while the right column shows the corresponding E D S spectra labeled (a 1), (b 1), (c 1), and (d 1). Panels (a)–(d) are grayscale S E M micrographs, each with a scale bar of 10 micrometers at the lower right. Panel (a) shows a relatively smooth metallic surface with faint linear polishing marks and a few scattered small pits or defects. Panel (b) displays an even smoother and more uniform surface with minimal visible features. Panel (c) also shows a highly uniform surface with very subtle texture and no obvious pits. Panel (d) presents a similarly smooth and homogeneous surface, comparable to (b) and (c), with little visible roughness. Panels (a 1)–(d 1) show E D S energy spectra corresponding to each S E M image. In all four spectra, the horizontal axis is energy in kiloelectron volts, ranging from 0 to 15 with an interval of 5, and the vertical axis is labeled “c p s per electron volt”, ranging from 0 to 200 for a 1–c 1 and from 0 to 100 for d 1 with an interval of 50. Each spectrum is dominated by strong F e peaks of above 200 at 0.7 kiloelectron volts, indicating iron as the primary element. Smaller peaks labeled M n, C r, V, S i, O, and C u are also present in each case. In (a 1), strong F e peaks appear near low energy and around 6.5 kiloelectron volts, with additional smaller peaks for M n, C r, V, S i, O, and C u. In (b 1), F e again dominates, while M n, C r, V, S i, O, and C u are detected at lower intensities. In (c 1), the elemental distribution is similar, with prominent F e peaks and minor contributions from M n, C r, V, S i, O, and C u. In (d 1), Fe remains the strongest signal, accompanied by comparable minor peaks from M n, C r, V, S i, O, and C u. Across all four samples, the E D S results indicate consistent elemental compositions dominated by iron with small amounts of alloying or impurity elements, while the S E M images show smooth, compact surfaces with only subtle differences in texture. Note: All the numerical data values are approximated.

SEM images of Q235 steel specimens at 298 K under different concentrations of neutral cleaning agents (a–d): (a) 5% cleaning agent, (b) 10% cleaning agent, (c) 15% cleaning agent,(d) 20% cleaning agent; EDS quantitative analysis (a1-d1), (a1) 5% cleaning agent, (b1) 10% cleaning agent, (c1) 15% cleaning agent, (d1) 20% cleaning agent. Source(s): Authors’ own work

Figure 10
A multi-panel figure shows S E M surface morphologies and corresponding E D S spectra for four samples.The figure presents eight panels arranged in four rows and two columns, comparing surface morphology and elemental composition for four samples. The left column shows S E M images labeled (a), (b), (c), and (d), while the right column shows the corresponding E D S spectra labeled (a 1), (b 1), (c 1), and (d 1). Panels (a)–(d) are grayscale S E M micrographs, each with a scale bar of 10 micrometers at the lower right. Panel (a) shows a relatively smooth metallic surface with faint linear polishing marks and a few scattered small pits or defects. Panel (b) displays an even smoother and more uniform surface with minimal visible features. Panel (c) also shows a highly uniform surface with very subtle texture and no obvious pits. Panel (d) presents a similarly smooth and homogeneous surface, comparable to (b) and (c), with little visible roughness. Panels (a 1)–(d 1) show E D S energy spectra corresponding to each S E M image. In all four spectra, the horizontal axis is energy in kiloelectron volts, ranging from 0 to 15 with an interval of 5, and the vertical axis is labeled “c p s per electron volt”, ranging from 0 to 200 for a 1–c 1 and from 0 to 100 for d 1 with an interval of 50. Each spectrum is dominated by strong F e peaks of above 200 at 0.7 kiloelectron volts, indicating iron as the primary element. Smaller peaks labeled M n, C r, V, S i, O, and C u are also present in each case. In (a 1), strong F e peaks appear near low energy and around 6.5 kiloelectron volts, with additional smaller peaks for M n, C r, V, S i, O, and C u. In (b 1), F e again dominates, while M n, C r, V, S i, O, and C u are detected at lower intensities. In (c 1), the elemental distribution is similar, with prominent F e peaks and minor contributions from M n, C r, V, S i, O, and C u. In (d 1), Fe remains the strongest signal, accompanied by comparable minor peaks from M n, C r, V, S i, O, and C u. Across all four samples, the E D S results indicate consistent elemental compositions dominated by iron with small amounts of alloying or impurity elements, while the S E M images show smooth, compact surfaces with only subtle differences in texture. Note: All the numerical data values are approximated.

SEM images of Q235 steel specimens at 298 K under different concentrations of neutral cleaning agents (a–d): (a) 5% cleaning agent, (b) 10% cleaning agent, (c) 15% cleaning agent,(d) 20% cleaning agent; EDS quantitative analysis (a1-d1), (a1) 5% cleaning agent, (b1) 10% cleaning agent, (c1) 15% cleaning agent, (d1) 20% cleaning agent. Source(s): Authors’ own work

Close modal
Figure 11
A multi-panel figure shows S E M surface images and corresponding E D S spectra for four samples labeled (a) through (d).The figure presents eight panels arranged in four rows and two columns, comparing surface morphology and elemental composition for four samples. The left column contains grayscale S E M micrographs labeled (a), (b), (c), and (d), and the right column shows the corresponding E D S spectra labeled (a 1), (b 1), (c 1), and (d 1). Panels (a)–(d) are S E M images, each including a scale bar labeled 10 micrometers at the lower right corner. Panel (a) shows a relatively smooth metallic surface with faint diagonal polishing marks and several small scattered bright spots that appear as minor surface defects or particles. Panel (b) displays a more uniform and smoother surface with very subtle texture and almost no visible defects. Panel (c) also exhibits a highly homogeneous surface with minimal contrast variation and only a few faint isolated spots. Panel (d) presents a similarly smooth and compact surface, slightly brighter overall, with extremely limited visible features, indicating a highly uniform morphology. Panels (a 1)–(d 1) present the E D S energy spectra corresponding to each S E M image. In all spectra, the horizontal axis is energy in kiloelectron volts ranging approximately from 0 to 15 with an interval of 5, and the vertical axis is labeled “c p s per electron volt”, extending from 0 to about 200 with an interval of 50. Each spectrum is dominated by strong iron (F e) peaks, with a major peak of about 200 near a low energy of 0.6 kiloelectron volts and another prominent F e peak of about 180 around 6.5 kiloelectron volts. In (a 1), F e shows the highest intensity, accompanied by smaller labeled peaks for M n, C r, V, S i, O, and C u. In (b 1), F e again dominates the spectrum, while M n, C r, V, S i, O, and C u appear as minor peaks at lower intensities. In (c 1), the elemental distribution remains similar, with strong F e signals and consistently smaller contributions from M n, C r, V, S i, O, and C u. In (d 1), F e continues to be the principal element, with comparable minor peaks from M n, C r, V, S i, O, and C u. Note: All numerical values and peak intensities are approximate.

SEM images of Q235 steel specimens at 298 K under different concentrations of alkaline cleaning agents (a–d): (a) 5% cleaning agent, (b) 10% cleaning agent, (c) 15% cleaning agent,(d) 20% cleaning agent; EDS quantitative analysis (a1-d1), (a1) 5% cleaning agent, (b1) 10% cleaning agent, (c1) 15% cleaning agent, (d1) 20% cleaning agent. Source(s): Authors’ own work

Figure 11
A multi-panel figure shows S E M surface images and corresponding E D S spectra for four samples labeled (a) through (d).The figure presents eight panels arranged in four rows and two columns, comparing surface morphology and elemental composition for four samples. The left column contains grayscale S E M micrographs labeled (a), (b), (c), and (d), and the right column shows the corresponding E D S spectra labeled (a 1), (b 1), (c 1), and (d 1). Panels (a)–(d) are S E M images, each including a scale bar labeled 10 micrometers at the lower right corner. Panel (a) shows a relatively smooth metallic surface with faint diagonal polishing marks and several small scattered bright spots that appear as minor surface defects or particles. Panel (b) displays a more uniform and smoother surface with very subtle texture and almost no visible defects. Panel (c) also exhibits a highly homogeneous surface with minimal contrast variation and only a few faint isolated spots. Panel (d) presents a similarly smooth and compact surface, slightly brighter overall, with extremely limited visible features, indicating a highly uniform morphology. Panels (a 1)–(d 1) present the E D S energy spectra corresponding to each S E M image. In all spectra, the horizontal axis is energy in kiloelectron volts ranging approximately from 0 to 15 with an interval of 5, and the vertical axis is labeled “c p s per electron volt”, extending from 0 to about 200 with an interval of 50. Each spectrum is dominated by strong iron (F e) peaks, with a major peak of about 200 near a low energy of 0.6 kiloelectron volts and another prominent F e peak of about 180 around 6.5 kiloelectron volts. In (a 1), F e shows the highest intensity, accompanied by smaller labeled peaks for M n, C r, V, S i, O, and C u. In (b 1), F e again dominates the spectrum, while M n, C r, V, S i, O, and C u appear as minor peaks at lower intensities. In (c 1), the elemental distribution remains similar, with strong F e signals and consistently smaller contributions from M n, C r, V, S i, O, and C u. In (d 1), F e continues to be the principal element, with comparable minor peaks from M n, C r, V, S i, O, and C u. Note: All numerical values and peak intensities are approximate.

SEM images of Q235 steel specimens at 298 K under different concentrations of alkaline cleaning agents (a–d): (a) 5% cleaning agent, (b) 10% cleaning agent, (c) 15% cleaning agent,(d) 20% cleaning agent; EDS quantitative analysis (a1-d1), (a1) 5% cleaning agent, (b1) 10% cleaning agent, (c1) 15% cleaning agent, (d1) 20% cleaning agent. Source(s): Authors’ own work

Close modal
Table 1

Chemical composition and standard composition of Q235 steel

Test itemQuality indicatorTest result (%)
Standard requirement (%)
C0.14 ∼ 0.220.16
Si≤0.300.25
Mn0.30 to 0.650.63
P≤0.0450.025
S≤0.0500.004
Source(s): Authors’ own work
Table 2

Impedance parameters of Q235 steel at 298K in acidic cleaning agents containing different concentrations (5%, 10%, 15% and 20%)

C(%)Rs (Ω cm2)Rct (Ω cm2)CPE (Ω−1sncm−2)
5%10.7349.56.713 × 10−5
10%9.8228.98.19 × 10−5
15%13.2207.68.578 × 10−5
20%5.3190.78.224 × 10−5
Source(s): Authors’ own work
Table 3

Polarisation curve parameters of Q235 steel at 298K in acidic cleaning solution containing different concentrations (5%, 10%, 15% and 20%)

C (%)Ecorr (mV/SCE)βa (mV dec−1)βc (mV dec−1)icorr (μA cm−2)
5%−553.933−428.98
10%−541.225−3311.79
15%−533.729−7525.23
20%−525.529−7529.30
Source(s): Authors’ own work
Table 4

Impedance parameters of Q235 steel at 298K in neutral cleaning agents containing different concentrations (5%, 10%, 15% and 20%)

C(%)RS (Ω cm2)Rf (Ω cm2)Rct (Ω cm2)Cf (μF cm−2)n1Cdl (μF cm−2)n2
5%5,0617.329 × 1042.287 × 1046.055 × 10−50.87083.932 × 10−41
10%0.034863,0551.066 × 1054.878 × 10−100.80197.949 × 10−50.8505
15%2,1655.741 × 1042.209 × 1047.085 × 10−50.88223.433 × 10−41
20%1,8273.385 × 1049,7169.806 × 10−50.87621.119 × 10−31
Source(s): Authors’ own work
Table 5

Polarisation curve parameters of Q235 steel at 298K in neutral cleaning agent solutions with different concentrations (5%, 10%, 15% and 20%)

C (%)Ecorr (mV/SCE)βa (mV dec−1)βc (mV dec−1)icorr (μA cm−2)
5%−243.5100−1000.1161
10%−233100−1000.1148
15%−239.5100−1000.1303
20%−250.5100−1000.1884
Source(s): Authors’ own work
Table 6

Impedance parameters of Q235 steel at 298K in alkaline cleaning agents containing different concentrations (5%, 10%, 15% and 20%)

C(%)RS (Ω cm2)Rf (Ω cm2)Rct (Ω cm2)Cf (μF cm-2)n1Cdl (μF cm-2)n2
5%6,7093.693 × 1052.827 × 10111.108 × 10−50.91692.834 × 10−51
10%4.313 × 10−64,8752.85 × 1055.211 × 10−50.75275.548 × 10−50.9113
15%3,3011.931 × 1052.696 × 1045.54 × 10−50.92716.594 × 10−51
20%3.145 × 10−52,4651.989 × 1056.117 × 10−50.75476.645 × 10−50.9052
Source(s): Authors’ own work
Table 7

Polarisation curve parameters of Q235 steel at 298K in alkaline cleaning solution containing different concentrations (5%, 10%, 15% and 20%)

C (%)Ecorr (mV/SCE)βa (mV dec−1)βc (mV dec−1)icorr (μA cm−2)
5%−193.27266−1451.686 × 10−7
10%−204.00302−1462.175 × 10−7
15%−208.15317−1472.7 × 10−7
20%−222.61373−1453.106 × 10−7
Source(s): Authors’ own work

Supplements

References

Deng
,
Y. C.
,
Xu
,
X. Y.
,
Wang
,
F.
,
Feng
,
Z. H.
,
Ji
,
C.
, &
Liu
,
L. X.
(
2023
).
Corrosion behaviors of three metals used in heat exchangers after being treated with an alkaline cleaner
.
Electroplating and Finishing
,
42
(
12
),
17
22
.
Du
,
W.
,
Shao
,
Q.
,
Zhang
,
B.
,
Yin
,
Z. Y.
,
Xiang
,
R. H.
,
Liu
,
Y. S.
,
Li
,
Y.
(
2024
).
Comparative study on performance of gearbox cleaning agent
.
Advanced Materials of High-Speed Railway
,
3
(
2
),
53
56
.
Guo
,
J.
,
He
,
B.
, &
Bai
,
X. H.
(
2016
).
Effect of chloride contaminated sand on the electrochemical corrosion behavior of X70 steel in early stage
.
Science Technology and Engineering
,
16
(
32
),
325
331
.
Haque
,
J.
,
Zulkifli
,
M. F. R.
,
Ismail
,
N.
,
Quraishi
,
M. A.
,
Ghazali
,
M. S. M.
,
Berdimurodov
,
E.
, &
Nik
,
W. M. N. B. W.
(
2023
).
Environmentally benign water-soluble sodium L-2-(1-Imidazolyl) alkanoic acids as new corrosion inhibitors for mild steel in artificial seawater
.
ACS Omega
,
8
(
28
),
24797
24812
. doi: .
Huang
,
L.
,
Liu
,
Z. Y.
,
Du
,
C. W.
,
Liu
,
R. K.
,
Wang
,
B.
,
Li
,
Y. Q.
, &
Li
,
X. G.
(
2015
).
Stress corrosion cracking failure of Q235B steel used for sulfur-containing waste water tank
.
Surface Technology
,
44
(
03
),
52
56
.
Ji
,
F. D.
,
Ji
,
D. D.
, &
Fan
,
X.
(
2023
).
Preparation and performance study of an environmentally friendly metal cleaner
.
Speciality Petrochemicals
,
40
(
6
),
51
55
.
Liu
,
H. P.
(
2020
).
Overview of water-based metal cleaner technology
.
Tianjin Chemical Industry
,
34
(
6
),
1
4
.
Luo
,
T.
,
Chen
,
Y.
,
Zhou
,
X.
,
Wang
,
Z. L.
,
Chen
,
M. J.
,
Hu
,
J.
, &
Yu
,
H. L.
(
2021a
).
Synthesis and performance study of Q235 carbon steel corrosion inhibitor lauric acid diethanolamine
.
Neijiang Technology
,
42
(
11
),
20
21
.
Luo
,
W. J.
,
Xu
,
Y. Q.
,
Le
,
X. G.
,
Zhang
,
L. R.
,
Song
,
J. W.
, &
Deng
,
J. H.
(
2021b
).
Study on corrosion rate of acid cleaning agent to stainless steel
.
China Cleaning Industry
,
5
,
59
63
.
Pan
,
M. Z.
,
Cai
,
J.
, &
Yu
,
M.
(
2010
).
Corrosion inhibition of gum leaves extracts in acidic medium for A3 steel
.
Chemical Engineer
,
24
(
2
),
70
72
.
Rouifi
,
Z.
,
Benhiba
,
F.
,
Faydy
,
M.
,
Laabaissi
,
T.
,
Oudda
,
H.
,
Lakhrissi
,
B.
,
Zarrouk
,
A.
(
2021
).
8-Hydroxyquinoline grafted triazole derivatives as corrosion inhibitors for carbon steel in H2SO4 solution: Electrochemical and theoretical studies
.
Ionics
,
27
(
5
),
2267
2288
. doi: .
Wang
,
S.
,
Liang
,
Z.
,
Hong
,
Q.
,
Wang
,
B.
,
Cao
,
Y.
,
Ren
,
G.
,
Chen
,
D.
(
2024
).
Green route to prepare robust and multifunctional superhydrophobic coatings
.
Ceramics International
,
50
(
3
),
Part B
,
5857
5867
. doi: .
Wang
,
P. S.
,
Xin
,
T.
,
Chen
,
P.
,
Wang
,
S.
, &
Cheng
,
Di.
(
2025
).
Buoyancy characteristic analysis and optimization of precast concrete slab track during casting process of self-compacting concrete
.
Railway Sciences
,
4
(
2
),
159
173
. doi: .
Zhang
,
S. L.
,
Li
,
M. J.
,
Wang
,
X. B.
, &
Chen
,
S. B.
(
2007
).
Intergranular corrosion of 18-8 austenitic stainless steel
.
Journal of Chinese Society for Corrosion and Protection
,
2
,
124
128
.
Zhang
,
L. L.
,
Jiao
,
Q. Z.
,
Wang
,
J.
,
Yang
,
T.
,
Jiang
,
X. Y.
,
Lin
,
L. J.
,
Zhao
,
Y.
(
2016
).
Development of corrosion inhibitor JLL-1 at high temperature using solid cleaning agent
.
Cleaning World
,
32
(
3
),
29
34
.
Zhang
,
Y. L.
,
Han
,
L.
, &
Song
,
X. L.
(
2018
).
Stress corrosion cracking behavior of austenitic stainless steel in sulfur containing waste water
.
Corrosion Science and Protection Technology
,
30
(
5
),
513
517
.
Zheng
,
F. D.
,
Yi
,
S. Z.
,
Zhao
,
H. H.
,
Zhang
,
L. H.
, &
Li
,
J. H.
(
2017
).
Development of a weak acidic rust remover
.
Electroplating & Pollution Control
,
37
(
5
),
41
43
.

Languages

or Create an Account

Close Modal
Close Modal