


In this paper, the C80 special coal gondola car was taken as the subject, and the load test data of the car body at the center plate, side bearing and coupler measured on the dedicated line were broken down to generate the random load component spectrums of the car body under five working conditions, namely expansion, bouncing, rolling, torsion and pitching according to the typical motion attitude of the car body.
On the basis of processing the measured load data, the random load component spectrums were equivalently converted into sinusoidal load component spectrums for bench test based on the principle of pseudo-damage equivalence of load. Relying on the fatigue and vibration test bench of the whole railway wagon, by taking each sinusoidal load component spectrum as the simulation target, the time waveform replication (TWR) iteration technology was adopted to create the drive signal of each loading actuator required for the fatigue test of car body on the bench, and the drive signal was corrected based on the equivalence principle of measured stress fatigue damage to obtain the fatigue test loads of car body under various typical working conditions.
The fatigue test results on the test bench were substantially close to the measured test results on the line. According to the results, the relative error between the fatigue damage of the car body on the test bench and the measured damage on the line was within the range of −16.03%–27.14%.
The bench test results basically reproduced the fatigue damage of the key parts of the car body on the line.
1. Introduction
The load spectrum of railway wagon on the actual operating line is the core basis for the design, the simulation and the test of wagon product. In terms of the research on the load spectrum of railway wagon, in the locomotive standard of the Association of American Railroads (AAR), the Fatigue Design of New Wagons, there were several environmental load spectrums of specific wagon types obtained based on the actual measurement on the line and the spectrums of components acting on the car body structure were listed. In recent years, a wide range of systematic load spectrum test and research tasks was conducted in China, a lot of load data measured on the line was collected and sorted, and the railway wagon bodies and components were subject to the fatigue life analysis in the computer environment, which has become an important basis for structural fatigue design (Sun, Sun, LI, & Wang, 2021; Wang, Wang, Sun, & Liang, 2015; Xue, Li, Hu, & Liu, 2017). However, for full-size railway wagon bodies, the load spectrum for line test in China is only used for car body fatigue simulation calculation in the current stage, and there is still blank in the research field of fatigue test of car body. Internationally, North American Railway Transportation Technology Center Inc. (TTCI) used a simulation test device to conduct the fatigue test loading under the working conditions such as expansion, bouncing and torsion of the railway wagon body, which better reproduces the damage of the car body during operation on the line (Koch, 2015).
The completion and operation of the first fatigue and vibration test bench for railway wagons in China provide hardware support for the fatigue test research of railway wagon bodies. The vibration acceleration and dynamic stress signals of railway wagon bodies were used as the simulation targets to make the fatigue test research of car body, providing high test simulation accuracy (Li, Fang, Li, Zhang, & Zhao, 2021; Yu, Li, Li, & Zhang, 2017; Zhang, Li, Yu, Li, & Yan, 2017). However, on the one hand, the test is strongly related to the specific structure of car body, and the universality of driving and loading signals of the fatigue test is limited; on the other hand, the test is inconsistent with the fatigue simulation calculation of the car body using the load spectrum, and the verification of the correlation between the simulation and the test is limited.
In this paper, the C80 special coal gondola car was used as the research object, loads of the center plate, the side bearing and the coupler of the wagon were measured on the line based on the analysis of the typical motion attitude and stress state of the car body; and the fatigue loading method based on the typical working conditions of the car body was proposed on the basis of the fatigue and vibration test bench and the data measured on the line of railway wagon, so as to reproduce the fatigue damage of the car body during its operation on the line.
2. Load breakdown of car body under typical working conditions
During operation, railway wagons are inevitably affected by the operating conditions such as dead weight, loading, starting, releasing, braking, going uphill or downhill, crossing curves and crossing turnouts, and external environments such as uncertain wind force. These complex disturbances will cause the bouncing, expansion, rolling, torsion and pitching of car body.
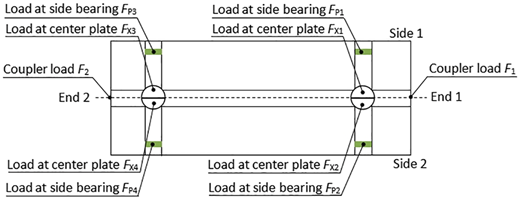
External disturbances act on the car body in the form of loads, and they often have random variation characteristics. The loads on the car body are generally a combination of various loads. According to the motion attitude of the car body, the main loads that have decisive significance on the strength, rigidity and stability of the car body are divided into loads under typical working conditions such as expansion, bouncing, rolling, torsion and pitching (Wang, Sun, Li, & Wang, 2016; Zhao, 2015). The load under each typical working condition can be calculated from the loads at four side bearings of the car body and the loads at four center plates symmetrically distributed along the longitudinal center of the car body.
The load under the bouncing condition of the car body is the vertical load on the car body, which can be obtained by adding the vertical loads at the center plate and side bearing at Position 1, and the vertical loads at the center plate and side bearing at Position 2.
In view of the effect of loads at the side bearing and the center plates, the load under the rolling condition of car body can be obtained by adding the loads at the two side bearings and center plates on one side of the car body and then subtracting the sum of the loads at the two side bearings and center plates on the other side of the car body.
The load under the torsion condition of the car body can be obtained by adding the loads at the two side bearings and center plates on the diagonal of the car body, and then subtracting the sum of the loads at the two side bearings and center plates on the other diagonal of the car body.
Similarly, the load under the pitching condition of the car body can be obtained by adding the loads at the two side bearings and center plates at one end of the car body and then subtracting the sum of the loads at the two side bearings and center plates at the other end of the car body.
The load under the expansion condition of the car body can be directly obtained from the measured load of the force-measuring coupler of the car body.
To realize load reproduction on the test bench, the loads of the 1/4 car body structure under the working conditions such as bouncing, rolling, torsion and pitching of the car body shall be given, and they are respectively as follows:
where , , and are respectively the random loads under working conditions such as bouncing, rolling, torsion and pitching after breakdown; is the number corresponding to any of the four directions of the car body, namely Side 1 of End 1, Side 2 of End 1, Side 1 of End 2 and Side 2 of End 2 (Ministry of Railways of the People's Republic of China, 2004), ; is the measured load at the side bearing of the car body in any of the four directions; is the measured load at the center plate of the car body in any of the four directions.
3. Processing of measured load data of the car body on the line
3.1 Line test
The test section of the C80 special coal gondola car was from Shenmubei to Huanghua Port; the 116-car formation was adopted, and cars 33, 57 and 111 were used for test; totally 16 round-trip tests were carried out. The test train was marshalled at the Zhugaita Marshalling Yard according to the test requirements. After being loaded at the loading point of Daliuta, the train passed through Shenmubei Railway Station, Shenchinan Railway Station and Suning Railway Station along the Shenmu–Shuozhou Railway and the Shuozhou–Huanghua Railway, and then arrived at Huanghua Port Railway Station; and after that, it entered the dumper for unloading, and then, returned to the Zhugaita Marshalling Yard along the original route. The round-trip mileage of the gondola car for test was about 1,620 km, and each round trip was subject to the full-process test. The test data include load data both during the line operation and the operation process of dumper. The sampling frequency was set to 512 Hz during the test. According to the processing and analysis of test data, the test data of the 11th harsh test (car 57) was selected as the basic data for this research (Li & Zhang, 2015).
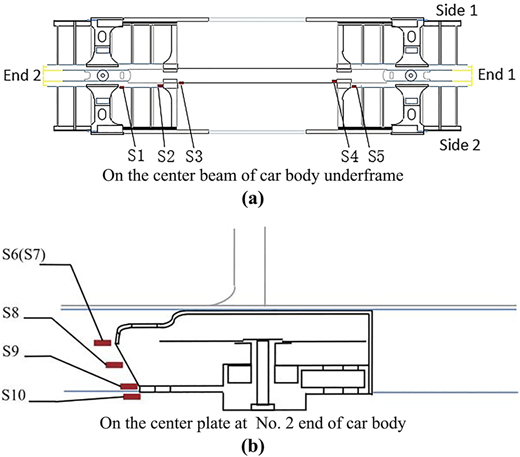
The test data involved two aspects, namely load and dynamic stress. Strain measuring points for fatigue assessment were arranged according to the parts with large stress in the static strength simulation analysis and test results of the car body, and the parts with large fatigue damage in the fatigue simulation analysis results of the car body and with reference to the fault parts of the same or similar car body structures (Li, Zhang, Cao, & Li, 2014). The strain of the measured dynamic strain measuring points was within the range of linear elastic change of the material. Therefore, the strain of each measuring point and the elastic modulus of the material were multiplied to obtain the stress. A load sensor was arranged at the side bearing/center plate to test the load at the side bearing and center plates; and a force-measuring coupler was arranged at End 2 of the car to test the longitudinal expansion load. The layout of strain measuring points of the car body is shown in Figure 1, and that of load sensor measuring points of the car body is shown in Figure 2. In the figure, S1–S10 are measuring points.
3.2 Data processing
Data preprocessing was performed first. In the measured dynamic response data of the line, the influence of static load was omitted for the dynamic stress and expansion load, and the loads at the center plate and side bearing. Therefore, the synchronous shear method was adopted to synchronously delete the parking period data that does not cause fatigue damage and abnormal data caused by external interference according to the time period. The method keeps the phase relationship between the dynamic stress and load data of all tests unchanged. The piecewise linear zero drift assumption was adopted to process the zero drift of the data signal and the burred data signal (Zhao, Wang, LI, & Wang, 2015). The power spectral density curve was obtained by PSD spectral density analysis, as shown in Figure 3.

It can be seen from Figure 3 that the spectrums of dynamic stress and load signals are mainly distributed below 10 Hz; therefore, all signals shall be subject to 10 Hz low-pass filtering based on results of the power spectral density analysis.
Secondly, after the pretreatment was completed, the time-domain data signal without fatigue damage was deleted to achieve the purpose of accelerating fatigue test. At present, in most cases, it is a common practice to delete small loads below 50% of the material fatigue limit or to delete small loads below 10% of the maximum load; and it is believed that by doing so, the fatigue damage of the sample will not be changed (Yu, Zheng, Zhao, & Zhao, 2015). According to the principle of damage equivalence and the Eurocode 3 (European Committee for Standardization, 2005), the S–N curve corresponding to the stress at each measuring point of the car body was selected to determine the fatigue cut-off limit, and then the synchronous shear method was used to delete the time periods of stress with stress ranges less than the fatigue cut-off limit in all measured stress time domain processes. This is to ensure that the phase relationship between the stress signals of each channel remained unchanged after deletion. That is to say, the periods of time when the small-amplitude stress waveforms without damage occurred at the same time were deleted, and time periods of stress with fatigue damage were retained. All measured load time domain processes were deleted synchronously according to the time period of stress deletion.
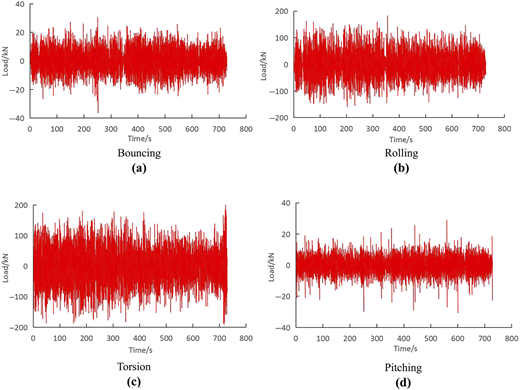
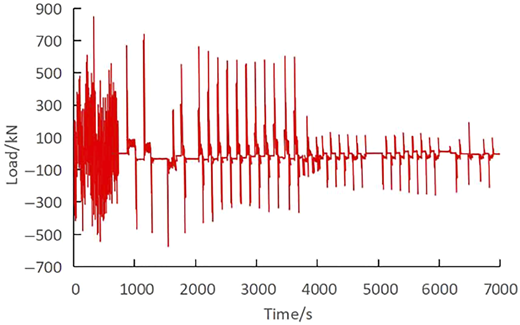
Finally, the load component spectrums of the 1/4 car body structure under working conditions such as bouncing, rolling, torsion and pitching could be obtained by breaking down the processed measured load with Equations (1)–(4), as shown in Figure 4. The load under the expansion condition of the car body did not need to be broken down, and could be directly obtained from the measured data of the force-measuring coupler, as shown in Figure 5. Therefore, based on the measured load data, the random load component spectrums of the car body under five working conditions were obtained.
4. Equivalent conversion of load
The total duration of the load component spectrums under five different working conditions was five times the signal duration of the original measured load. When the random load component spectrums under various working conditions were reproduced on the test bench, the test period would increase and the test cost would also increase significantly. Therefore, the pseudo-damage equivalence method was adopted to convert the random load component spectrum of each working condition into the sinusoidal load component spectrum for test to serve as the target signal for load simulation on the test bench. The core principles are as follows.
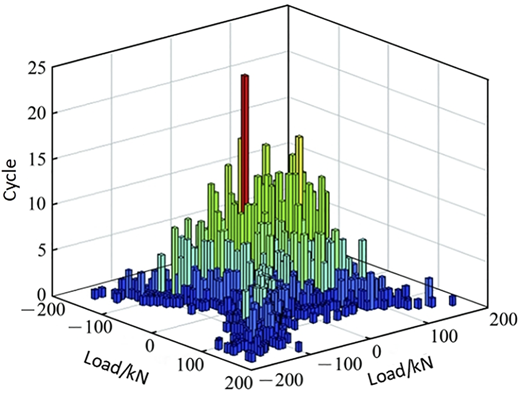
The rain-flow counting is carried out for the random load component spectrum of each working condition after breakdown to obtain the amplitude and frequency of the load. The load spectrum of the railway wagon body is usually at Level 8 or Level 16. In order to make the damage calculation more accurate, the level of each component spectrum is set to 64. The rain-flow counting of the torsional load is shown in Figure 6.
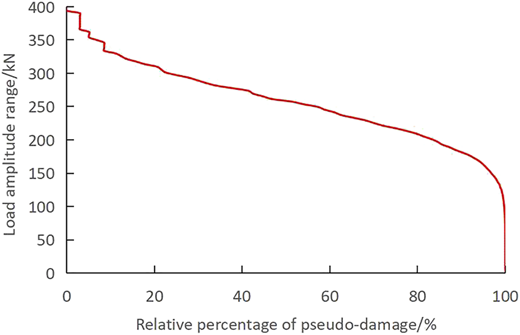
The pseudo-damage of each random load component spectrum is calculated according to the results of rain-flow counting, and then the rain-flow data obtained are arranged according to the amplitude in a descending pattern and divided into several levels. Each level contains amplitude data arranged in a descending pattern, and the relative percentage of pseudo-damage at each level is calculated at the same time. The results are shown in Figure 7.
The pseudo-damage of load at each level is calculated according to the total pseudo-damage of random load component spectrums and the relative percentage of pseudo-damage of load spectrum at each level. For any level , including the load amplitudes – arranged in a descending order, the load pseudo-damage of this level is calculated, the maximum load amplitude is selected as the load amplitude after the equivalent conversion, and then the equivalent conversion of load is carried out according to the pseudo-damage consistency principle (British Standard Institution, 2015), so as to obtain the frequency of this level after the equivalent conversion according to the maximum load amplitude . See Table 1 for the equivalent conversion principle of load.
According to the principle of damage equivalence, the sinusoidal signal is constructed according to the amplitude and frequency of the load after conversion, and its frequency shall be such that no resonance with the car body occurs. At the same time, factors such as test loading capacity, cycle and cost shall also be considered in the setting of frequency.
Equivalent conversion principle of load
| Level | Random load | Load after equivalent conversion | |||
|---|---|---|---|---|---|
| Amplitude/N | Pseudo-damage | Amplitude/N | Pseudo-damage | Frequency | |
| q | A1 | Dq | A1 | Dq | Nq |
| A2 | |||||
| Ax | |||||
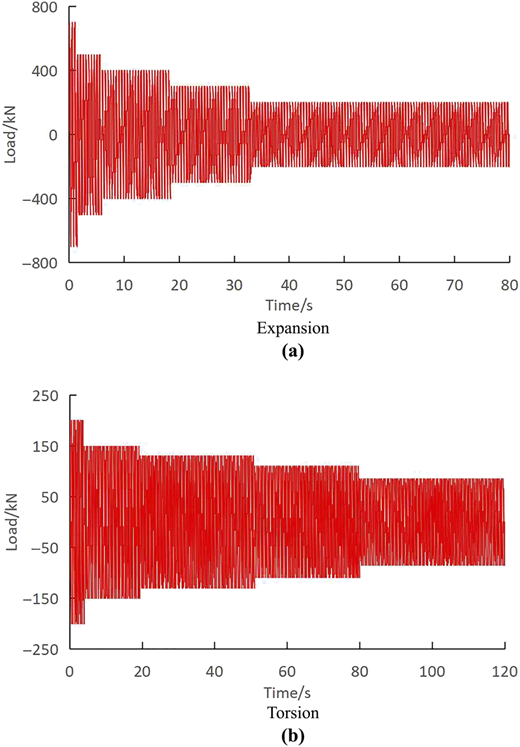
According to the above method, the equivalent conversion of each random load component spectrum can be completed, and the sinusoidal load component spectrum of each working condition after the equivalent conversion can constitute the target signal for the fatigue test of car body on the bench. The sinusoidal load component spectrums of expansion and torsion conditions with amplitude level of 5 and frequency of 2 Hz after conversion are shown in Figure 8. It should be pointed out that during the bench test, in addition to the load of the car body under the expansion condition, other four loads with component spectrums as sinusoidal signals shall be given respectively. For example, for the rolling condition, the load phases of the two 1/4 car body structures on the same side are identical, but the difference between them and the two load phases on the other side of the car body is 180°. The sinusoidal signals for rolling of the four loads after the equivalent conversion are the simulation targets on the bench. Similarly, the phase relationship of other sinusoidal load component spectrums should also be considered.
Creation of drive signal for fatigue test of car body on the bench
4.1 Methods for load test on bench
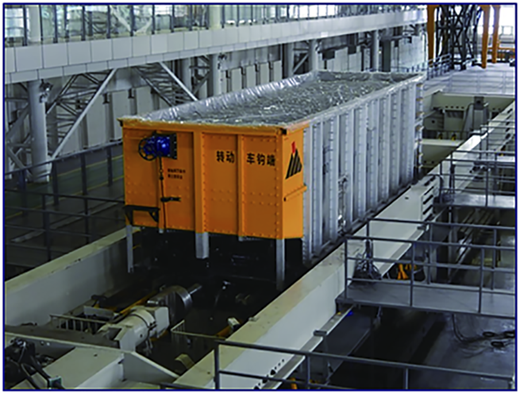
The car body on the bench was of the same type as that of the vehicle for line test, and strain gauges were rearranged for the car body on the bench according to the positions of the strain measuring points of the vehicle for line test. To realize the indoor load simulation of the car body on the bench, load sensors for center plates and side bearings were installed between the simulated bolster and the car body on the test bench to test the vertical load of each part of the car body, and the longitudinal load of the car body was directly measured by the longitudinal loading actuator. The fatigue loading test of the car body on the test bench is shown in Figure 9.
The data in each sinusoidal load component spectrum after the equivalent conversion were the coupled data of the loads at the center plate and side bearing of the 1/4 car body structure, and the sensor load data of the center plate and side bearing collected by the test bench control system were independent; therefore, such data could not be effectively correlated. Hence, it is necessary to couple the load data of the center plate and side bearing and test such data in real time. A virtual acquisition channel must be established first by the test bench control system and associated with the load acquisition channel for the center plate and side bearing involved in the coupling calculation.
Equation (5) gives the correlation parameters and the calculation formula of coupling test. The coupling data of the loads at the center plate and side bearing of each 1/4 car body structure can be obtained through the virtual acquisition channel test.
where is the coupled data of the loads at the center plate and side bearing of the 1/4 car body structure obtained through the virtual acquisition channel test on the test bench; , and are respectively the sensitivity coefficient, the output voltage and the range of the center plate load sensor at the 1/4 car body structure; , and are respectively the sensitivity coefficient, the output voltage and the range of the side bearing load cell at the 1/4 car body structure.
4.2 Compilation of drive signal for fatigue test of car body on test bench
For working conditions such as bouncing, rolling, torsion and pitching, four vertical actuators of the test bench were used for loading, and the displacement control was adopted. For the load under the expansion condition, the longitudinal actuator of the test bench was used for loading, and the load control was adopted (Yu, Zhao, Li, & Li, 2019). The schematic diagram of test bench loading is shown in Figure 10.

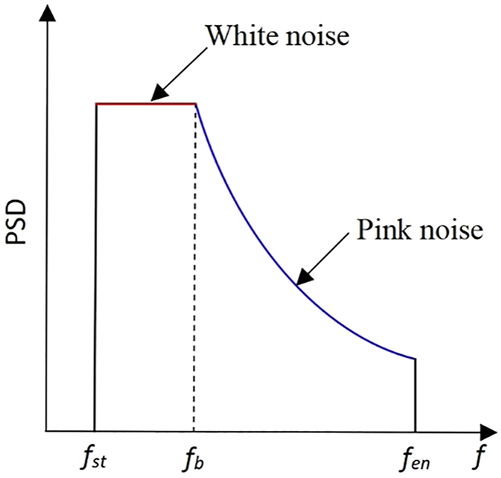
Based on the measured coupler force data, the longitudinal actuator drive signal of the test bench was directly loaded according to the sinusoidal load subject to the equivalent conversion. The vertical actuator drive signal of the test bench was iteratively generated as the target by the time waveform replication (TWR) technology with the sinusoidal load component spectrums under various working conditions after the equivalent conversion. For example, for the sinusoidal load simulation under the torsion condition of the car body, the white and pink noise signal was generated according to the frequency domain expression in Equation (6).
where is the frequency domain of the white and pink noise signal; is the starting frequency of white noise; is the cut-off frequency of white noise; is the cut-off frequency of pink noise; is the energy attenuation index.
During the test bench test, the standard deviation of the white and pink noise input signal is usually set to 0.4–1.0 mm, the starting frequency of white noise is set to 0.4 Hz, the cut-off frequency of white noise is set to 1.5 Hz, the cut-off frequency of pink noise is set to 10 Hz and the energy attenuation index is usually set to 0.5–1.0. The power spectral density curve of the white and pink noise signal is shown in Figure 11.
The white and pink noise signals were used as the input signal of the vertical loading actuator of the test bench to excite the test bench system. Since the test system was characterized by multiple input and multiple output (MIMO), the frequency response function matrix of the system was calculated according to Equation (7) by using the relationship between the input white and pink noise signal and the torsional load response signal of the car body on the test bench.
where is the cross-power spectral density function matrix of input and response; is the auto-power spectral density function matrix of input (Li et al., 2021).
Based on the inverse matrix of the frequency response function obtained by the system identification and the target signal of the sinusoidal load component spectrum under the torsion condition, the initial drive signal was obtained according to Equations (8) and (9).
where is the Fourier transform of the initial drive signal; is the Fourier transform of the target signal; is the inverse Fourier transform; is the initial attenuation coefficient, with the value range of .
The initial drive signal was used to excite and load the test bench, and the response signals of the four measuring points of torsional load coupling were collected. At the same time, the frequency domain results of the response signals were calculated, and then the time domain error and frequency domain error between the response signal and the target signal were calculated according to Equations (10) and (11).
And then, the obtained errors were used to calculate the drive signal after one iteration according to Equation (12).
where is the attenuation coefficient, with the value range of .
The simulation iteration was repeated according to the above process to continuously correct the drive signal input by the test bench. When the error between the response signal and the target signal of the torsional load of the car body on the test bench was within the allowable range, the iteration ended. The drive displacement of the vertical actuator used last time was the drive signal under the torsion condition on the test bench. After iteration, the comparison between the response signal and the target signal of the test load under the torsion condition of the car body is shown in Figure 12. Similarly, based on this method, the drive signals of rolling, bouncing and pitching conditions could be obtained.
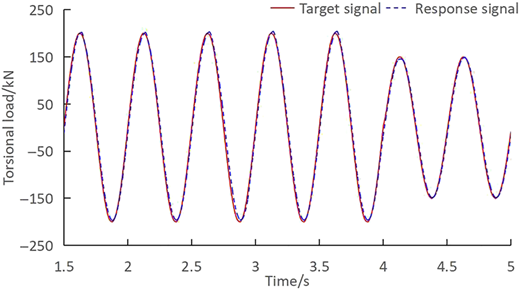
Comparison between response signal and target signal of test load under torsion condition
Comparison between response signal and target signal of test load under torsion condition
The stress response data of the car body and the corresponding relationship between the load and stress of the component spectrum were obtained by exciting the test bench with the drive signal in each load component spectrum. The total damage of each stress could be obtained by superposing the damage under the action of each component spectrum.
where is the total damage of the component spectrum of the th stress measuring point of the car body on the test bench; and are respectively the range of corresponding stress change and the frequency at the th level of the th stress measuring point under the action of the th component spectrum; and are respectively the constant amplitude fatigue strength and the fatigue limit of the S–N curve corresponding to the th stress measuring point.
4.3 Correction of drive signal for fatigue test of car body on test bench
However, due to the dynamic transmission relationship between the load borne by the car body and the stress at the key fatigue parts in the actual application process, when the measured random load is equivalently converted into a sinusoidal load component spectrum at a fixed frequency, the relationship between the dynamic effect of random load action and the stress fatigue damage was ignored. The stress fatigue damage of the car body obtained by direct loading with the equivalent sinusoidal load component spectrum as the simulation target is generally smaller than the measured stress fatigue damage (Zhao, 2015). Therefore, it is necessary to correct each equivalent sinusoidal load component spectrum according to the damage consistency principle and obtain the corrected load according to the corresponding relationship between load and strain, so as to correct the test bench drive signal corresponding to each component spectrum to ensure that the damage error of ten stress assessment points of the car body on the test bench is controlled within the minimum range as far as possible.
where is the minimum error between the total damage caused by the stress measuring points of the car body during the actual line test and the total damage caused by the stress measuring points of the car body on the test bench after each component spectrum is corrected; is the total damage caused by the th stress measuring point of the car body during the actual line test; is the correction coefficient.
The correction coefficient of each component spectrum could be determined by multi-objective optimization solution of Equation (14). Therefore, the correction coefficients of the load drive signals of the vertical and longitudinal actuators on the test bench under the load conditions such as rolling, bouncing, torsion, pitching and expansion could be obtained. The load drive signals in individual component spectrums were adjusted according to the correction coefficients, and then the test bench was loaded so that the damage per kilometer of the stress assessment point of the car body on the test bench was close to the damage measured on the line. The results are shown in Table 2. At this time, the drive signal formed by each actuator was the drive signal for the fatigue test of car body.
Comparison of damage results at stress and fatigue assessment points of car body
| Measuring point no. | Damage per kilometer of measured signal of the line /10−7 | Damage per kilometer of response signal on the test bench /10−7 | Error /% |
|---|---|---|---|
| S1 | 1.02 | 1.27 | 24.93 |
| S2 | 5.22 | 5.22 | 0.07 |
| S3 | 1.23 | 1.47 | 19.37 |
| S4 | 1.21 | 1.33 | 9.87 |
| S5 | 4.15 | 5.28 | 27.14 |
| S6 | 0.47 | 0.55 | 17.34 |
| S7 | 0.51 | 0.48 | −7.02 |
| S8 | 0.98 | 1.20 | 17.69 |
| S9 | 2.79 | 2.70 | −3.24 |
| S10 | 2.94 | 2.47 | −16.03 |
The test results show that based on the measured load data of the center plate, the side bearing and the coupler of the car body, the load signal was decomposed and equivalently converted, and the drive signal of the fatigue test load of the car body on the test bench was compiled, so that the relative error between the damage per kilometer of the stress assessment point of the car body and the measured damage on the line was between −16.03%–27.14%.
There are several reasons for the error between the damage of the stress assessment point of the car body on the bench and the measured damage on the line. First of all, the car body used in the bench test and that used in the line test are of the same type, but not the same item. Therefore, related factors such as the welding process and state, structural parameters, dispersion of material properties of the car body will cause the strain value test error. Secondly, strain gauges are rearranged for the car body on the bench according to the positions of strain measuring points of the line test vehicle, but the sticking of strain gauges will bring a certain strain test error due to the influence of human factors. In addition, the fatigue damage is calculated based on the S–N curve data, which is the third or the fifth power of the strain value. A small error between the strain measurement values will also lead to a relatively large fatigue damage error. Moreover, the pseudo-damage equivalence method is used to equivalently convert each random load component spectrum into the sinusoidal load component spectrum for test. The load change is also the cause of fatigue damage error.
According to the research results of the fatigue test of car body carried out by using the simulation test device by North American Railway TTCI, if the relative error between the stress fatigue damage of the car body on the bench and the measured damage on the line is within 50%, the results of the indoor bench test are acceptable and can better reproduce the damage of the car body during operation on the line (Koch, 2015). Therefore, using the test loading method in this paper to create the drive signal for the fatigue test load of the car body can make the bench test results closer to the measured results on the line, which basically reproduce the fatigue damage of the key parts of the car body.
For the stress analysis based on the measured load data and the typical working conditions of the car body, on the one hand, the similarity between the working conditions of the bench test and the actual operation on the line is ensured, and the comparison validation under the condition, of which the simulation and test methods are consistent with each other, can be realized. On the other hand, when the vehicle does not have the measured data on the line, the drive signal of the fatigue test load of car body created by this method can be applied to another vehicle type with the similar axle load, carrying capacity and train formation number and equivalent line grade, which lays a solid foundation for future promotion and conversion of the load spectrums of other railway wagon types for the fatigue test of car body.
5. Conclusions
Based on the measured load test data of the C80 gondola car on line, the measured random loads at the center plate and side bearing were broken down by using the breakdown technology of measured load data, and five random load component spectrums were obtained. Based on the principle of pseudo-damage equivalence, the random load component spectrums broken down were equivalently converted into sinusoidal load component spectrums, which provide target signals for load simulation on the test bench.
On the test bench, the drive signal for the fatigue test of car body was created through the TWR iteration technology, and each sinusoidal load component spectrum was simulated. The drive signal was corrected according to the consistency principle of measured stress fatigue damage, so that the relative error between the damage per kilometer of the stress assessment point of the car body and the measured damage on the line was between −16.03%–27.14%, and the simulation accuracy could meet the requirements of the fatigue test of car body.
The process of creating the fatigue test drive signal based on the measured load data is convenient and fast, and the time of time domain sequences composed of component spectrums after the equivalent load conversion is short, which can greatly save test costs and improve the test efficiency.
The corrected component spectrum based on the measured load breakdown and equivalence can be used for the fatigue simulation analysis of the car body, and the comparison validation under the condition that the simulation and test methods are consistent with each other can be realized. In addition, the created test bench drive signal has laid a solid foundation for the promotion and conversion of fatigue tests of bodies of other railway wagons.
The research was supported by the Science and Technology Research and Development Foundation of the Ministry of Science and Technology (Grant No. 2020YFB1200200ZL), the Scientific Research Program of the Department of Education of Liaoning Province (Grant No. 2021LJKZ1298), and the Science and Technology Research and Development Foundation of CRRC (Grant No. 2021CHA014).

