


Weathering steel has excellent resistance to atmospheric corrosion, but still faces complex environmental corrosion problems during long-term operation. This paper mainly studies the corrosion problem of weather resistant steel materials for railway freight car bodies with a load capacity of 70 tons.
The paper analyzes the corrosion characteristics of weather resistant steel materials for truck bodies through macroscopic and microscopic methods including metallographic microscopy, scanning electron microscopy, energy dispersive spectroscopy and X-ray diffraction. Electrochemical analysis shows that the rust layer on the surface of weathering steel changes the surface state of the material, and also proves that weathering steel used in trucks undergoes electrochemical corrosion under atmospheric corrosion. At the same time, ion chromatography technology is used to study the corrosive ions mainly present in the residual liquid and foam solution inside the vehicle body.
The corrosion of truck body materials is mainly electrochemical corrosion, and the corrosion of door materials is more obvious than that of other parts. The corrosion products are mainly Fe oxides and hydroxides. There are high concentrations of Cl – and SO42– ions in the residual liquid and foam solution at the bottom of the freight car, which are the main factors causing corrosion of the railway freight car body.
The foam adhesive around the door panel is in a moist state for a long time, and corrosive ions will accelerate the electrochemical corrosion of the weather resistant steel material of the door panel. Therefore, the corrosion of the cargo door panel is more severe than other components.
1. Introduction
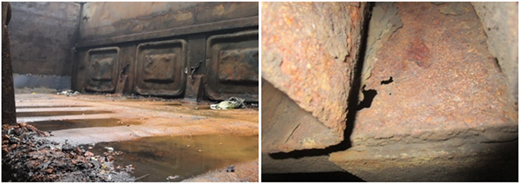
Railway freight is the main mode of transportation, and its safety and reliability of operation are particularly important. Due to the large difference in climatic conditions, especially in the southern region affected by the Marine climate (high temperature, high salt, high humidity) (Cheng, Han, Li, & Qu, 2022; Dillmann, Mazaudier, & Hœrlé, 2004; Dong, Dong, Han, Liu, & Ke, 2009; Wang et al., 2024; Guo, Zhu, & Kang, Duan, & Wang, 2019; Li, Dong, Xiao, & Gao, 2014; Suzuki, Masuko, & Hisamatsu, 1979; Zhang et al., 2003; Zhu, Guo, Kang, & Hou, 2019), coupled with the harsh working conditions of freights, the steel structure of the car body not only bears the impact of friction and corrosion of goods in the full temperature environment, but also bears the impact of bumping and unloading machinery. Therefore, the protective coating inside the car body will be damaged in a short time. Resulting in rapid internal corrosion of the freight body, as shown in Figure 1.
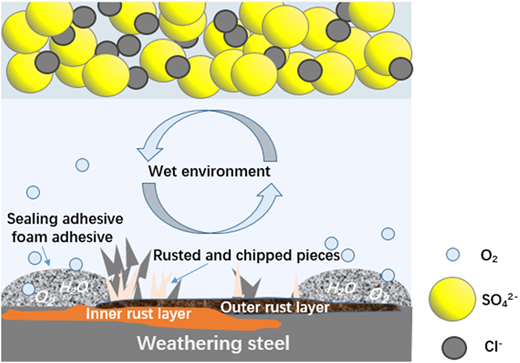
Steel for railway freight is a special type designed specifically for the manufacture of railway freight, characterized by high strength, wear resistance and corrosion resistance. This type of steel can withstand the enormous pressure and impact generated by railway freight cars during operation, ensuring the stability and safety of the car structure. The steel used in railway freights has mainly experienced several stages, including carbon steel, low alloy steel, weathering steel and high strength weathering steel. Since the obsolescence of China’s first 70t-class freight in 2005, the whole body of which was made of high-strength weathering steel such as Q450NQR1, the current 70t-class freight has been running for nearly 20 years. Faced with the problems of decreased strength, poor corrosion resistance and short service life, it is difficult to meet the performance requirements of weathering steel in complex and harsh atmospheric environments. By analyzing the causes of corrosion in the main load-bearing components, this paper aims to understand the main factors that affect the lifespan of vehicle body materials. Through the corrosion causes analysis of main type bearing parts, the main factors affecting the life of the car body material were understood. The analysis found that the corrosion of the freight body was closely related to the transportation medium and operating conditions. The corrosion of freights carrying coal and other minerals was generally more serious (Gu, Wang, & Ji, 2004; Ke & Dong, 2011; Misawa, Asami, Hashimoto, & Shimodaira, 1974; Chang, Guo, He, & Liu, 2023; Wang, Huang, Zhou, Chen, & Liu, 2015; Zhang, Chen, & Chen, Li, & Pan, 2001a), especially the obvious rust layer and rust layer peeling phenomenon in the lower part of the car body. Materials for seriously corroded parts of the car body and residual liquid deposited at the car bottom had been collected on-site. It was found after analysis that there were relatively high concentrations of Cl− and SO42- ions in the residual liquid (Ericsson, 1978; Meybaum & Ayllon, 1980; Morcillo et al., 2015). In humid environment, the high content of corrosive ions would aggravate the electrochemical corrosion of the base material of the car body, as shown in Figure 2.
2. Test
2.1 Test materials
A sample size of 5 × 5 mm was taken from the freight body material, smoothed with a grinding wheel and sanded to 500 # with sandpaper. Regarding the method of GB/T 4336–2016, the chemical composition was tested, and the chemical composition is shown in Table 1.
2.2 Test methods
2.2.1 Metallography
A sample size of 5 × 5 mm was taken from the sample, sanded to 1,500 # with sandpaper, polished with 3.0μm polishing paste, ultrasonically cleaned with ethanol absolute and blew dry. The micro-structure of the sample was observed and analyzed by metallographic microscope (Leica DMI 8).
2.2.2 Surface morphology analysis of corrosion products
The sample size of 5 × 5 mm was taken from the corroded part, and the surface and cross section morphology of the corroded rust layer were observed and analyzed by scanning electron microscopy (TESCAN MIRA4). The composition and distribution of the rust layer and the inclusion elements were analyzed by Xplore 30 ray energy spectrometer equipped with SEM.
The typical corrosion parts of car body samples were selected, and the macroscopic corrosion morphology of them was observed with a handheld portable microscope (Anyth) with 1.3 million pixels and a resolution of 1,280*1,024 (MJPG).
2.2.3 Phase analysis of corrosion products
The corrosion product powder was scraped and ground with a blade from the corrosion part of the sample, and the powder was screened with a 500-mesh screen. The phase analysis of the powder was performed by using the XRD (Bruker D8 Advance X) diffractometer and the copper target radiation source, The operating voltage and current were 40 kv and 200 mA respectively, and the scanning angle was 5–90° with the scanning speed of 2°/min.
2.2.4 Electrochemical analysis
The typical corrosion areas of the car body sample was selected, and samples with rust from different corrosion areas were taken, being immersed into 3.5% NaCl solution respectively. The open circuit potential and electrochemical impedance spectroscopy (EIS) were tested on Gamry 600+instrument. The rusted sample was used as the working electrode, the platinum electrode as the counter electrode and the saturated calomel electrode (SCE) as the reference electrode. The EIS experiment was conducted in the frequency range of 10m Hz to 100 kHz with an amplitude of 5 mV. All measured impedance spectra were represented by Bode plots. The exposed surface area of both the working electrode and the comparison electrode used in the test is 1 cm2.
2.2.5 Analysis of residual liquid and sealing foam adhesive
40 ml of residual liquid in the car was collected, which was filterted and the clarified liquid was prepared for use. After mixing 20 ml of the clarified liquid with 80 ml of water, the pH value, conductivity and ion concentration were measured with a pH meter (METTLER TOLEDO ME204) and ion chromatography (Diane ICS-900, USA).
The foam sample size of 20 × 20 × 20 mm was taken, and the inner pore structure was observed and analyzed by scanning electron microscopy (TESCAN MIRA4). The foam sample size of 50 × 50 × 50 mm was taken, 50 g of which was soaked in water, and was pressed under water with a clean glass rod for 48 h. Then, the supernatant was taken, and its pH value, conductivity and ion concentration were measured (same method as above).
3. Results and discussion
3.1 Car body interception site
Most of the freights have been in service for nearly 20 years, and there is a thick rust layer on the outer surface of the samples. Samples from different parts of the car body were intercepted, and the interception locations are shown in Table 2.
3.2 Macroscopic morphology of materials
The macroscopic morphology of the material for the freight body replacement is shown in Figure 3. It can be seen that the material has suffered severe corrosion after long-term exposure to outdoor environments. Overall, the surface of the freight base is no longer the original metallic luster, but is completely covered by a dark brown rust layer. This rust layer not only indicates that the freight material has undergone a considerable period of oxidation, but its structural strength may also have been weakened to varying degrees.
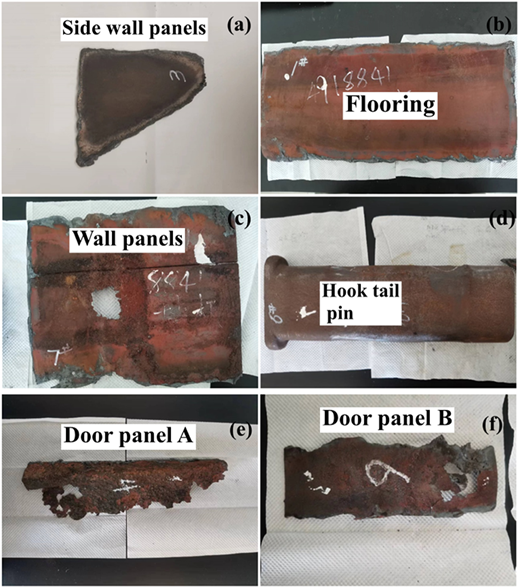
Macroscopic morphology of material samples (1–6). Source(s): Authors’ own work
Macroscopic morphology of material samples (1–6). Source(s): Authors’ own work
The material corrosion near the door panel is more severe compared to other parts of the material, mainly due to the complex and changing environmental conditions that door panels are subjected to in daily use, physical damage caused by switch actions, as well as chemical erosion caused by harsh weather conditions and the accumulation of corrosive substances, which make the door panel and its surrounding area the most susceptible to corrosion in the entire structure.
The frequent opening and closing actions of the door panel not only bring direct mechanical friction and impact, but also gradually weaken the structural strength of the material due to the long-term accumulation of these physical stresses, and may form small cracks or scratches on the surface of the material, providing a convenient channel for the invasion of corrosive media. Meanwhile, the switching process may also be accompanied by the embedding of tiny particles, which can accelerate the electrochemical corrosion process in humid environments. The harsh environment and rainwater erosion carry corrosive substances such as dissolved salts and pollutants, increasing the water vapor content and concentration of corrosive substances in the area near the door panel. In this environment, water vapor and corrosive substances are more likely to accumulate in the gaps and depressions around the door panel, forming a localized high corrosion environment and accelerating the corrosion rate of the material.
3.3 Metallography
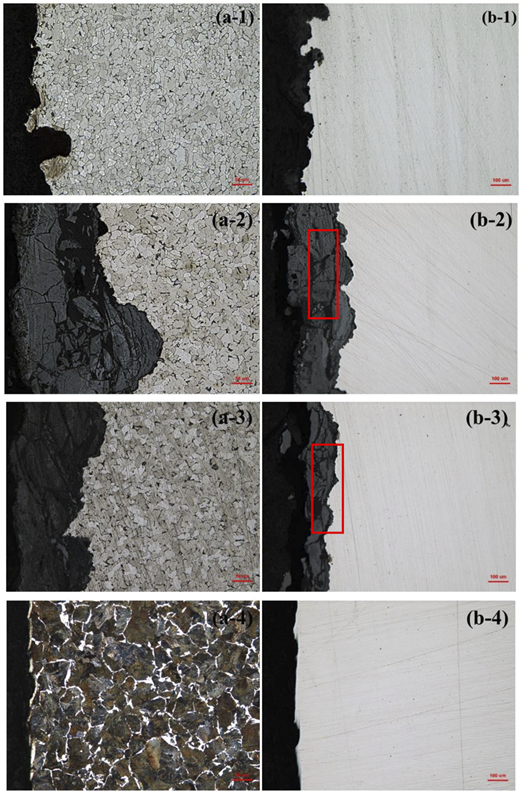
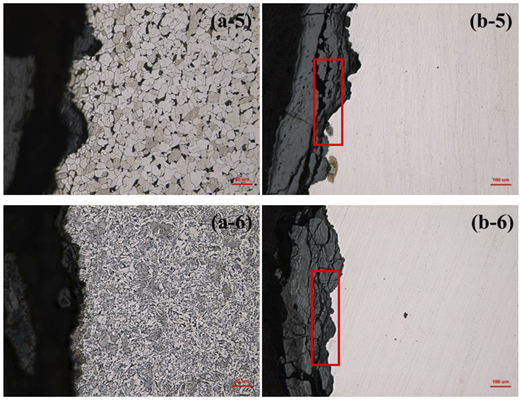
Blocks with a size of 5 × 5 mm were cut, sanded with sand paper and polished. A metallographic microscope (Leica DMI 8) was used to observe the metallographic structure and inclusions. According to the metallographic photos of the freight interception material, the freight material was composed of ferrite and pearlite and no obvious inclusions were found. The rust layer had obvious penetrating cracks, and the rust layer showed a loose porous structure near the matrix, resulting in poor density, which easily reduced the binding force between the rust layer and the matrix and the loss of the rust layer. A large number of rust products were separated from the matrix in the later corrosion stage (Zhang, Ma, & Zheng, 2004), which could not well prevent the corrosive medium from further eroding the matrix, and the corrosive medium could reach the matrix through the crack, as shown in Figure 4.
3.4 Corrosion products
3.4.1 Morphology of corrosion products
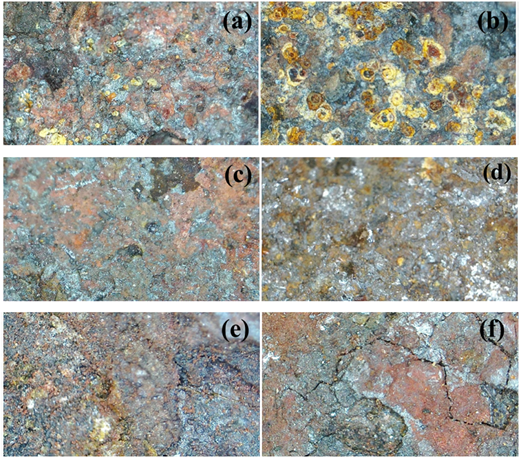
The morphology of corrosion products were photographed with a handheld microscope (1.3 million pixels). It can be seen that the material of the freight body was seriously corroded, and the surface was covered with dark brown and yellow-brown rust layers, as shown in Figure 5.
Morphology of corrosion products of material samples (1–6). Source(s): Authors’ own work
Morphology of corrosion products of material samples (1–6). Source(s): Authors’ own work
3.4.2 Analysis of corrosion products
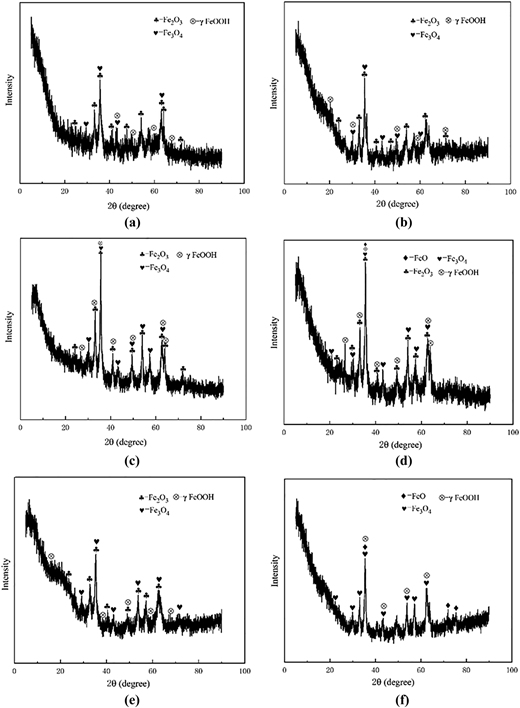
The corrosion product powder was scraped and ground on the sample with a blade, the powder is screened with a 500# screen and the powder is analyzed by XRD diffractometer. The XRD pattern of corrosion products of freight materials is shown in Figure 6.
XRD patterns of corrosion products of material samples (1–6). Source(s): Authors’ own work
XRD patterns of corrosion products of material samples (1–6). Source(s): Authors’ own work
It can be seen from the XRD pattern that the oxides and hydroxides of Fe were the main corrosion products, mainly including Fe3O4, FeO, Fe2O3, γ-FeOOH. The inner rust layer mainly included Fe2O3 and Fe3O4, The outer rust layer mainly includes γ - FeOOH, which serves as a hydroxide oxide of iron and can lose or gain electrons in redox reactions, thereby transforming into different forms of iron oxide, and the other Fe2O3 was formed by the dehydration of γ-FeOOH (Nishimura, Katayama, Noda, & Kodama, 2000; Zhang & Wu, 2006). From the peak shapes corresponding to each phase, it can be seen that the peaks of Fe3O4, in particular, were all broad peaks, indicating the presence of amorphous substances with lattice parameters similar to the two in the rust layer. Other methods such as Mossbauer spectroscopy and infrared diffraction were still needed for further analysis (Wei, Huang, Wei, & Li, 2016).
The atmospheric corrosion of weathering steel is mainly electrochemical corrosion process. Corrosion mechanism of weathering steel surface first quickly formed electrolyte film, then the gaseous oxygen dissolves in water and form a galvanic cell with Fe, and electrochemical corrosion occurs finally. When rust layer is formed on the surface of weathering steel, corrosion products will affect the atmospheric corrosion electrode reaction under certain conditions. Compared with Fe, the FeO Gibbs will be preferentially generated due to its higher free energy and its unstable thermodynamic state. After a continous reaction, the Fe2O3 and Fe3O4 are generated, and finally the stable corrosion products γ-FeOOH was generated (Diaz, Cano, & Chico, De La Fuente, & Morcillo, 2012).
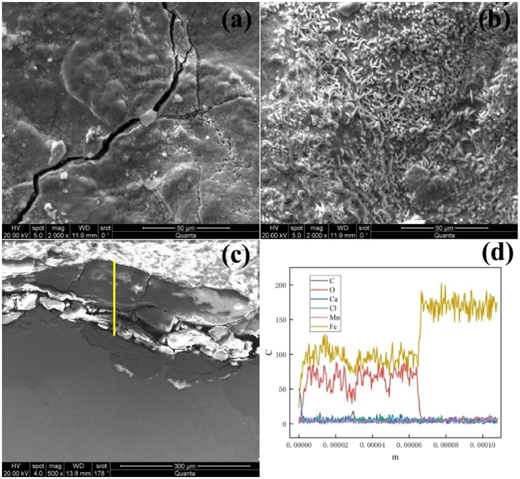
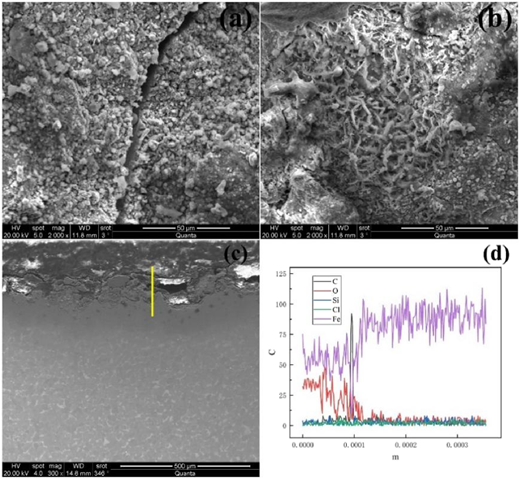
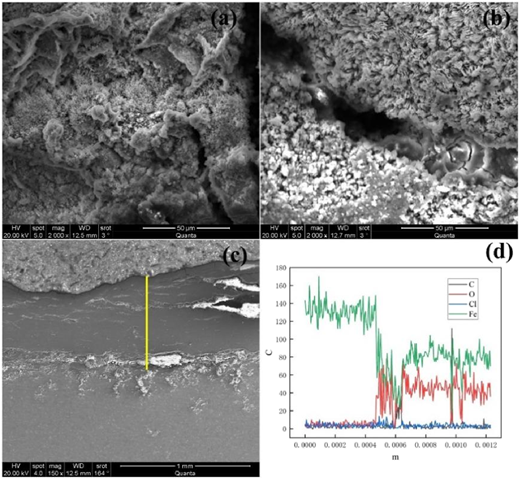
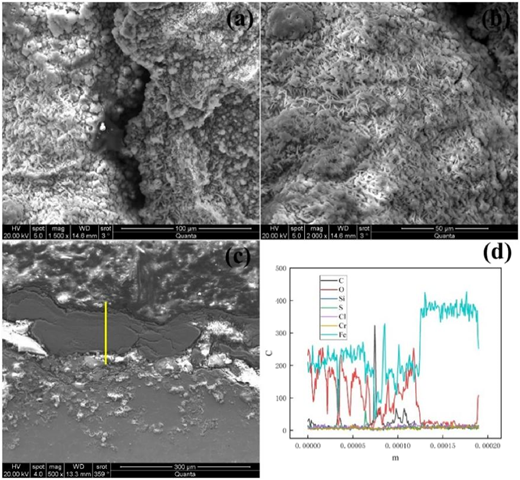
As can be seen from Figure 7–12, the surface of car body material is uneven. There are many corrosion products and cracks, and the corrosion products are dense acicular blocks. Combined with the high-magnification micrograph of the corrosion products and the line scanning data, it can be seen that the main components of the material surface are O and Fe. It can be observed that the rust layer of cross section morphology is typical weathering steel rust layer structure with the depth about 110–200 μm. According to the above XRD data, it can be concluded that the rust layer is mainly composed of Fe oxides and hydroxides (Yann, 2007). There are elements such as Si, S, Ca, Cl in some rust layers, among which Si and Ca are brought by atmospheric dust, and S and Cl are introduced by rain or coal antifreeze.
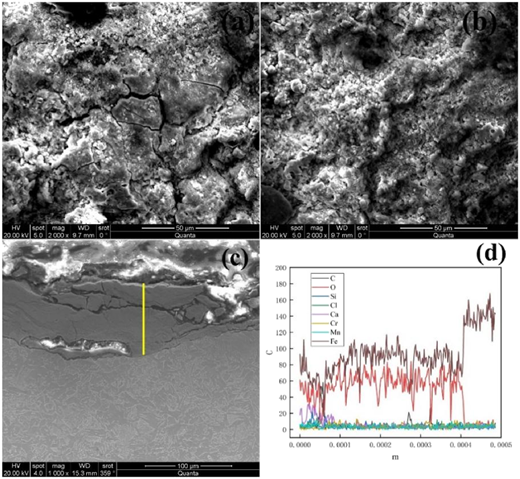
(a) (b) Surface morphology of corrosion products of material sample No.1; (c) Distribution diagram of cross section line scanning element; (d) The yellow line in c is the line scanning area. Source(s): Authors’ own work
(a) (b) Surface morphology of corrosion products of material sample No.1; (c) Distribution diagram of cross section line scanning element; (d) The yellow line in c is the line scanning area. Source(s): Authors’ own work
(a) (b) Surface morphology of corrosion products of material sample No.2; (c) Distribution diagram of cross section line scanning element; (d) The yellow line in c is the line scanning area. Source(s): Authors’ own work
(a) (b) Surface morphology of corrosion products of material sample No.2; (c) Distribution diagram of cross section line scanning element; (d) The yellow line in c is the line scanning area. Source(s): Authors’ own work
(a) (b) Surface morphology of corrosion products of material sample No.3; (c) Distribution diagram of cross section line scanning element; (d) The yellow line in c is the line scanning area. Source(s): Authors’ own work
(a) (b) Surface morphology of corrosion products of material sample No.3; (c) Distribution diagram of cross section line scanning element; (d) The yellow line in c is the line scanning area. Source(s): Authors’ own work
(a) (b) Surface morphology of corrosion products of material sample No.4; (c) Distribution diagram of cross section line scanning element; (d) The yellow line in c is the line scanning area. Source(s): Authors’ own work
(a) (b) Surface morphology of corrosion products of material sample No.4; (c) Distribution diagram of cross section line scanning element; (d) The yellow line in c is the line scanning area. Source(s): Authors’ own work
(a) (b) Surface morphology of corrosion products of material sample No.5; (c) Distribution diagram of cross section line scanning element; (d) The yellow line in c is the line scanning area. Source(s): Authors’ own work
(a) (b) Surface morphology of corrosion products of material sample No.5; (c) Distribution diagram of cross section line scanning element; (d) The yellow line in c is the line scanning area. Source(s): Authors’ own work
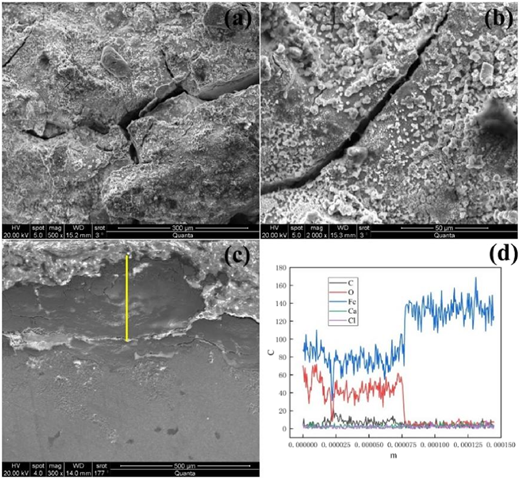
(a) (b) Surface morphology of corrosion products of material sample No.6; (c) Distribution diagram and cross section line scanning element; (d) The yellow line in c is the line scanning area. Source(s): Authors’ own work
(a) (b) Surface morphology of corrosion products of material sample No.6; (c) Distribution diagram and cross section line scanning element; (d) The yellow line in c is the line scanning area. Source(s): Authors’ own work
3.4.3 Electrochemical analysis
The OCP curve of the rusted sample in a 3.5% NaCl solution at 298K is shown in Figure 13. It can be seen from the figure that the OCP values of different rusted samples will fluctuate for a period of time and eventually stabilize. This behavioral change may be due to the stable adsorption of Cl− ions on the surface of the rusted sample. The OCP curve changes with the variation of the rust layer structure of the rusted sample (Baba, Kodama, & Katada, 2002; Katayama et al., 2005; Yamashita, Miyuki, Matsuda, Nagano, & Misawa, 1994).
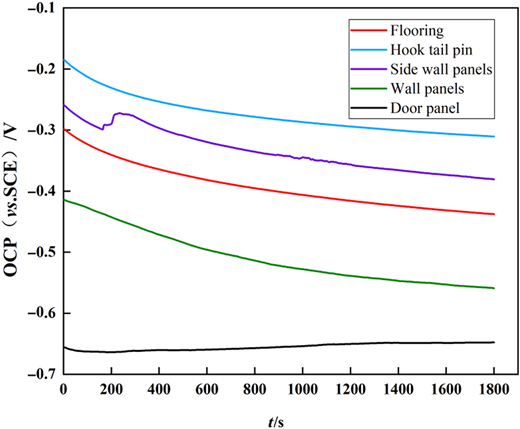
OCP curves of different rusted samples in 3.5% NaCl solution. Source(s): Authors’ own work
OCP curves of different rusted samples in 3.5% NaCl solution. Source(s): Authors’ own work
The EIS method is a corrosion electrochemical research method that uses a small amplitude sine AC signal to perturb the electrolytic cell. By observing the system’s response to the disturbance in steady state, the electrode reaction process can be studied and the impedance of the electrode can be measured to determine the material’s corrosion resistance (Pei et al., 2021; Yang et al., 2022; Zhang, Chen, Chen, Li, & Pan, 2001a). Bode diagram of different rusted samples in 3.5% NaCl solution is shown in Figure 14. The thickness of the rust layer on the sample is Hook tail pin > Side wall panels > Flooring > Wall panels > Door panels. The density of the rust layer on the rusted sample affects the corrosion rate, and a thicker rust layer can increase its resistance value. With the gradual increase of resistance values of different rusted samples, the corrosion resistance is Hook tail pin > Side wall panels > Flooring > Wall panels > Door panels.
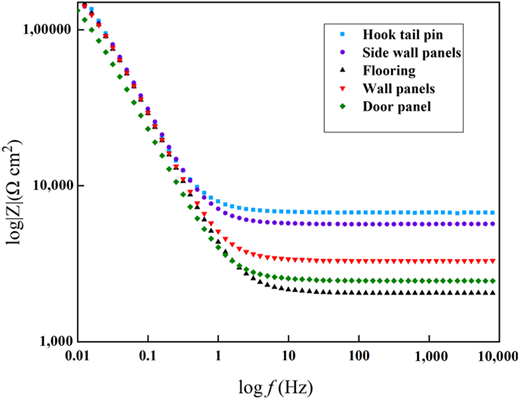
EIS Bode diagram of different rusted samples in 3.5% NaCl solution. Source(s): Authors’ own work
EIS Bode diagram of different rusted samples in 3.5% NaCl solution. Source(s): Authors’ own work
The level of self-corrosion potential reflects its tendency to continue corrosion reaction, that is, the difficulty of corrosion occurrence. The magnitude of corrosion current can reflect the magnitude of corrosion rate. Anode current is formed by the dissolution of the anode (substrate) under an applied voltage. Therefore, the smaller the dissolution current, the better the corrosion resistance of the material. As shown in Figure 15, the self-corrosion potential of Door panel > Side wall panels > Wall panels > Hook tail pin > Flooring indicates that the Door panel is the most susceptible area to corrosion. The corrosive current of Door panels > Wall panels > Flooring > Side wall panels > Hook tail pins indicates that the smaller the corrosion current, the better the corrosion resistance. The corrosion rate is highest for Door panels and lowest for Hook tail pins. The rust layer on the surface of the rusted sample changes the surface state of the material, causing the self-corrosion potential of the material to shift in the positive direction. The higher the potential, the stronger the protective effect of the rust layer. The weathering steel of the freight body substrate undergoes electrochemical corrosion under atmospheric corrosion.
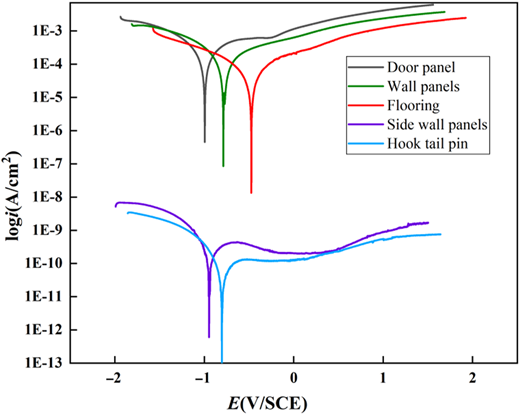
Potentiometric polarization curves of different rusted samples in 3.5% NaCl solution. Source(s): Authors’ own work
Potentiometric polarization curves of different rusted samples in 3.5% NaCl solution. Source(s): Authors’ own work
3.5 Analysis of residual liquid in the car
3.5.1 PH and conductivity of residual liquid in the car
Dust suppressant will be sprayed during coal transportation to reduce dust pollution caused by pulverized coal, and the dust suppressant contains halides. Sample of the residual liquid in the freight is collected to dilute the solution five times, and measure pH value, conductivity and ion concentration, as shown in Table 3 and Table 4. The results show that the solution is neutral with an electrical conductivity of 4.5 us/cm. The content of Cl− in the solution is high, and there is still some SO42-. Both Cl− and SO42- are corrosive ions, which can accelerate the electrochemical corrosion process of metals. Therefore, the existence of corrosive elements is one of the reasons for the corrosion of railway freight materials.
3.6 Foam adhesive porosity and water absorption
The pore structure of the freight door sealant foam adhesive is shown in Figure 16.
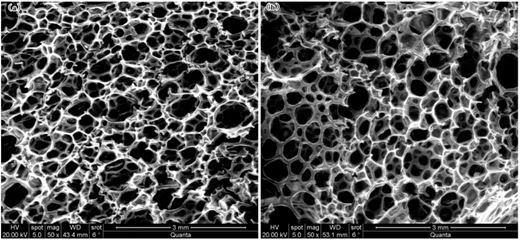
Pore structure diagram of freight door foam adhesive. Source(s): Authors’ own work
Pore structure diagram of freight door foam adhesive. Source(s): Authors’ own work
Figure 16 shows that the pores of car door sealant foam adhesive are compact and dense, and the equivalent diameter of the foam adhesive pores is about 489.3 μm. Table 5 and Table 6 show that the water absorption rate of sealant foam adhesive is about 58.7%, and there are corrosive ions Cl− and SO42- in the foam adhesive pores, with the concentrations of 114.3 mg/L and 8.1 mg/L, respectively. The corrosive ions may be due to the antifreeze or dust suppressant sprayed during the transportation of goods, and their main components include halides. The porous structure of foam adhesive has strong water absorption capacity and can absorb corrosive ions around it under wet conditions. The porous structure of foam adhesive is complex, and the Cl-and SO42- ion migration. Under dry conditions, as water evaporates, the solution inside the pores may concentrate, increasing the concentration of corrosive ions and slowly releasing them into the external environment through the pores. Prolonged surface moisture of the car door material accelerates the occurrence of material corrosion problems. Therefore, the long-term existence of corrosive elements and long-term humidity around foam adhesive are also key factors affecting the corrosion of car body materials.
4. Conclusion
The corrosion of car body materials is mainly electrochemical corrosion, and the corrosion of door materials is more obvious than that of other parts. The corrosion products are mainly Fe oxides and hydroxides, and finally generate stable γ- FeOOH. There are cracks on the surface of the corrosion products of the car body, which reduces the binding force and strength of the corrosion products and weakens the protective effect of the corrosion products on the matrix.
The presence of Si and Ca in the rust layer is brought by atmospheric dust, and S and Cl are introduced by rain or dust suppressor. There are many cracks on the surface of the rust layer, and the corrosion products have weak protective effect on the matrix. Electrochemical analysis shows that the corrosion resistance of freight body materials is Hook tail pins > Side wall panels > Flooring > Wall panels > Door panels.
The pores of car door foam sealant adhesive have tight arrangement and high water absorption, in which there are relatively high concentration of corrosive ions. Cl− and SO42−will aggravate the electrochemical corrosion process of metal materials of the car body in a humid environment.
The main reasons affecting the corrosion of car body materials include high-frequency impact of goods and corrosive ions in a humid environment.
This study was supported by Research and Development Plan of China Railway Group (N2023J065).

