This study aims to investigate whether the decision-making methods of sell-side stock analysts (analysts) influenced their stock price forecasting. In emerging capital markets, stock price forecasting critically depends on cognitive approaches to intellectual capital decision-making, yet these approaches remain poorly understood.
The study designed and conducted four experiments. Each experiment had three firms with brands as the intangible asset: Firm 1 with an internally generated brand, Firm 2 with an acquired brand and Firm 3 with an internally generated and acquired brand. Each firm generated equal earnings and operating cash flows. The four experiments differed in additional information, which can distract analysts from stock price forecasting. In total, 26 analysts representing the stock analysts' cohort took part and forecasted stock prices for 3 forecast years.
The results showed analysts used the nontechnical method across all four experiments, and the additional capital market financial ratio information provided did not distract them from their preferred selection in stock price forecasts across three forecast years. Analysts' stock price forecasts remained unaffected by sufficient earnings and cash flow information, regardless of brand classification as internally generated or acquired.
Findings contribute to understanding stock analysts’ preferred decision-making methods and the importance of transparent, intangible asset values in an emerging market setting in Sri Lanka.
1. Introduction
Asset classes can drive stock price forecast uncertainty among analysts. The literature has discussed how well to classify intangibles (intellectual capital assets) as a class of assets depending on the functionality intended from the classification (Gröjer, 2001). However, accounting standards dictate different treatments of a firm’s tangible and intangible assets in financial statements. Tangible assets are investments with long-term value shown on the balance sheet. The firm creates intellectual capital-related assets through labour and materials.
The balance sheet shows purchased intangibles as investments (Atasoy et al., 2022). However, because financial accounting and reporting must follow generally accepted accounting principles (GAAP) (IAS 38, 2025), companies typically expense costs of developing internally generated intangibles unless they meet strict criteria for qualification as an intangible asset. How firms account for internally generated intellectual capital assets result in less transparent information shared with analysts and subsequent adverse effects on their stock price forecasting (Wu and Lai, 2020).
Intellectual capital contains hidden wealth as future cash inflows (Blair and Wallman, 2000). Differential reporting poses difficulties for analysts in stock price forecasts because some can afford resources to buy or access intellectual capital-related information that firms do not disclose to the public (Amir et al., 2003). Analysts typically use earnings to forecast stock prices, and their perception of firm earnings plays a crucial role (Barker and Imam, 2008). Analysts incur additional costs to acquire information about future earnings from intellectual capital-related assets not disclosed in firms’ financial statements, and they do so by selecting firms where the benefits of obtaining such information are more than the costs incurred in stock price forecasts (Barth et al., 2001).
If firms report sufficient earnings and cash flow information from the two asset classes, stock analysts can determine the value of acquired and internally generated intellectual capital assets within the firm (Abeysekera, 2016; Call et al., 2009). Research has shown no significant difference between reporting intellectual capital information in financial statements and notes to accounts (Jifri and Citron, 2009). Internally generated intellectual capital assets comprise separate unidentifiable resources, and acquired intellectual capital comprises identifiable resources equated to purchased value (IAS 38, 2025).
Analysts can use various methods to decide about stock price forecasting, which leads to differences in analysts’ stock price forecasts (Arnold and Moize, 1984; Mear and Firth, 1990). The literature provides little insight into the context of a capital market in an emerging country setting. (Supplementary materials provide more information to support the research gap).
Contrary to anecdotal evidence, item-wise value relevance of accounting numbers has grown over the past six decades, mainly because of intangibles (Barth et al., 2023). This study isolated brands, an intellectual capital asset common to many firms, to fill this research gap. The estimated brand values are significantly and positively associated with stock prices, and coming up with their accurate estimates can help stock analysts make more precise forecasts about them (Barth et al., 1998). Including brand information in earnings forecasts can also help increase consumer perception, assisting future sales growth (Kimbrough et al., 2023).
Research has stated that providing sufficient cash flows and earnings information about intellectual capital assets such as brands should not influence stock analysts' stock price forecasts (Abeysekera, 2016; Brown and Rozeff, 1978). In this setting, this study examined whether differences in stock analyst decision-making methods led to differences in stock price forecasts.
A point of difference between developed and emerging markets is that local information has more influence on stock prices in emerging markets (Harvey, 1995). Emerging markets are less than informationally fully efficient in that all participants do not have the same level of information, and all active investors cannot fully and equally benefit from their information. It makes the market participant’s behaviour irrational and does not follow random behaviour. Stock prices do not contain complete information to make logical, fully informed decisions. The random walk hypothesis applies when the market has full details on asset prices, and any variations in an asset price occur randomly rather than purposefully. Such a proposition does not apply to an emerging capital market with less than complete information, meaning a variation in an asset price occurs purposefully (Roy, 2018).
For example, incomplete information results when parties fail to fully disclose the future value-creating potential of intangible assets. The literature highlights the information opaqueness created by intangible classification and the importance of valuing each item’s intellectual capital for information transparency (Kimbrough et al., 2023). These efforts can assist analysts in their stock price forecasts. The literature is strikingly absent in investigating stock pricing decision-making behaviour.
Market participants, such as investors (and possibly analysts), do not behave rationally in stock price assessments. Instead of relying on rationality, they develop heuristics to resolve economic challenges such as stock price forecasts. Heuristics means people including personal information in decisions; they adopt heuristics to yield the best solutions as long as they remain stable. The adaptive market hypothesis (Lo, 2017) incorporates many behavioural biases into the heuristics that adapt to the market’s financial and non-financial context.
The capital market participants' adaptive market hypothesis is associated with economic anomalies and better explains their behaviour. Emerging markets show more pronounced economic anomalies. Their investment strategies are unstable, and stock performance keeps changing, performing well on certain days but not on other days (Xiong et al., 2019). Economic anomalies limit the availability of sufficient information and the speed of capital market participants' receiving it (dos Santos et al., 2024). As found in the South Asian countries with contrarian stocks in Bangladesh, India, and Pakistan, investors rely on sentiments or merely past stock movements to reap the benefits of stock price fluctuations across time (Munir et al., 2021). These factors make it harder to make stock valuations methodically.
The study selected Sri Lanka as the research site because it exemplifies emerging stock market behavioural characteristics based on the adaptive market hypothesis (Lekhal and El Oubani, 2020). Unsophisticated investors dominate this market, and they closely rely on professional analysts to assist their stock price decision-making (Shantha, 2019). Emerging markets also have commonly shared economic conditions, such as relatively high inflation closely connected to the money supply (Madurapperuma, 2023a). These macroeconomic variables closely relate to stock prices in emerging markets (Madurapperuma, 2023b).
With this backdrop, the study aims to understand whether sell-side analysts (analysts) influence stock price decision-making methods and whether their cognitive approaches to intellectual capital decision-making influence stock price forecasting in emerging market Sri Lanka. The study contributes to the literature by revealing the relative importance of analysts' decision-making methods and whether their cognitive approaches are vital in stock price forecasting.
To achieve its aim, this manuscript contains three broad sections. Detailed in the Methods section are the experimental approach, participants, materials (three firms per experiment), procedures, and measured variables. The Results and Discussion section reports the descriptive statistics and the results of the four experiments. The Conclusion section gives concluding remarks, limitations of the study, and future research directions.
2. Methods
2.1 Experimental approach
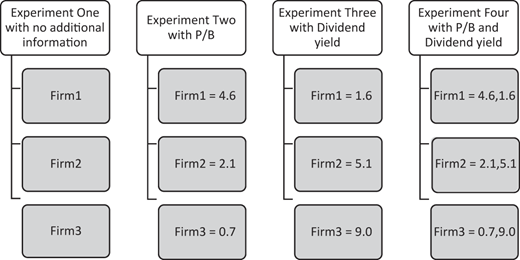
Figure 1 shows the experimental design. Each experiment comprised three firms designed for this study: Firm 1, with internally generated intangibles only (Brand A); Firm 2, with acquired intangibles only (Brand B); and Firm 3, with an internally generated intangible, an acquired intangible, and an acquired intangible now disposed of (Brands A, B, and C).
The study designed three firms for the experimental setting. Following GAAP, Firm 1’s balance sheet must show its acquired brand as an asset. Firm 2 had developed a brand within the company, which meant that costs had to be incurred in developing the brand to be expensed in the income statement. Firm 3 had an acquired brand, an internally generated brand, and a previously acquired brand disposed of in the current year of the experiment; therefore, it had to use accounting treatments applicable to purchased and internally developed brands. Each experiment involved these three brand scenarios: Firm 1, Firm 2, and Firm 3.
The four experiments in the study differed based on additional information introduced into the experiments, because further information affecting firms may influence analysts differently in their stock price forecasts. Additional information comprised market-to-book value and dividend yield, two capital market financial ratios affecting the stock price. The market-to-book is a measure of value placed on assets by investors (Kim, 2023). The dividend yield is a measure of income stream for investors, with firms paying higher dividends that can favourably influence stock price (Stereńczak and Kubiak, 2022).
Experiment 1 introduced no new information on firms. Analysts received price-to-book values for the three firms from Experiment 2. Experiment 3 provided the dividend yield, with the three firms having different dividend yields. Experiment 4 introduced price-to-book values and dividend yields to make the three firms more complex and asked analysts to make stock price forecasts.
Conducting laboratory experiments is an established research method in accounting research (Snowball, 1986). This study adopted an experimental approach (Bhojraj and Libby, 2002; Hunton et al., 2006). One experimental study used financial assets available for sale (debt and equity securities other than those held to maturity and trading) and their effect on earnings management in an experimental setting that investigated financial reporting transparency (Hunton et al., 2006). Another experimental study examined the effects of increased market pressure (resulting from a pending stock issuance) on managers who disclose earnings versus cash flows (Hunton et al., 2006).
These experimental studies show that a laboratory market setting allowed the isolation of factors investigated and their conscious introduction to the participants (e.g. financial ratios) to examine their effect on the variables or factors of interest (Libby et al., 2002).
This study used a within-subject design, which increases the statistical power for optimisation when using relatively few participants. A weakness of the within-subject design is that participants can carry over the effect of the previous experiment to the next. This study used different information mixes to mitigate the carryover effect in the four experiments (supplementary materials provide more details).
2.2 Participants
Participants were stock analysts at stockbroking firms licenced by the Colombo Stock Exchange in Sri Lanka. The study conducted the experiments at the participants’ workplaces. Research has shown that task-specific experiences correlate highly with stock price forecasts (Clement, 1999). All participants routinely analysed the information on the stocks of the listed firms and recommended their stock forecasting to their investment clients. Studies have encouraged people experienced in their vocations to take part because they have learned the real-life aspects of the costs and benefits of deciding (Hunton et al., 2006; Libby et al., 2002).
Twelve analyst firms and 26 people, at least two from each analyst firm, took part in the study, representing all stockbroking firms. The participants included four heads of research, two research managers, and one CEO in stockbroking firms; the rest carried the analyst title.
One might prefer experienced analysts with many years of service; Inexperienced analysts can make overpriced forecasts (Dong et al., 2024). It becomes an issue when there is a wide distribution of experienced and inexperienced analysts. The analyst’s experience differences, which do not apply to the present study, which can cause the forecast inaccuracies. In this study, most analysts had similar experience levels.
2.3 Details of the three firms designed for the experiments
Studies have examined stock pricing decisions primarily based on earnings (Dechow, 1994; DeFond and Hung, 2003; Penman, 1996). Focusing on earnings alone as a stock forecasting measure can be erroneous because managers can manage earnings to benefit themselves (pernicious earnings). Research shows that analysts with previous industry experience are more likely to detect earnings management in these industry sectors, whereas other analysts may not (Bradley et al., 2017). The reported earnings then affect stock analysts’ price forecasts, which they typically provide to investors who make stock price investment decisions (Abarbanel and Lehavy, 2003).
Managers can manage firms’ earnings beneficially or perniciously to investors (Ronen and Yaari, 2002). However, providing cash flow information helps stock analysts segregate earnings surprises into cash flows and accruals (Brief and Lawson, 1992; McInnis and Collins, 2011).
This study controlled the undesirable effect of managing earnings with accruals influencing forecast stock prices in all four experiments by informing analysts that all three firms’ internal and external cash flow factors were identical.
2.4 Preparing participants for experiments
The study made appointments to meet the analysts at their workplace. Under the approved ethics agreement, Sri Lankan stockbrokers received a Participant Information Sheet asking if they wanted to participate in the study. The ethics agreement required researchers to give participants informed consent and encourage questions about the study.
Before participants began the experiment tasks, they read the cover sheet, which explained the assumptions common to all experiments, the activities involved, and the tasks they must complete. The assumptions underlined the year analysed ended on 31 December 20Year7 of the current financial year. The study set the experiment on April 1, 20Year8, where “Year” refers to the experiment year.
The calendar year is the typical financial reporting year in Sri Lanka. Companies typically release annual reports approximately three months after the year-end. This study used the annual report released on April 1st, 20Year7 (for the year ending December 31st, 20Year6), and the subsequent stock price was Rs. 65.
The cover sheet informed participants that each firm recorded Rs. 50 million in actual earnings (profits after tax) for the years ended 31 December 20Year6 and 31 December 20Year7. The firm released the 31 December 20Year7 annual report for the current forecasting year-end on 1 April 20Year8.
This study informed participants that the internal and external factors affecting the cash flows of all three firms were identical and asked stock analysts to forecast stock prices for the next three years. To do this, participants received forecast earnings for the next five years. It did not extend forecast earnings beyond five years because stock price forecast uncertainty increases when forecasting for distant years. After all, it becomes more uncertain if forecast cash flows accurately turn into realised cash flows (Collins et al., 1994; Lundholm and Myer, 2002).
Analysts stated stock prices for the future three years at 1 April 20X9 (one year ahead), 1 April 20X10 (two years ahead), and 1 April 20X11 (three years ahead) after knowing all information relating to the current year. The experiments minimised the order effect. (Supplementary materials provide more details.)
2.5 Conducting stock price forecast experiments
2.5.1 Experiment one
Experiment One introduced three firms, with the current year ending December 31, 20Year7. Firm 1, with brand A, stated that the notes to the accounts in the 31 December 20Year7 annual report show a decrease in the operating cash flow of Rs. 15 million because of expenditure on brand A (an internally generated brand) and that there will be no further expenditure on brand A. The cash outflow related to Brand A has an earnings potential of Rs. 15 million (after-tax profits) for the next five years. The participants then recorded their Firm 1 stock price forecasts for the next three years as of 1 April 20Year9, 1 April 20Year10, and 1 April 20Year11.
Firm 2 had an acquired brand (Brand B), and the notes to the accounts in the 20Year7 annual report stated that the investing cash flow decreased by Rs. 15 million because of expenditure on acquiring brand B (acquired brand). There will be no further expenditure on brand B. Brand B might increase earnings by Rs. 15 million each of the next five years. Participants recorded their Firm 2 stock price forecasts for the next three years as of April 1, 20Year9, April 1, 20Year10, and April 1, 20Year11.
Firm 3 had Brands A, B, and C. The notes to the accounts in the 20X7 annual report showed their effects on operating, investing, and financing cash flows. The account notes showed a decrease in operating cash flow by Rs. 15 million because of expenditures on Brand A. There will be no additional expenditures on Brand A. The cash outflow related to Brand A has an earnings potential that will increase by Rs. 15 million each of the next five years.
The notes to the accounts stated that the investing cash flow decreased by Rs. 15 million because of the purchase of brand B. Brand B’s cash outflow shows increased earnings potential in Rs 15 million each of the next five years. The financing cash flow increased by Rs. 15 million because of the sale of brand C. Lower cash inflow from the sale of Brand C will cause a decrease in earnings of Rs. 15 million because of opportunities lost in each of the next five years.
Brands in firms and forecast cash flows are Rs. 15 million cash outflow in all three firms and expected earnings are Rs. 15 million for each future year. The accruals do not change differently between the three firms; therefore, the accruals do not affect analysts’ forecast stock prices. The participants recorded their Firm 3 stock price forecasts for the next five years as of April 1, 20Year9, April 1, 20Year10, and April 1, 20Year11.
2.5.2 Experiment two
The Experiment 2 cover sheet stated: “This is a new experiment”. The instructions for Experiment 2 gave analysts the market price-to-net book value (P/B value) for each firm as additional information. Experiment 2 showed price-to-book values of 4.6, 2.1, and 0.7 for Firms One, Two, and Three, respectively. Participants recorded their stock pricing forecasts for the three firms for the next three years as of 1 April 20Year9, 1 April 20Year10, and 1 April 20Year11.
2.5.3 Experiment three
The Experiment 3 sheet stated, “This is a new experiment”. It provides you with the Dividend Yield (Div Yield) on April 1, 20Year8, for each firm in Experiment One. Firm 1 has 1.6, Firm 2 has 5.1, and Firm 3 has a 9.0 dividend yield. Participants recorded their stock price forecasts for the three firms for the next three years as of 1 April 20Year9, 1 April 20Year10, and 1 April 20Year11.
2.5.4 Experiment four
The Experiment 4 sheet stated, “This is a new experiment”. The data for Experiment 4 comprises the market price to net book value (P/B) and dividend yield (Div Yield) of each firm on April 1, 20X8. Firm 1, Firm 2, and Firm 3 have price-to-book values of 4.6, 2.1, and 0.7, respectively, and dividend yields of 1.6, 5.1, and 9.0, respectively. Participants recorded their stock pricing forecasts for the three firms for the next three years as of 1 April 20Year9, 1 April 20Year10, and 1 April 20Year11.
2.6 Measuring variables
The dependent variable in this study was the analyst stock price forecasts reported in the four experiments. A controlled factor in the study was the forecast year, acknowledging that it can influence analysts’ stock price forecasts (Collins et al., 1994; Lundholm and Myer, 2002).
This study investigated the decision methods used by analysts in their stock price forecasts. The study categorised decision approaches (shown within brackets in the next sentence) into three decision methods.
For example, the technical method net present value [NPV], internal rate of return [IRR], and payback) is based on rational logic. The non-technical method (e.g. professional judgement and intuition) is the heuristics analysts use flexibly. The combined method uses technical and nontechnical methods (Brief and Lawson, 1992; Carbone et al., 1983).
The empirical testing introduced the firm–brand scenario (i.e. Firm 1: Brand A; Firm 2: Brand B; Firm 3: Brands A, B, and C) for empirical testing because brand class alone and brand classes together must not have different levels of influence on analysts’ stock price forecasts (Abeysekera, 2016; Call et al., 2009).
2.7 Hypothesis development
A marketplace contains uncertainties, and the experimental design had to control them to conclude that the variables investigated influenced stock price forecasts. Some are systemic risks arising from uncertainties that are not diversifiable and affect all firms. The study controlled for them by requiring participants to consider only the information given in each experiment.
Unsystematic risks are specific to firms. The experimental design eliminated these risks by controlling for the effect of cash flows from a firm’s earnings potential on analyst stock price forecasts. It also informed each experiment that all other factors were common to all firms.
Research has found that disclosures of the earnings potential of brand classes reconcile the differences in risk perceptions between internally generated and acquired brands. Brand classification does not influence analysts’ stock price forecasts (Abeysekera, 2016; Call et al., 2009). Therefore, the study expects brand classification does not analyse stock price forecasts in all four experiments. However, analysts’ decision methods can affect stock price forecasts, even without introducing them into firms, because of their cognitive preferences. The adaptive market hypothesis, in investigating this study’s aim, shows analysts' increased reliance on heuristics and decreased reliance on logic for stock price forecasts. Heuristics facilitate analysts to make fewer mistakes in stock price forecasts in less than fully informationally efficient markets, such as in a developing country, Sri Lanka. Analysts learn from those mistakes over time and develop their own principles and rules, which they progressively apply to stock price forecasting (Noreen et al., 2022).
2.7.1 Experiment one: hypothesis 1
The three firms had an identical current stock price by experimental design before making the stock price forecasts. Hence, any stock price forecast differences result from the decision methods analysts use in the stock price forecasts. The study states the following hypothesis:
Analysts’ decision methods influence analysts’ stock price forecasts (Experiment 1).
Brand classification does not influence analysts’ stock price forecasts (Experiment 1).
2.7.2 Experiment two: hypothesis 2
Experiment 2 had three firms with identical earnings forecasts but different market prices to the net book values assigned to them. The firms' market price to net book value has emerged as a strong determinant of stock price forecasts. It explains the differences in stock returns among firms moderated by firm size (Kothari and Shanken, 1992; Kothari et al., 1995).
Clean surplus accounting shows that the ratio of market price to net book value shows the future return on equity (Penman, 1996); it is a measure independent of the current level of firm profitability (Brief and Lawson, 1992; Wilcox, 1984). Research examining the predictors of the Dow Jones Industrial Average has found that market price to net book value provides explanatory information about stock returns not captured by dividend yields (Pontiff and Schall, 1998).
Research analysing a large sample of firms with R&D costs as a proxy for internally generated intellectual capital has found a strong correlation between these uncapitalised R&D costs, and market price to book value (Lev and Sougiannis, 1996). They conclude investors recognise the future earnings capacity for research and development costs. However, several others have noted that insufficient information provided through financial statements about internally generated intellectual capital can reduce transparency about its value-creating potential (Deng et al., 1999; Lev, 1999). Analysts overcome this partial opaqueness by adjusting stock prices to reflect capitalising rather than expensing internally generated intellectual capital (Amir et al., 2003).
Market price to net book values is a proxy for the future earnings ability of internally generated intellectual capital, showing that the market has capitalised it as an asset, with investors prepared to buy stocks at a market price above the stock price based on the firm’s net book value (Lev, 1999). Providing analysts with a firm’s market price to net book values makes their stock forecasting task somewhat complex and needs consideration in future stock pricing decisions.
When the three firms have materially different market-to-book values, the analyst stock price forecasting could influence their stock price forecasts for the three years. The market price to net book value assigned to firms can influence analysts’ choice of decision methods for stock price forecasts. The study states the following hypothesis:
The analysts' decision methods influence their stock price forecasts, with a firm’s market price to net book value (Experiment 2).
Brand classification does not influence analysts’ stock price forecasts, with a firm’s market price to net book value (Experiment 2).
2.7.3 Experiment three: hypothesis 3
Experiment 3 involved three firms with identical brand earnings potential but different dividend yield values. Several cross-sectional (Litzenberger and Ramaswamy, 1979) and time series (Fama and French, 1988, 1989; Hodrick, 1992) studies have pointed to dividend yield (dividend payment over firm market value) as having predictive power for stock prices.
In recent studies, the dividend yield has been out of favour because of the increasing emphasis on the market price to net book value as the primary form of return on investment. However, dividends allow investors to receive cash through dividend distribution and reduce risk instead of the high expectation of capital gains. The dividend yield helps measure firm value through income returns (Campbell and Shiller, 1988). However, the dividend yield does not show a comprehensive valuation because several factors influence the dividend level.
For instance, a high-growth firm may reduce its payment level to keep funds for future expansion. Materially different dividend yields can influence the stock price forecasts of stock analysts for three years. Despite notes to accounts disclosing consistent expected brand class earnings, varying dividend yields may lead analysts to use different decision methods for stock price forecasts. Therefore, this study states the following hypothesis:
Analysts’ decision methods influence analysts’ stock price forecasts with a firm’s dividend yield financial ratio (Experiment 3).
Brand classification does not influence analysts’ stock price forecasts with a firm’s dividend yield financial ratio (Experiment 3).
2.7.4 Experiment four–hypothesis 4
Although returns on stock investments can arise from dividends and capital appreciation, the two do not always have a positive correlation. Experiment 4 involved three firms with identical brand earnings potential but different market prices from netbook and dividend yield values. Individual regressions of market price to net book value and dividend yield showed a positive and significant relationship with stock return. The market price to net book value showed a positive relationship when both predictors regressed against the stock return.
However, the dividend yield has a negative relationship because of complexities in stock price forecasting in the presence of both financial ratios, as opposed to considering each financial ratio individually. Market price to net book value and dividend yield information make analysts’ stock price forecasting more complex because of the additional information (Pontiff and Schall, 1998). This study expects stock analysts to differ in their stock price forecasts and states the following hypothesis:
The decision methods of the analysts influence their forecasts of the stock price and provide a firm’s market price to net book value and dividend yield (Experiment 4).
Brand classification does not influence analysts’ stock price forecasts and provides a firm’s market price to net book value and dividend yield (Experiment 4).
3. Results and discussion
3.1 Analysts’ understanding of cash flows
Participants’ responses on the five-point Likert scale to the inquiry about their understanding of the accounting standard for the statement of cash flow averaged 4.27 out of 5, showing that they had sufficient skills to understand and interpret the cash flow information. The standard deviation and quartile values of stock price forecasts vary randomly between experiments, pointing out that previous experiments do not serve as a learning experience for analysts in forecasting stock prices for the conducted experiments. (Supplementary materials provide more details).
3.2 Hypothesis test findings
The study analysed the influence of the three factors (firm-brand scenario, forecast year, and decision method) using 3 × 3 × 3 within-subject analysis of variance (ANOVA) for each experiment with 702 observations (26 participants, * 3 firm brands, * 3 forecast years, *3 decision methods).
The four experiments differed from the additional information. In Experiment 1, analysts who lack additional information measure stock pricing. In Experiment 2, analysts measure stock pricing with the market price to net book values of three firms, as additional information. In Experiment 3, analysts used the dividend yields of three firms as additional information. In Experiment 4, analysts used net book values and dividend yields of firms as additional information. (Supplementary materials provide more details.)
3.2.1 Experiment 1—Hypothesis one findings
Experiment One tested the first hypothesis and found that stock analysts’ decision methods significantly influenced stock price forecasts. As expected, brand differences between the three firms did not affect stock price forecasts (F-statistic = 0.08 p = 0.92) supporting H1b, and the forecast year significantly influenced them (F-statistic = 5.21, p = 0.01) supporting H1a. The n = 702, and the adjusted R2 = 0.030. (Table 1).
3.2.2 Experiment 2—Hypothesis two findings
Testing Hypothesis 2 revealed that stock analysts' decision methods significantly influenced market value forecasts within the net book value experiment. The adjusted R-squared slightly increased in Experiment 2 (0.035) compared with Experiment 1, which had no additional information (0.03). Firms that are different by brand had no influence (F-statistic = 0.11, p = 0.898) support H2b. The forecast year and the decision method significantly influenced stock price forecasts (F-statistic = 8.98, p = 0.001). The n = 702 and adjusted R2 = 0.035 support H2a. (Table 1).
3.2.3 Experiment 3—Hypothesis three findings
With dividend yield as additional information, analysts differed significantly in their stock price forecasts for the firms. The adjusted R-squared increased (0.057) compared with Experiment One (0.03), which did not have additional information. Firms represented by different brands had no influence (F-statistic = 0.02, p = 0.977) supporting H3b, but the forecast years and analysts’ decision methods influenced the forecast stock prices supporting H3a (F-statistic = 12.69, p = 0.001). (Table 1).
3.2.4 Experiment 4—Hypothesis four findings
Hypothesis Four predicted that the firms' brand classes would not significantly influence the market (F-statistic = 0.04, p = 0.964), supporting H4b. However, analysts assigned the three firms substantially different price-to-book values and dividend yields. The forecast years and decision methods significantly influenced analysts’ stock price forecasts (F-statistic = 3.56, p = 0.029), supporting H4a. The n = 702, and the adjusted R2 = 0.025. (Table 1).
The findings from the four experiments show that when brand values are disclosed to stock analysts, whether purchased or developed internally, the information difference due to opaqueness is removed. These findings are consistent with previous studies, which pointed out that providing sufficient earnings and cash flow information about two asset classes, whether on financial statements or in notes to accounts, assists analysts in evaluating the information contained in forecasting stock prices forecasts (Abeysekera, 2016; Call et al., 2009; Jifri and Citron, 2009). The firm-brand scenario was not statistically significant. As Barth et al. (1998) pointed out, transparent disclosure of internally developed and purchased brand values eliminates the differential influence that can arise from undisclosed brand values on the stock price. Intangible disclosures, such as brand disclosure, play a vital role in stock price forecasts in the knowledge and digital economy (Barth et al., 2023). It also diminishes the importance of analysts' experience, where analysts with prior knowledge more accurately guess the value of undisclosed brand values (Dong et al., 2024).
3.3 Post hoc tests
The study conducted post-analysis tests to determine which decision method significantly influenced analyst stock price forecasts. It used Tukey’s pair-wise comparison of the mean test at 5% with honestly significant differences. (Supplementary materials provide more details).
Stock analysts increasingly rely on nontechnical methods for stock price forecasts, which can benefit investors because stock prices may not linearly fit into the technical analysis (Staffini, 2022). Research has shown that using the technical method requires an efficient market hypothesis. A capital market in an emerging economy, such as the Colombo Stock Market, provides less than complete market information (Hunter and Coggin, 1988). The analyst’s behaviour supports the adaptive market hypothesis, where they rely less on rationality and more on heuristics (Lo, 2017).
4. Conclusion
4.1 Concluding remarks
Stock price forecasting environments with controlled market information through an experimental design (i.e. firm-specific capital market information) have led analysts to forecast stock prices in those contexts. After investigating analysts' decision-making methods, the findings show they used non-technical decision-making methods led with non-technical information for stock price forecasting, explained by additional analysis conducted using post hoc tests. Their approach is consistent with the adaptive market hypothesis, relying on more principles and rules learnt through experience and less logic (Noreen et al., 2022). It is also consistent with an emerging capital market in Sri Lanka, where less-than-full information about firms is available to analysts.
The information transparency about brand valuations removed the influence of intangible asset classification on stock price forecasts. Such information transparency removed the perceptual barrier for analysts about intellectual capital classification, otherwise its differential effect on analysts' stock price forecasts. Their market knowledge influences analysts' stock price forecasts. The adaptive market hypothesis suggests that market participants, such as stock analysts can adapt their heuristics less than rationally. This means stock analysts rely more on a less logic-driven, non-technical decision approach (dos Santos et al., 2024).
4.2 Research contribution
The study contributed research to methodology, theory, practice, and policy.
Methodological contribution: The study contributes to methodology through a new experimental design that selectively introduces capital market financial ratios as additional information to measure analysts' behaviour in stock price forecasting. It adds to the portfolio of within-subject experimental accounting research (Libby et al., 2002).
Theoretical contribution: It contributes theoretically by showing that analysts increasingly rely on non-technical methods to forecast stock prices in Sri Lanka’s emerging stock market. This aligns with the adaptive market hypothesis, showing that the emerging stock market is irrational and inefficient (Lo, 2017). Although the experiments controlled for such a lack of information, stock analysts may have a mental framework to rely upon the nontechnical method because they typically forecast in an imperfect capital market. The findings are also consistent with a previous study, which found that analysts’ stock price forecasts differ across countries because of differences in societal culture, legal systems, and the International Financial Reporting Standards (IFRS), which provides the framework to produce accounting numbers (Bilinski et al., 2013).
Practical contribution: The study points to practical contributions to the stock market industry in Sri Lanka that can apply to emerging market settings based on the adaptive market hypothesis. Providing information about intellectual capital-related assets, cash flow, and earnings can help decrease analysts' behavioural biases about intangible classifications.
Stock analysts' decision-making methods are crucial in advising investors on where and what stocks to invest in. In adaptive markets, less wealthy investors follow stock analyst decisions and become decision-followers. Investors need to acknowledge that adaptive market investment strategies in bull market situations may not be operative in bear market situations, as investors need to re-learn and develop heuristics to adapt to new situations (Lo, 2017).
Policy contribution: Because stock analysts use nontechnical decision methods, formally educating them on the United Nations Sustainable Development Goals (SDGs) agenda would be helpful for Sri Lanka’s policymakers, the Colombo Stock Exchange, and stockbroking firms. Intellectual capital comprises economic and sustainability-related intellectual capital (Abeysekera, 2022), and stock analysts can authoritatively advise the investing community about the prudent investment of their capital for the expected paybacks and financial returns. SDG 10 (Reduced Inequalities), target 10.5, supports improving monitoring and regulation in financial markets and by institutions that regulate them (United Nations, 2025). Further, in an adaptive market, the investors are driven to earn satisfying rather than maximising returns and may consider staying longer in the market for sustained returns.
4.3 Limitations and future research
The following three aspects bound generalising results. First, the study used an experimental design in a controlled setting to support internal validity. The researcher manipulated the independent variable to find out whether it causally influenced the dependent variable. However, replicating the design in a real market setting can enhance external validity. Second, the study used two capital market ratios as noise or distraction factors for analyst forecasting. Analysts consider an array of capital market ratios for stock price forecasting. Third, the study used quantitative analysis. The study acknowledges that qualitative approaches like interviews and focus groups can reveal more details about analysts' stock price forecasting behaviour.
The following are five research propositions uncovered by the study. First, research has shown that disclosure standards can increase forecast accuracy (Tong, 2007). However, this study indicates that a broader range of stock price forecasts can confuse investors. Stock analysts benefit investors by disclosing their decision methods and the extent of their use in stock price forecasts. This study specifically investigated the stock price forecasts only, and future research can investigate decision methods of stock price accuracy.
Second, analysts’ formal qualifications could affect their stock price forecasts regarding their decision method. This remains un-investigated, but it makes up a future research proposition. Neither did the study investigate the accuracy of analysts’ stock price forecasts.
Third, this study’s new, previously unperformed experiments resulted in findings that were not directly comparable to future studies. However, it paves the way for future studies to extend the understanding of analysts' stock price forecast behaviour.
Fourth, future research could investigate whether neural and deep learning techniques complement analysts by simulating the human brain with analysts’ decision-analytic approaches falling within the nontechnical method (Gu et al., 2020). Research has shown that analysts’ work experience contributes to their ability and skill and that the resources available in stockbroking firms positively contribute to forecasting accuracy (Clement, 1999).
Fifth, a future study could investigate whether these factors mediate analysts’ decision-making methods regarding stock forecast prices and their accuracy. Because this study used an experimental research method, it established causal but not external validity (Libby et al., 2002). Future research could use the field study research method to establish external validity.
Institutional review board statement
The University of Sydney, Australia. Human Research Ethics Committee approved this research (11-2007/10469).
The author gratefully thanks the anonymous reviewers, Editor Professor Shanthi Gopalakrishnan, and Associate Editor Professor Laurens Swinkels for their valuable feedback during the review process, which contributed to the enhanced quality of the paper.
The supplementary material for this article can be found https://doi.org/10.6084/m9.figshare.21407034