Skip to Main Content
Purpose

This study investigates the effects of LED airfield lighting on sustainability and safety, aiming to provide actionable insights for airport operations, health and safety, and sustainability managers. It evaluates both global and New Zealand-specific contexts to understand how LED lighting contributes to energy efficiency, cost-effectiveness, and safety in airport environments.

Design/methodology/approach

A qualitative methodology was adopted, combining primary data from five expert interviews with secondary data from a systematic literature review of 47 articles. Thematic coding was employed to identify key influencing factors, followed by a Pareto analysis, degree of centrality, and causal loop diagramming to assess their systemic importance.

Findings

The study identifies Energy Efficiency (EE-01) and Reduction of Energy Consumption (EE-02) as the most influential factors closely linked to operational savings and sustainability goals. Durability (IR-02) and High-Performance Light Output (IR-01) also emerged as critical for ensuring long-term reliability and visual safety. While factors such as Reduced Maintenance Costs (CE-01) and Smart Control and Adaptability (TI-01) are less frequently cited in the literature, consultation input suggests they are becoming increasingly relevant in modern airfield systems. The analysis reveals a balanced emphasis on economic efficiency, safety, and environmental performance.

Research limitations/implications

The study is limited to English-language sources from 2019 onward and includes a focused sample of industry consultations, which may affect generalisability. Nonetheless, the integrated analysis offers a robust foundation for future research and policy development in sustainable airport infrastructure.

Practical implications

From a practical standpoint, the study provides actionable insights for airport authorities, infrastructure designers, and health and safety managers. Stakeholders are encouraged to prioritise LED lighting as part of broader sustainability strategies—not only for the environmental and financial advantages but also for enhanced visual performance, reduced maintenance-related hazards, and emerging opportunities for smart lighting control. For policymakers, the results underscore the need to support LED adoption through targeted incentives, technical standards, and regulatory frameworks, especially in contexts like New Zealand, where national sustainability goals are aligned with infrastructure modernisation.

Originality/value

This research presents the first comprehensive evaluation of LED airfield lighting through a systems-thinking and network-analysis lens, integrating perspectives on sustainability, safety, and cost. It provides airport stakeholders with evidence-based insights to support safer, more energy-efficient, and environmentally aligned airfield operations.

The aviation industry is critical to global trade, tourism, and connectivity. However, the sector faces increasing pressure to balance operational efficiency with environmental sustainability An et al. (2025). Airfield lighting systems play a crucial role in ensuring safe airport operations, particularly during low-visibility conditions (Bullough, 2017). A critical aspect of this transformation involves upgrading infrastructure systems, such as airfield lighting, which includes runway centerline lights, runway edge lights, approach lights, and taxiway centerline lights. All of these are essential for maintaining safe aircraft movement in low-visibility or nighttime conditions (Bullough, 2017).

Traditional lighting technologies, such as incandescent bulbs, have been proven to be energy-intensive and costly to maintain (Baxter et al., 2018). The transition to Light-Emitting Diodes (LEDs) offers a sustainable solution, providing enhanced energy efficiency, durability, and operational benefits (Nardelli et al., 2017).

New Zealand has taken proactive steps toward adopting LED airfield lighting systems to reduce carbon emissions and operational costs, aligning with the country's environmental stewardship goals (McLachlan and Callister, 2022). However, implementing these systems presents challenges, including high initial costs, technical limitations, and the need to ensure safety during installation and maintenance (Budd et al., 2015). While the energy-efficiency benefits of LEDs are well understood, their broader impacts on safety remain underexamined. LED systems often require retrofitting, handling high-voltage equipment, or accessing elevated platforms, which may expose ground staff to additional risks, even as they reduce the overall frequency of maintenance. These trade-offs are especially relevant in New Zealand, where airports are increasingly aligning with national sustainability targets (McLachlan and Callister, 2022). However, safety protocols and implementation models vary widely.

Therefore, this study examines the intersection between sustainability and safety, recognising that infrastructure innovations affect both environmental outcomes and human working conditions. Understanding this interplay is crucial for ensuring that technological upgrades, such as LED lighting, not only contribute to greener aviation but also protect those responsible for maintaining such systems. Addressing these issues requires a comprehensive understanding of LED lighting's impact on sustainability and safety.

In this study, operational efficiency refers to the ability of lighting systems to minimise maintenance downtime and ensure consistent illumination. At the same time, environmental sustainability is defined as reduced energy consumption, lower greenhouse gas emissions, and the use of longer-lasting components that help reduce waste. This study focuses specifically on safety, such as the safe navigation of aircraft and allied personnel. This study aims to address the research question: What are the effects of LED airfield lighting on sustainability and safety on a global scale and in New Zealand?

To answer these questions, the study adopts a dual-method approach. A systematic literature review (SLR) is employed to investigate global evidence on the sustainability and safety implications of LED airfield lighting systems. To complement this, five semi-structured interviews were conducted with industry experts in New Zealand's aviation sector, providing practical insights into local implementation challenges, stakeholder concerns, and context-specific considerations. This combined methodology supports a systems-thinking analysis by integrating broad international perspectives with localised, real-world experience.

Airfield lighting systems ensure safe and efficient airport operations, particularly under low-visibility conditions. Research has consistently highlighted the benefits of transitioning to LED lighting technologies, which offer improved energy efficiency, longer lifespan, and reduced maintenance costs compared to traditional lighting systems (Bullough, 2012). The transition from incandescent and halogen lighting to LEDs represents a significant step toward achieving sustainability in aviation (Baxter, 2023). Oster et al. (2013) emphasised that dynamic changes and uncertainties are inherent in any operational environment, including aviation. While static conditions are often assumed when implementing new technologies, real-time events and challenges require adaptable solutions to avoid disruption. Similarly, McLachlan and Callister (2022) highlighted New Zealand's unique commitment to sustainable practices, focusing on LED systems to reduce carbon emissions and operational costs, but also noted that the associated capital and technical demands make widespread implementation difficult, especially for regional airports.

Advancements in airfield lighting technologies have been extensively documented globally. For example, research by Nardelli et al. (2017) demonstrated significant energy savings from LED systems and their contribution to reducing greenhouse gas emissions. Furthermore, integrating LED technologies with smart systems, such as IoT-enabled lighting control, has enhanced operational efficiency and safety standards (Göçmen, 2021). Despite the benefits, challenges remain. High initial installation costs and technical issues, such as power quality and inrush peak currents, are key barriers to widespread adoption (Davidovic and Kostic, 2022). Safety during installation and maintenance is another critical consideration, as these tasks often expose personnel to physical risks (Wingelaar-Jagt et al., 2021). Although LED systems reduce the frequency of maintenance interventions due to their extended lifespan, they may require more complex procedures involving specialised training or equipment (Budd et al., 2015).

This study identifies a gap in the literature concerning the long-term impacts of LED airfield lighting on safety and sustainability, and how such systems affect safety, particularly in terms of system design, maintenance demands, and workforce exposure to risk. Furthermore, to the best of our knowledge, no prior study has applied a systems-thinking approach to examine the interaction between sustainability and safety outcomes, especially in New Zealand. While global trends suggest a growing emphasis on sustainable aviation practices, New Zealand's experience highlights specific challenges and opportunities unique to its environmental and operational context.

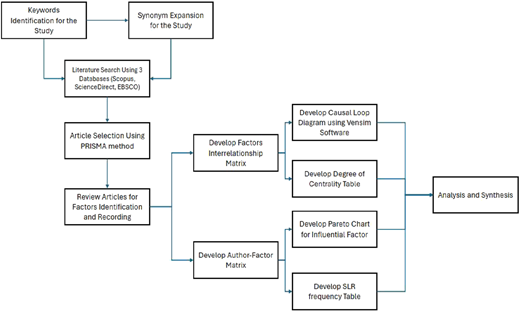
This qualitative study adopts a constructivist paradigm to explore the impacts of LED airfield lighting on sustainability and safety (Tracy, 2024). Two distinct data collection methods were employed: secondary data collection through a systematic literature review (SLR) and primary data collection through consultation interviews. A Systematic Literature Review (SLR) was conducted to identify and synthesise critical factors influencing LED lighting adoption in aviation. These findings were further prioritised using Pareto analysis to identify the most impactful variables and assess their centrality, evaluating their interconnectivity within the system. The resulting high-priority factors were modelled using a Causal Loop Diagram (CLD) to reveal dynamic feedback behaviours that are both reinforcing and balancing, governing systemic change. To ground this analysis in real-world contexts, semi-structured consultations were conducted with five industry experts, enabling the triangulation of findings and validation of system interdependencies. This combined approach, merging constructivist inquiry with systems modelling, ensures a holistic understanding of the technological, regulatory, and experiential dimensions that shape sustainable airfield lighting outcomes. Figure 1 shows the flowchart for the SLR Data Collection and Analysis Method.

The systematic literature review was conducted in accordance with the PRISMA guidelines for secondary data collection (Selçuk, 2019). The search strategy was applied across three major academic databases: Scopus, ScienceDirect, and EBSCO. Keywords included combinations of: “LED lighting”, “airport lighting”, “sustainability”, “energy efficiency”, and “safety”. Boolean operators were used to refine search strings and enhance relevance. The search strings are shown in Tables 1 and 2 shows the inclusion-exclusion criteria.

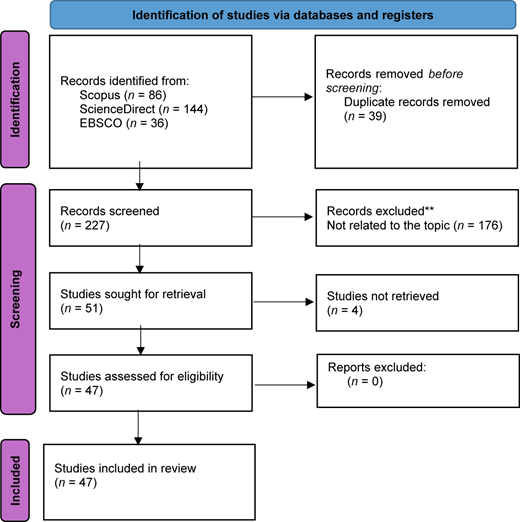
The systematic literature review followed the PRISMA (Preferred Reporting Items for Systematic Reviews and Meta-Analyses) approach. Figure 2 shows the Prisma framework. A total of 266 records were initially identified across three databases: Scopus (n = 86), ScienceDirect (n = 144), and EBSCO (n = 36). After screening, 47 studies were assessed as eligible and included in the final analysis. This selection process ensured the rigour and relevance of sources to identify critical factors influencing LED airfield lighting performance.

The selected studies were manually coded using an inductive thematic approach, which allowed key themes to emerge from the data itself. Coding focused on energy performance, sustainability drivers, safety concerns, and technological integration. The outcomes of this analysis served as the basis for developing a structured factor framework and guided the design of the interview questions used in the primary data collection. A three-stage analytical approach was adopted to evaluate key factors influencing LED airfield lighting. Pareto analysis was first used to identify the most frequently cited variables (Brooks, 2014), followed by the degree of centrality analysis to assess their systemic connectivity within the network (Ergün and Usluel, 2016). Finally, a causal loop diagram (CLD) was applied to visualise and interpret the dynamic interrelationships and feedback loops among factors, using a systems-thinking lens to explore the complexity of sustainability and safety impacts (Haraldsson, 2004).

For the primary data collection, five semi-structured interviews were conducted with industry experts in aviation infrastructure and airfield lighting. The participants were selected based on their experience in lighting design, safety management, and airport sustainability initiatives. Four industry experts had experience ranging from 6 to 10 years; one had 20 years. Of the five participants, four were based in New Zealand and one in Australia, enabling the study to incorporate both national and regional perspectives relevant to airport operations in the South Pacific. Participants were selected using purposive sampling, ensuring that each individual possessed practical experience or strategic involvement in the planning, implementation, or maintenance of LED airfield lighting systems.

The interview guide was structured around themes derived from the SLR coding to ensure continuity between the literature and practitioner insights. The same protocol and questions were used across consultations. The interviews were conducted remotely via Microsoft Teams, at the participant's preference. Each session lasted 30–45 min and followed a semi-structured format, enabling consistency across interviews while allowing flexibility for follow-up and clarification. Each industry expert was assigned a code: IE followed by the interview numbers 01–05. The interview transcript data were analysed using thematic analysis to extract recurring patterns, operational insights, and system-level concerns raised by practitioners. All interviews were audio-recorded with the participants' informed consent, and the recordings were subsequently transcribed manually to preserve the accuracy and context of the responses. An inductive thematic analysis approach was employed to analyse the transcripts. This process involved repeated reading, open coding, and theme refinement to allow patterns and insights to emerge from the data, rather than imposing predefined categories. The thematic analysis followed five steps: organising the transcripts, reading, compiling factors, analysing themes, and coding. The articles were reviewed at least twice. Relevant factors were identified during multiple readings, compiled, and similar items were merged. The research team collaboratively verified these factors, thereby extracting key themes. Themes and factors were discussed with other researchers to confirm their relevance. Finally, codes were assigned to the factors, comparing them to SLR-factors. Finally, the primary and secondary data outcomes were compared and contrasted to generate integrated insights. The factors that the industry experts agreed with the SLR findings were deemed validated. This triangulation process allowed the study to identify key leverage points in LED lighting systems that contribute to improved sustainability and safety outcomes.

The findings in this section are based on secondary data derived from a systematic literature review (SLR) and primary data from expert interviews. The results highlight key themes, factor frequency, structural positioning, and the integration of findings through triangulated methods.

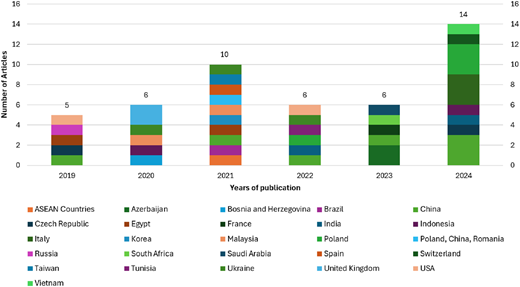
The selected literature spans a publication period from 2019 to 2024. As shown in Figure 3, the most articles were published in 2024, totalling 14 studies, reflecting an upward trend in scholarly attention to energy-efficient and safety-enhancing lighting systems in aviation. This surge may be attributed to increasing global pressure on transportation sectors to decarbonise and enhance operational efficiency post-pandemic. The second-highest number was recorded in 2021, with 10 studies, indicating a notable level of research activity even during the early recovery stages of the COVID-19 crisis.

In terms of geographical distribution, China and Poland emerged as the most frequently represented countries overall, particularly from 2022 to 2024. Their consistent presence across multiple years suggests ongoing national investments in LED research and infrastructure modernisation. Other prominent contributors include Malaysia, Vietnam, Italy, and the USA, reflecting both regional diversity and interdisciplinary interest. Notably, New Zealand is underrepresented in the global publication landscape, despite local efforts to adopt, reinforcing the need for region-specific insights. This study addresses this need by collecting primary data.

Additionally, contributions from developing and transitional economies, such as Indonesia, Tunisia, Azerbaijan, and Egypt, demonstrate growing global awareness of the sustainability and safety implications of airfield lighting upgrades. This international breadth provides a strong foundation for generalising the study's thematic findings while also highlighting the importance of contextual differentiation, particularly in infrastructure performance and policy adoption.

The 47 selected studies were manually coded using an inductive thematic approach, which allowed key themes to emerge from the data itself. Coding focused on energy performance, sustainability drivers, safety concerns, and technological integration. The outcomes of this analysis served as the basis for developing a structured factor framework and guided the design of the interview questions used in the primary data collection. From the 47 selected articles, 33 influencing factors were coded and grouped into eight thematic categories: Energy Efficiency (EE), Safety and Visual Performance (OS), Environmental Impact and Light Pollution (EI), Technological Integration (TI), Lighting Intensity and Robustness (IR), Cost Effectiveness (CE), Negative Impacts or Disadvantages (NI), and Safety Regulations and Compliance (SR). Each factor was assigned a code (e.g. EE-01, OS-01) for further structural and network analysis. Table 3 shows the theme, factors and codes.

An author-factor matrix was developed to quantify and visualise the connection between the reviewed literature and the extracted factors. Following Purushothaman et al. (2025), this matrix cross-referenced each article to the 33 identified factors, enabling a clearer understanding of how frequently and consistently each factor appeared across the literature. The author-factor matrix presents a comprehensive overview of how the 47 reviewed articles address the key sustainability and safety factors associated with LED airfield lighting. The matrix reveals a high level of attention to energy-related themes, with EE-01 (Energy Efficiency) and EE-02 (Reduction of Energy Consumption) being the most frequently cited themes in the majority of studies. This frequent mention supports their identification as the most critical factors in the systemic analysis. IR-02 (Durability of LED Lights) and IR-01 (High Performance Light Output) were also consistently addressed, particularly in engineering and infrastructure-focused research, highlighting their relevance to long-term system performance and operational safety.

In contrast, factors such as TI-01 (Smart Control and Adaptability) and IR-03 (Flexibility in Light Control) appeared less frequently across the literature. Although these were categorised as necessary rather than critical in the final factor framework, their lower frequency in existing studies suggests a potential research gap, especially in the context of advanced control systems and adaptive lighting strategies. CE-01 (Reduced Maintenance Costs) appeared in a moderate number of sources, often linked to discussions on extended LED lifespan and reduced labour demands.

Overall, the matrix reinforces the alignment between literature frequency and the systemic influence of the factors identified in this study. The consistent presence of the top-ranked factors across diverse sources strengthens the credibility of the factor prioritisation. It highlights the robust academic foundation supporting the system-level insights derived from expert consultation and causal loop analysis (see Table 4).

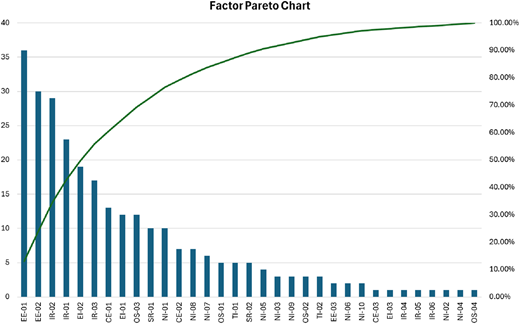
A Pareto analysis was developed from the Author-Factor Matrix to identify the most influential factors based on their frequency, as shown in Figure 4. This analysis enabled the identification of the relatively few factors that account for the majority of the system's perceived value or influence, in line with the classic 80/20 principle. The results present both the absolute frequency (bar chart) and cumulative percentage (line graph) of each factor's occurrence across the reviewed literature.

Based on the Pareto analysis results, seven key factors were identified as the most influential, contributing to over 60% of the cumulative percentage. These factors are categorised into three levels based on their impact. EE-01 (Energy Efficiency) is the most critical factor (Level 1), accounting for 13.04% of the total. EE-02 (Reduction of Power Consumption), IR-02 (Durability of LED Lights), and IR-01 (High-Performance Light Output) follow closely, forming the critical factors group (Level 2), with individual contributions ranging from 8.33% to 10.87%. Lastly, CE-01 (Reduced Maintenance Cost), TI-01 (Technological Integration), and IR-03 (Better Light Control) are considered important factors (Level 3), rounding out the top contributors that collectively account for over 60% of the system's influence. This structured grouping enables a focused approach to further analysis and strategic decision-making.

In contrast, factors such as TI-01 (Smart Control and Adaptability) and IR-03 (Flexibility in Light Control) appeared less frequently across the literature. Although these were categorised as necessary rather than critical in the final factor framework, their lower frequency in existing studies suggests a potential research gap, especially in the context of advanced control systems and adaptive lighting strategies. CE-01 (Reduced Maintenance Costs) appeared in a moderate number of sources, often linked to discussions on extended LED lifespan and reduced labour demands.

An interrelationship matrix was developed to systematically assess the influence of the 33 coded factors on one another within the LED airfield lighting system. Following Purushothaman et al. (2025), this matrix was based on directional influence scoring, a qualitative systems analysis method that identifies whether the relationship between two variables is positive (P), negative (N), or not applicable (NA). A positive relationship (P) indicates that an increase in one factor tends to reinforce or support the increase in the other. A negative relationship (N) suggests an inverse effect, while NA is used where no direct or known relationship exists. Table 5 below was generated to represent these connections, enabling deeper structural analysis in the subsequent section.

The matrix distinguishes between outgoing relationships (indicating a factor's influence on others—also known as “driving power”) and incoming relationships (the extent to which a factor is influenced by others—also known as “dependence”). This structural mapping enables a deeper understanding of the lighting system's systemic behaviour and lays the foundation for the centrality analysis in the next section.

The matrix results reveal that energy-related factors (such as EE-01 and EE-02) exert widespread influence across multiple categories, confirming their systemic importance beyond frequency alone. Factors related to robustness and safety, such as IR-02 (Durability) and OS-01 (Operational Safety), demonstrate strong interdependencies, particularly in their interactions with environmental, cost, and technological dimensions.

The interrelationship node analysis using the degree of centrality provides a quantitative view of how extensively each factor interacts within the system, highlighting its relative importance. To evaluate the structural importance of each factor within the LED airfield lighting system, a degree of centrality analysis was conducted based on the interrelationship matrix, following Samarasekara et al. (2025). The degree of centrality score for each factor was calculated by summing its total number of confirmed directional relationships, both outgoing (influencing other factors) and incoming (being influenced by others). For example, EE-01 (Energy Efficiency) was found to influence 11 factors and be influenced by another 9, resulting in a total of 20 interactions and a normalised centrality score of 1.00. Only relationships coded as either positive (P) or negative (N) were included; those marked not applicable (NA) were excluded from the count to maintain analytical rigour. This scoring method reflects not just thematic relevance but the structural role each factor plays in the feedback-rich dynamics of the system.

As shown in Table 6, EE-01 (Energy Efficiency) has the highest centrality score of 1.00, with 20 interactions, making it the network's most influential and interconnected factor. This dominance suggests that energy efficiency is a core benefit of LED systems and a driving force that shapes, and is shaped by, multiple other factors. It is followed by EE-02 (Reduction of Energy Consumption), with a centrality of 0.75, and IR-02 (Durability of LED Lights), with a centrality of 0.65, reflecting strong ties across the system. IR-01 (High-Performance Light Output) ranks fourth, emphasising its technical contribution to overall system performance.

Meanwhile, factors such as CE-01 (Reduced Maintenance Cost), TI-01 (Technological Integration), and IR-03 (Flexibility of Light Control) also demonstrate moderate centrality, underscoring their supportive yet still significant roles. The lower half of the table includes factors with limited connectivity, which may indicate more isolated impacts or niche concerns. This ranking helps identify leverage points where strategic improvements or interventions can have the broadest system-wide effects. The accompanying table provides the full ranking, reinforcing the insights derived from this centrality analysis regarding connectivity.

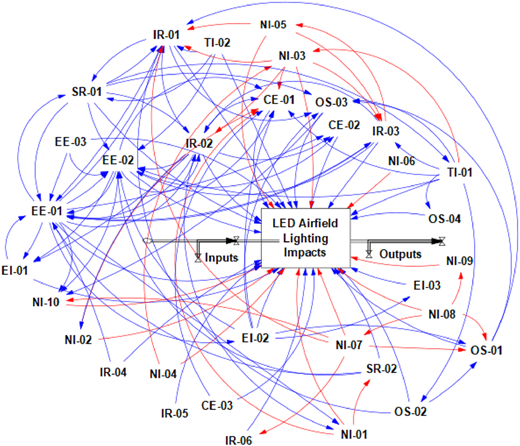
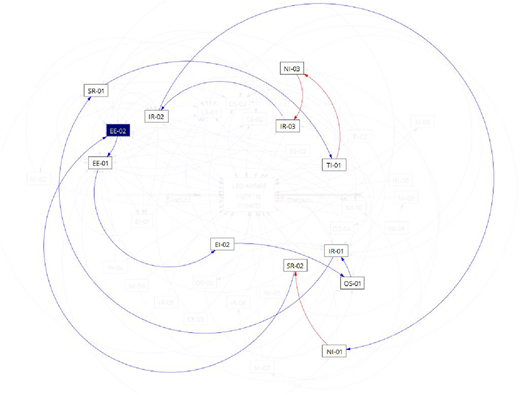
The Causal Loop Diagram (CLD) shown in Figure 5 was developed following Purushothaman and Aguas (2025), Purushothaman et al. (2025), using the interrelationship matrix and generated in Vensim software to illustrate the dynamic complexity of LED airfield lighting impacts. Each variable is connected through directional arrows that represent causal influences among system components. A positive causal link (blue arrow) denotes a direct relationship where an increase (or decrease) in one factor causes a corresponding directional change in the linked variable, thereby reinforcing the system. A negative causal link (red arrow) indicates an inverse relationship that contributes to system balancing by offsetting changes. These interconnected relationships form feedback loops, which are fundamental to understanding system behaviour. Reinforcing loops amplify change over time, potentially accelerating growth or decline, while balancing loops oppose change, promoting system stability and equilibrium. Together, they represent the non-linear, adaptive structure of sustainable infrastructure transitions.

To further quantify the influence of each factor on feedback behaviour, a loop analysis was conducted, with the results presented in Table 7. To deepen the understanding of systemic influence and prioritisation, a loop frequency analysis was performed to identify how often each variable appears within feedback loops. This informed the identification of high-leverage factors.

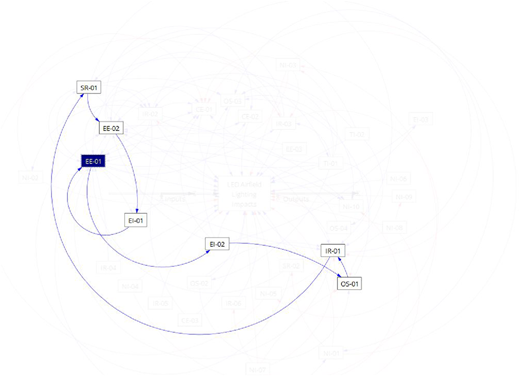
A key reinforcing loop in the system originates from EE-01 (Energy Efficiency) and follows the sequence: EE-01 → EI-02 → OS-01 → IR-01 → SR-01 → EE-02 → EI-01 → EE-01. In this positive feedback structure, increased energy efficiency (EE-01) enhances environmental sustainability (EI-02), as lower energy demand reduces emissions and the ecological footprint. Environmental gains contribute to improved OS-01 (Operational Safety), particularly in terms of visibility and reliability during airfield operations. Enhanced safety performance then strengthens IR-01 (Lighting Performance and Robustness), which reinforces system reliability under diverse operating conditions. As robustness improves, SR-01 (Safety Regulation Compliance) becomes easier to achieve, which, in turn, encourages EE-02 (Reduction of Energy Consumption). A lower energy profile further supports EI-01 (Sustainability Awareness and Perception), reinforcing organisational and public support for energy-efficient technologies. Finally, improved sustainability perception feeds back into EE-01 (Energy Efficiency), completing a self-reinforcing cycle. The absence of negative causal links within this loop categorises it as a reinforcing loop, meaning each improvement amplifies the next. This loop illustrates the positive compounding effects that can arise when technical performance, regulatory alignment, and sustainability objectives are mutually reinforcing—accelerating system-wide transformation in airfield lighting infrastructure. (see Figure 6 below).

A complex balancing loop (as shown in Figure 7) is initiated at EE-02 (Reduction of Energy Consumption) and propagates through a sequence of causally connected variables, forming a regulatory feedback cycle: EE-02 → EE-01 → EI-02 → OS-01 → IR-01 → SR-01 → TI-01 → NI-03 → IR-03 → IR-02 → NI-01 → SR-02 → EE-02. In this loop, reducing energy consumption enhances EE-01 (Energy Efficiency), which, in turn, positively influences EI-02 (Environmental Sustainability) by lowering emissions and reducing energy waste. Improved environmental performance strengthens OS-01 (Operational Safety Improvement) by providing more dependable, consistent lighting. This leads to improved IR-01 (Lighting Performance), which in turn fosters stronger SR-01 (Compliance with Safety Regulations) and supports the implementation of TI-01 (Smart Control Systems), marking a progressive phase in system development. However, the loop introduces balancing effects through three negative causal links. The adoption of intelligent systems (TI-01) exposes NI-03 (Technical Limitations), which diminishes IR-03 (Lighting Flexibility) and negatively affects IR-02 (Durability of LED Lights). This decline in durability triggers NI-01 (High Initial Investment Cost), further reducing SR-02 (Regulatory Incentives), and ultimately looping back to constrain EE-02. Despite initial advancements, these counteracting forces, technological inflexibility and financial strain, introduce self-regulation into the system, slowing further gains. The presence of this balancing loop reflects the non-linear complexity of LED airfield lighting transitions, revealing how seemingly positive embedded systemic constraints can moderate momentum. Such insights are critical for guiding strategic interventions that address bottlenecks and ensure sustained progress.

The inclusion of both loop types within the CLD illustrates the complex, non-linear nature of infrastructure transitions. By modelling both reinforcing and balancing behaviours, the diagram provides valuable insight into the leverage points, bottlenecks, and interdependencies shaping LED lighting implementation in airfield environments. These findings provide a systems-level perspective that extends beyond isolated technical benefits, enabling decision-makers to identify pathways toward more sustainable and resilient aviation infrastructure.

To complement the qualitative discussion of loop dynamics, a quantitative loop count was conducted using Vensim's loop analysis function. Table 8 below presents the total number of loops in which each factor participated, distinguishing between reinforcing and balancing loop types. This analysis highlights the systemic significance of each variable by revealing its centrality and behavioural tendency within the feedback architecture.

The causal loop analysis table highlights the relative influence of each factor within the system's feedback structure by quantifying its appearances in both reinforcing and balancing loops. EE-01 (Energy Efficiency) emerges as the most dominant factor, appearing in 263 loops, 207 of which are reinforcing, indicating its pivotal role in amplifying system-wide performance improvements. Similarly, SR-01 (Safety Regulation Compliance) and IR-02 (Durability of LED Lights) demonstrate strong reinforcing characteristics, underscoring the critical importance of regulatory alignment and technical robustness to sustain the benefits of LED lighting. Conversely, NI-01 (High Initial Investment Cost) and SR-02 (Regulatory Incentives) appear exclusively in balancing loops, each contributing to 75 balancing structures but participating in none of the reinforcing ones. This unique profile suggests that these two factors act as primary stabilisers in the system, introducing resistance to rapid transformation by constraining financial and policy-driven momentum. Their presence effectively tempers the reinforcing loops, ensuring that growth does not outpace feasibility or compliance, and underscores the need to address cost- and incentive-related barriers in future implementation strategies.

The Top 10 Factors Comparison in Table 8 summarises the most influential elements across three analytical dimensions—Degree of Centrality, Causal Loop Dominance, and SLR Frequency. This triangulated approach offers a multidimensional view of factor significance, highlighting not only frequently cited variables but also those that play pivotal roles within the system dynamics of LED airfield lighting.

EE-01 (Energy Efficiency) consistently ranks first across all three dimensions—centrality (1.00), loop frequency (263), and SLR frequency (36)—affirming its status as the system's most influential driver. EE-01 is directly linked to both environmental sustainability and economic viability, making it a foundational element in LED adoption pathways. EE-02 (Reduction of Energy Consumption) and IR-02 (Durability of LED Lights) also rank within the top three across loop participation and SLR frequency. EE-02 quantifies the energy-efficiency outcome, while IR-02 underpins long-term reliability and reduced maintenance frequency. Together, these factors form the core of sustainable lighting transitions' performance. IR-01 (High-Performance Light Output) and TI-01 (Smart Control and Adaptability) are highly relevant to the system. IR-01 supports safe aircraft operations under variable conditions, while TI-01 facilitates automation and adaptability. The relatively low SLR rank of TI-01 compared to its loop dominance suggests it is gaining traction in practice but is less explored in academic discourse.

SR-01 (Regulatory Compliance) is a notable outlier. Despite being second in loop participation (232), it ranks low in both centrality and literature frequency. This indicates its critical, often implicit, role in stabilising transitions through policy and procedural enforcement, especially in balancing feedback loops. CE-01 (Reduced Maintenance Costs) and IR-03 (Light Control Flexibility) are moderately ranked but highly valued by experts. CE-01 directly affects return-on-investment considerations, while IR-03 becomes vital during operational adjustments and adverse weather conditions. EI-02 (Environmental Friendliness) and NI-03 (Technical Limitations) illustrate differing dimensions of influence: the former is frequently cited in the literature but is systematically less dominant, while the latter participates in multiple loops despite limited academic visibility. Crucially, some factors emerged exclusively from only one analytical method. OS-01 (Operational Safety Improvement) appears solely in the centrality top 10 (rank 8), suggesting that practitioners recognise it as structurally significant, even if it is less central in the literature or in dynamic systems. Conversely, NI-01 (High Initial Cost) ranked 10th only in CLD frequency, indicating its role in system feedback loops, particularly as a financial barrier in balancing loops, yet not prominent in network connectivity or conceptual emphasis.

To further refine the prioritisation of impactful elements within the LED airfield lighting system, the top factors are categorised into three critical levels based on their cumulative influence across the Pareto analysis, Degree of Centrality, Causal Loop Analysis, and SLR frequency.

  1. At the most critical level (Level 1), EE-01 (Energy Efficiency) stands out distinctly. It ranks highest across all analytical dimensions and exhibits the strongest systemic connectivity and feedback participation. This suggests that enhancing energy efficiency is crucial to improving the overall performance, sustainability, and cost-effectiveness of airfield lighting systems.

  2. The critical level (Level 2) comprises EE-02 (Reduction of Energy Consumption), IR-02 (Durability of LED Lights), and IR-01 (High-Performance Light Output). These factors are consistently in the top quartile in each analysis. Their presence signifies that improving LED durability, optimising power usage, and achieving higher light performance are pivotal for long-term operational reliability and energy sustainability.

  3. Finally, the important level (Level 3) includes CE-01 (Reduced Maintenance Costs), TI-01 (Smart Control and Adaptability), and IR-03 (Flexibility of Light Control). While these do not dominate all rankings, they substantially influence system dynamics and the literature's relevance. Their inclusion supports cost reduction and adaptability through smart control, maintenance efficiency, and better operational lighting strategies.

This tiered categorisation helps guide targeted decision-making and informs the development of focused intervention strategies, ensuring that both core and supporting factors are addressed in system design and policy formulation.

To complement the findings of the systematic literature review and enhance system-level understanding, five semi-structured interviews were conducted with professionals actively involved in airfield lighting design, maintenance, and infrastructure projects, primarily within New Zealand and Australia. The interviews aimed to:

  1. Validate and triangulate the sustainability and safety factors identified in the literature,

  2. Uncover localised implementation challenges specific to the New Zealand context, and

  3. Inform the causal loop diagram (CLD) by mapping interdependencies and real-world feedback dynamics often absent from published research.

The interview protocol was thematically structured, derived from two primary research questions from the paper and the 33 influencing factors identified during the SLR's thematic coding stage. Each question was designed to explore practical relevance, implementation experience, systemic relationships, and evolving industry trends. The sample questions included:

  1. What are the effects of LED airfield lighting on sustainability and safety on a global scale?

  2. How does LED airfield lighting affect sustainability and safety in New Zealand?

  3. What do you think about the role of energy efficiency in adopting LED airfield lighting systems?

  4. What is your experience with smart technologies like IoT or AI being integrated with LED airfield lighting to improve operational efficiency?

  5. What are the negative impacts or disadvantages of LED airfield lighting based on your experience?

  6. What future trends do you foresee in adopting LED airfield lighting, and how can the aviation industry prepare for these advancements?

This ensured that expert feedback was both aligned with the research themes and rich in practical detail, providing insight into perceived trade-offs, system behaviour, and localised concerns.

4.9.1 Consensus and validation

All five experts consistently affirmed the sustainability benefits of LED airfield lighting, particularly in terms of energy and maintenance efficiency. Reported energy savings ranged from 60% to 70%, with the added benefit of reduced maintenance exposure and safer working conditions. One expert (IE-02) shared: “LED systems significantly reduce exposure to live runways and hazardous conditions for workers, as they require far less maintenance than traditional halogen lights.” Another commented (IE-05): “In Auckland Airport, we've seen major energy savings, but more importantly, our technicians aren't out there as often—less exposure means better safety”. These insights reinforced the systemic importance of factors such as EE-01 (Energy Efficiency), EE-02 (Reduction of Energy Consumption), and IR-02 (Durability), which ranked highest across all three analytical dimensions in the study.

4.9.2 Contradictions between literature and consultation insights

Notable divergences between academic discourse and practitioner experience also emerged. For instance, TI-01 (Smart Control and Adaptability) was described as an increasingly important consideration by several experts (IE-01, IE-02, IE-03): “Smart systems like adaptive brightness control and IoT-based monitoring are going to be game-changers—especially for larger airports with complex schedules.” However, such topics were comparatively underexplored in the academic literature. On the other hand, specific concerns, such as NI-09 (Sleep Cycle Disruption) and NI-10 (Skyglow Pollution), which were mentioned in global studies, were perceived by the interviewees as less relevant or outdated. As one (IE-04) noted, “We don't really deal with skyglow in our operational environment—it's just not a major issue here.”

4.9.3 Diverging perspectives among experts

While support for the LED transition was universal, differing views emerged on issues such as the adoption of AI-integrated systems. Experts (IE-01, IE-04) advocated for future-ready technologies, stating that “AI predictive maintenance will be essential in the next decade—it'll help us move from reactive to proactive models.” However, other (IE-03) expressed caution, citing cost and regional capability gaps: “You can't expect smaller airports with limited staff to suddenly jump into AI—it's still too complex and expensive.” Differences also appeared in perceptions of NI-08 (Blue-light and Glare Risks). While one expert (IE-04) dismissed it as minor—“it's all tunable now”—another (IE-02) stressed the need for improved regulation: “We need clearer standards on spectral output to avoid long-term exposure risks for workers”.

Overall, expert opinions strongly support the seven prioritised factors in this study: EE-01 (Level 1), EE-02, IR-02, IR-01 (Level 2), CE-01, TI-01, and IR-03 (Level 3). This underlines their practical relevance and alignment with real-world airport lighting operations and decision-making frameworks.

This section explores the top five prioritised factors identified through SLR frequency, degree of centrality, and causal loop analysis. Each subsection elaborates on the factor's importance, drawing on evidence from the literature and the practical implications discussed by the contributing authors.

Energy Efficiency (EE-01) was the most influential factor identified in this study, ranking highest in degree of centrality, number of causal loops, and literature frequency. Its dominant position reflects the critical role that energy efficiency plays in both the technical and strategic performance of airfield lighting systems. Airports operate in high-stakes environments where lighting systems must provide consistent illumination, often around the clock. Improving energy efficiency not only reduces operational energy demand but also supports long-term goals in cost reduction, carbon footprint mitigation, and infrastructure sustainability.

Industry feedback aligned closely with the literature. For instance, Pagden et al. (2020) found that LED lamps offer up to 5 times greater energy efficiency than traditional lighting, a finding echoed by several stakeholders who cited this improvement as a key driver of LED retrofits. Experts further highlighted the reliability of LEDs under varying temperatures—a point supported by Fryc et al. (2021), who noted performance gains in colder environments, typical in airports located in temperate or alpine regions. Dou et al. (2021) emphasised how energy policies in many countries accelerate LED adoption, a trend recognised by interviewees who mentioned regulatory pressure to reduce emissions and report environmental performance. Technological developments were also cited by both experts and authors, such as Lisovenko et al. (2020), who projected luminous efficiency reaching 150 lm/W. Similarly, Lv et al. (2024) observed that government-led transitions to LEDs reduce energy use in urban infrastructure, a trend now occurring in airport systems.

In the context of airfield lighting, energy efficiency serves as a foundational design goal rather than just a performance enhancement. From another perspective, its influence extends beyond power reduction, enabling better thermal management, longer component lifespans, and greater alignment with sustainability frameworks such as ICAO's environmental goals. As airfields face rising energy costs and increasing pressure to decarbonise, EE-01 becomes the most critical factor and a clear enabler of future-ready, resilient airport lighting infrastructure.

Reduction of Energy Consumption (EE-02) was identified as a Level 2 critical factor in this study, reflecting its strong systemic influence and practical relevance in airfield lighting operations. Although slightly lower in ranking than EE-01, this factor remains central to sustainability-driven decision-making, particularly in large-scale, high-demand infrastructure, such as airports. Expert interviews reinforced this importance, with multiple practitioners noting that reducing overall energy consumption is often the first justification for management when proposing a shift from conventional lighting to LEDs. Several experts also pointed out that energy consumption data is increasingly used in airport performance reports and environmental audits, directly tying this factor to cost management and compliance.

Azis (2021) emphasised that lighting contributes to nearly 20% of total electricity consumption in industrialised nations and that LED systems have become the most viable solution across all major applications. Mlynczak (2024) highlighted long-term financial savings resulting from reduced power use, which aligns with experts' feedback that energy savings are typically realised within the first few years of installation. In the aviation sector, Sreenath et al. (2021) noted that the adoption of LED technology has become standard practice among airports seeking to implement energy-saving initiatives. Goudjil et al. (2023) also recognised that LED lighting systems, when paired with intelligent control mechanisms, can significantly reduce building-level lighting loads—an approach that experts confirmed is gaining traction in newer airport terminal projects. Barbara et al. (2024) further noted that energy consumption reduction remains one of the most impactful strategies for lowering operational costs.

In the context of airfield lighting, reducing energy consumption is more than just an economic win. It enables excellent system stability, reduces thermal stress on components, and supports carbon-reduction targets. One expert noted that as electricity prices rise, even modest reductions in kilowatt-hour usage translate into substantial annual savings for airport authorities. From a systems perspective, EE-02 also contributes to positive feedback loops that affect budgeting, maintenance planning, and policy compliance. Therefore, reducing energy consumption is not merely an outcome of efficiency improvements; it is a core objective that strengthens the long-term viability of modern airfield lighting systems.

The durability of LED Lighting (IR-02) was categorised as a Level 2 factor in this study, reflecting its significant role in both the long-term reliability and cost-efficiency of airfield lighting systems. While energy-related factors, such as EE-01 and EE-02, take precedence in overall system impact, durability remains a significant concern for airport operators, especially those managing infrastructure exposed to continuous use, vibration, extreme weather, and stringent safety standards. Expert interviews underscored that durability is often cited as a key justification in procurement, with reduced maintenance as one of the most compelling outcomes of LED adoption. Several practitioners noted that frequent lamp failures in older systems used to disrupt airside operations, especially at night or during adverse weather, are issues that modern LED systems are actively helping to eliminate.

The literature strongly supports these insights. Chlebek (2019) highlighted the extended service life of LED lights compared to conventional systems. Bloudicek et al. (2024) emphasised that LED technology reduces energy usage by up to 80% and significantly improves the lifespan of airfield lighting fixtures. Ahmed et al. (2022) echoed this, noting that the long life span, high CRI, and tunable CCT make LEDs an ideal replacement for high-pressure sodium (HPS) lamps in demanding environments. Halima et al. (2022) further stated that the global rise of LED technology is primarily driven by its combined benefits of energy efficiency and long operating life. This view is echoed by Damerdash et al. (2021), who cited LEDs' superior lifetime as a primary reason for transitioning away from traditional lighting sources.

From a systems perspective, increased durability creates several reinforcing feedback loops in airfield operations. Fewer failures mean fewer emergency maintenance tasks, reduced labour costs, lower downtime, and improved safety, all of which feed back into smoother operations and more predictable budgeting. One airfield electrical supervisor interviewed mentioned that with older halogen or HPS lamps, teams were often dispatched weekly for replacements. In contrast, maintenance intervals have stretched to over a year with LEDs. This dramatic change has also made it easier for airports to comply with strict safety regulations without inflating operational expenditure. In this light, IR-02 is not just a technical benefit but a strategic asset that enhances the resilience and efficiency of airfield infrastructure over its lifecycle.

High-Performance Light Output (IR-01) was identified as a Level 2 factor in this study, highlighting its critical role in ensuring consistent visual performance across airfield lighting systems. In high-risk environments, such as runways and taxiways, even slight deviations in luminous output can compromise pilot visibility and operational safety. Experts interviewed for this research consistently emphasised the importance of stable, uniform illumination, especially during low-visibility conditions such as fog, rain, or nighttime landings. One airport lighting specialist noted that older systems often produced uneven brightness or gradual dimming over time, requiring frequent recalibration or manual inspections—challenges that LED upgrades have significantly reduced.

Academic literature supports these practical observations. Gerke (2019) noted that one of the key drivers behind LED adoption is its ability to feature functions such as dimming, directional control, and consistent output. Różowicz et al. (2022) highlighted technical strengths, including a high colour rendering index (CRI), a broad correlated colour temperature (CCT) range, and resistance to mechanical stress—all crucial for maintaining illumination stability in demanding environments, such as airfields. Velásquez et al. (2024) noted that LEDs not only improve energy performance but also enhance the quality and uniformity of light distribution. Valetti et al. (2023) observed that LED systems meet photometric performance standards while reducing over-illumination, thereby optimising lighting conditions. Collin et al. (2020) further highlighted the versatility of LED lighting across sectors, driven by its reliable control of light output and high-quality illumination.

From a systems dynamics viewpoint, luminous intensity stability contributes to smoother operations and reduced human intervention. Consistent light levels support safer aircraft movements, lower the risk of pilot misinterpretation, and minimise airside incidents. Moreover, the reduced need for visual inspections or manual adjustments leads to indirect savings in labour and operational planning. Experts also indicated that pilot feedback post-LED installation has been notably positive, with more apparent runway edges and better contrast perception. In this regard, IR-01 is not just about brightness; it is about delivering dependable, precise lighting that enhances safety and efficiency, making it a vital part of modern airfield lighting strategy.

While not ranked as highly as the core drivers, Level 3 factors—CE-01 (Reduction of Maintenance Costs), TI-01 (Smart Control and Adaptability), and IR-03 (Flexibility in Light Control) play important supporting roles in the overall optimisation of airfield lighting systems. These factors contribute indirectly to performance, sustainability, and operational resilience by enhancing system longevity, adaptability, and user control.

Both literature and expert interviews highlighted CE-01 as a practical outcome of LED implementation. Chao et al. (2021) noted that LED systems lower electricity costs and reduce carbon emissions, creating dual benefits. Ly Duc et al. (2024) emphasised that LED lifespans can reach 50,000 hours—dramatically longer than those of traditional lamps—leading to fewer replacements and reduced maintenance labour. This was echoed by Pagden et al. (2020), who stressed the cost-effectiveness of LEDs due to minimal maintenance requirements. Experts agreed that these savings accumulate over time and are often used to justify initial capital expenditures in airfield lighting upgrade proposals.

TI-01 reflects the growing need for dynamic lighting systems that adapt to operational demands. Experts have noted that modern runways benefit from adaptive controls that respond to changing weather conditions and flight schedules. Lisovenko et al. (2020) suggested that programmable electronic control of LED modules enables precise adjustment of lighting parameters, enhancing both safety and energy efficiency. Valetti et al. (2023) reinforced this by showing that advanced lighting controls improve overall sustainability when integrated with airport infrastructure. Although current airfields may not fully exploit these systems, expert feedback suggests a growing interest in smart lighting strategies, particularly in new terminals or airport expansions.

IR-03, meanwhile, addresses the flexibility and precision of LED light output. Experts emphasised the operational benefits of instant on/off functionality and precise brightness control, particularly during emergency or low-traffic conditions. Kvach (2022) outlined the advantages of LED, including vibration resistance, high colour rendering, and low power consumption. Ly Duc et al. (2024) described multiple dimming and control options, including remote programming and gradual brightness adjustment. These features enable lighting systems to respond flexibly to varying operational needs while supporting pilot visibility under different lighting scenarios.

These Level 3 factors collectively strengthen the broader value proposition of LED airfield lighting. While not as central as energy efficiency or durability, they enhance system adaptability, reduce lifecycle costs, and support the transition toward smarter, more resilient airport infrastructure. As technology matures and integrated systems become more common, these factors will likely increase influence and impact.

This study identified and evaluated the key factors influencing the sustainability and safety outcomes of LED airfield lighting using a combination of system dynamics, expert interviews, and a literature review. The most critical factor, EE-01: Energy Efficiency, directly addresses the first research question by demonstrating how LED systems reduce power demand while maintaining lighting performance, contributing to lower greenhouse gas emissions and aligning with global sustainability goals. Closely linked to EE-02, the reduction of Energy Consumption was found to further strengthen environmental outcomes, especially in large-scale airport operations, where lighting accounts for a substantial portion of energy use. These energy-focused factors also indirectly support safety by ensuring consistent illumination and reducing the risk of system failures.

The next tier of critical factors, such as IR-02: Durability of LED Lights and IR-01: High-Performance Light Output, underscores how LED lighting contributes to a safer working environment. Expert insights revealed that durability reduces the frequency of high-risk maintenance activities on runways and taxiways. At the same time, stable luminous intensity improves visual conditions for pilots and ground crews, minimising the chance of human error or visibility-related incidents. These findings address the research question, highlighting that transitioning to LED airfield lighting offers dual benefits: enhancing sustainability through reduced resource use and improving safety through technological reliability.

In addressing the second research question, expert feedback from New Zealand practitioners indicated that these global impacts are also evident locally. Airports nationwide have begun to realise the cost-saving and performance benefits of LED retrofits, particularly regarding reduced maintenance cycles and improved lighting quality in variable weather conditions. However, the pace of adoption of smart control and adaptability (TI-01) remains slower than that of global leaders, mainly due to regulatory and funding challenges. Nonetheless, the top-ranked factors in this study—especially energy efficiency, consumption reduction, and durability—have already started to reshape lighting strategies at New Zealand airports, supporting a long-term shift toward more sustainable and safer airfield operations.

This integrated understanding underscores the value of LED airfield lighting as both a technological upgrade and a systemic intervention for sustainable, safe airport infrastructure. The following section consolidates these findings and offers conclusions and recommendations.

While the prioritised factors in this study align with broader international literature, the expert interviews conducted within New Zealand reveal several contextual distinctions that inform both the interpretation and application of the findings. For example, energy efficiency (EE-01) and durability (IR-02) emerged as top priorities across both global and local domains. However, New Zealand experts placed particular emphasis on the practical benefits of reduced maintenance demands and enhanced system robustness, especially given the country's dispersed regional airport network and exposure to highly variable weather conditions. In contrast, technological integration (TI-01), including adaptive control systems and IoT-based lighting automation, has been widely discussed in the international literature as a future enabler of operational efficiency. Larger airports, such as Auckland Airport, state that LED lighting offers significant benefits (Airport, 2025a). However, in New Zealand, LED lighting uptake remains limited in smaller airports due to regulatory ambiguity, a lack of targeted incentives, and constrained capital investment. The review indicates that while the upfront investment in LED technology may be 30% higher than for traditional lighting, the long-term benefits yield substantial savings. Over a typical 10-year lifespan, airports can expect to reduce energy costs by approximately 26% and maintenance expenses by around 20%. However, the 2025 Auckland Airport states that 600 new LED runway lights were installed along the 3.6 km runway, using up to 70% less energy and lasting 15 times longer (75,000 h) than halogen lighting, with bulbs lasting longer (Airport, 2025a). The report claims this initiative will save a substantial cost, potentially thousands of dollars. Also, the LED initiative would support ongoing Auckland metrics, such as reductions in indirect Co2 emissions and in renewable and non-renewable energy (Airport, 2025b).

Furthermore, while international research increasingly focuses on carbon reporting, lifecycle emissions, and ESG metrics, New Zealand stakeholders tend to prioritise operational reliability, cost-effectiveness, and compliance with Civil Aviation Authority (CAA) standards. This divergence suggests that although the global drivers of LED lighting adoption are broadly relevant, the pathways, timelines, and implementation focus areas may differ considerably in the New Zealand context. These insights underscore the importance of recognising regional constraints and regulatory realities. By comparing global frameworks with local operational practices, this study enhances its utility for New Zealand airport authorities, policymakers, and engineering decision-makers, while reaffirming the universal value of the highest-ranked factors such as EE-01 and IR-02.

This research examined the systemic impacts of LED airfield lighting on sustainability and safety, with a specific focus on its relevance to New Zealand's aviation infrastructure. By integrating expert interviews, a systematic literature review, and systems thinking tools, including Pareto analysis, degree of centrality metrics, and causal loop diagrams, the study aimed to uncover how LED technology supports both environmental objectives and safe, efficient airport operations. Grounded in a constructivist methodology, the research prioritised the intersection between industry practice and academic insight.

The findings reveal that LED lighting serves a dual function: it significantly improves energy efficiency while enhancing visual reliability and operational safety in complex airfield environments. The most influential factors, including EE-01: Energy Efficiency, EE-02: Reduction of Energy Consumption, IR-02: Durability, IR-01: High-Performance Light Output, and CE-01: Reduction of Maintenance Costs, highlight the wide-ranging benefits of LED systems. These factors showed strong alignment between the global literature and expert perspectives, confirming that energy-focused improvements also yield secondary benefits, such as reduced maintenance exposure, fewer operational disruptions, and improved working conditions for airside personnel.

The study highlights important practical implications for airport managers and policymakers. For airport managers, prioritising the integration of LED lighting is crucial for sustainability efforts. This transition not only provides environmental benefits by reducing energy consumption and carbon emissions, but also offers economic advantages by lowering electricity costs. Additionally, LED lighting improves visibility and operational efficiency while reducing the need for frequent maintenance, thereby minimising potential safety risks. Further, the implementation of smart lighting control systems can enhance airport operations. These systems enable better lighting management based on real-time conditions, improving safety for both passengers and staff. Overall, focusing on these strategies can significantly enhance the functionality and sustainability of airport environments.

For policymakers, the findings underscore the critical need to promote LED adoption actively through targeted strategies. This includes offering targeted financial incentives to encourage organisations to switch to LED lighting, establishing formal technical standards to ensure quality and safety, and developing comprehensive regulatory frameworks to support these initiatives. This approach is critical in regions like New Zealand, where there is a strong emphasis on achieving national sustainability goals alongside infrastructure upgrades. By backing these measures, policymakers can help airports enhance their operational efficiency and environmental responsibility, thereby playing a significant role in meeting broader ecological objectives.

The study also presents important theoretical implications that contribute to the existing body of knowledge on sustainable airport management and technology adoption. Firstly, it reinforces the concept of sustainable innovation by demonstrating how the factors and their interrelationships affect LED lighting and smart control systems, which can serve as a model for other industries seeking to enhance their environmental performance. This aligns with theories of technological diffusion, emphasising the role of emerging technologies in promoting sustainability. Additionally, the findings contribute to the broader understanding of factors affecting LED lighting in airport operations. They highlight the interconnectedness of factors and illustrate how they affect technology adoption. Solving them can lead to shared benefits.

The study acknowledges certain limitations. The literature review was restricted to English-language publications from 2019 to 2024, potentially excluding earlier or regional contributions. While rich in practical insight, the expert sample was limited in scale and geographic diversity. Moreover, while the structural analysis helped clarify relationships among influencing factors, further research using real-time data, simulation models, or comparative airport case studies would offer more profound validation.

In summary, LED airfield lighting offers a robust, multidimensional opportunity to advance sustainable, safe airport development. Future research should investigate life-cycle impacts, recycling and disposal practices, and policy integration to inform evidence-based decision-making across both developed and emerging aviation markets.

Appreciation is extended to the five industry professionals who generously contributed their time and insights through semi-structured interviews. Vensim software, MS Office, and Grammarly (for language, spelling, and sentence structure – for language refinement and formatting assistance only) were used in the article. Analytical and interpretive content developed solely by authors. This study involved voluntary interviews with five professionals from the construction industry. All participants voluntarily participated and provided informed consent for data collection, and no personal or identifying information was collected or included in the analysis. According to the XXX University's ethical review policy (exemption policy 6.7), this type of research was exempt from requiring formal ethics approval.
Ahmed
,
T.
,
Khalid
,
W.
and
Aslam
,
A.
(
2022
), “
Energy conservation potential in highway illumination system: a Techno-Enviro-Economic study on retrofitting HPS with LED luminaires
”,
Energy and Environment
, Vol. 
33
No. 
3
, pp. 
599
-
613
, doi: .
Airport
,
A.
(
2025a
), “
Annual report 2025
”,
available at:
 https://www.aucklandairport.co.nz/content/dam/aia/files/corporate/annual-report-2025/2025%20Annual%20Report.pdf (
accessed
 18 November 2025).
Airport
,
A.
(
2025b
), “
ESG metrics
”,
available at:
 https://www.aucklandairport.co.nz/content/dam/aia/files/corporate/sustainability/FY25%20AKL%20ESG%20databook.xlsx (
accessed
 18 November 2025).
An
,
H.
,
Wang
,
Y.
,
Wang
,
Y.
,
Liu
,
J.
,
Tang
,
X.
and
Yi
,
H.
(
2025
), “
Civil aviation emissions in China in 2019: characteristics and abatement potential
”,
Journal of Environmental Sciences
, Vol. 
151
, pp. 
225
-
237
, doi: .
Azis
,
S.S.A.
(
2021
), “
Improving present-day energy savings among green building sector in Malaysia using benefit transfer approach: cooling and lighting loads
”,
Renewable and Sustainable Energy Reviews
, Vol. 
137
, 110570, doi: .
Baghirov
,
S.
(
2023
), “
Study of energy efficiency indicators of led light sources
”,
International Journal on “Technical and Physical Problems of Engineering” (IJTPE)
, Vol. 
15
No. 
77
, p.
4
,
available at:
 https://www.researchgate.net/profile/Sabir-Baghirov-2/publication/396832974_STUDY_OF_ENERGY_EFFICIENCY_INDICATORS_OF_LED_LIGHT_SOURCES/links/68fa8ab0e7f5f867e6e1ed1c/STUDY-OF-ENERGY-EFFICIENCY-INDICATORS-OF-LED-LIGHT-SOURCES.pdf
Baghirov
,
S.
and
Baghirova
,
S.
(
2023
), “
Research on influence of radiation from LED light sources
”,
International Journal on Technical and Physical Problems of Engineering (IJTPE)
, No. 
55
, pp. 
335
-
339
,
available at:
 https://www.researchgate.net/profile/Sabir-Baghirov-2/publication/396842121_RESEARCH_ON_INFLUENCE_OF_RADIATION_FROM_LED_LIGHT_SOURCES/links/68fa88127d9a4d4e870bf990/RESEARCH-ON-INFLUENCE-OF-RADIATION-FROM-LED-LIGHT-SOURCES.pdf
Barbara
,
C.E.
,
Adamo
,
I.D.
,
Gastaldi
,
M.
and
Nizami
,
A.S.
(
2024
), “
Clean energy for a sustainable future: analysis of a PV system and LED bulbs in a hotel
”,
Energy
, Vol. 
299
, 131547, doi: .
Barwar
,
M.K.
,
Sahu
,
L.K.
and
Bhatnagar
,
P.
(
2022
), “
Reliability analysis of flicker-free LED driver based on five-level rectifier
”,
Optik
, Vol. 
268
, 169762, doi: .
Baxter
,
G.
(
2023
), “
An assessment of sustainable energy management at a major United Kingdom based hub airport: a case study of London gatwick airport
”,
International Journal of Environment, Agriculture and Biotechnology
, Vol. 
8
No. 
2
, pp. 
001
-
023
, doi: .
Baxter
,
G.
,
Srisaeng
,
P.
and
Wild
,
G.
(
2018
), “
An assessment of airport sustainability, part 2-Energy management at Copenhagen Airport
”,
Resources
, Vol. 
7
No. 
2
, 32, doi: .
Bloudicek
,
R.
,
Perina
,
S.
,
Rydlo
,
S.
and
Makula
,
P.
(
2024
), “
Degradation of photometric characteristics of phosphor layers in LED based airfield lights
”,
2024 AIAA DATC/IEEE 43rd Digital Avionics Systems Conference (DASC)
, pp. 
1
-
7
, doi: .
Brooks
,
C.
(
2014
), “
What is a pareto analysis
”,
Business News Daily Senior
, Vol. 
29
No. 
1
, pp. 
1
-
5
,
available at:
 https://www.burkeadvisory.com/wp-content/uploads/2018/07/What-Is-a-Pareto-Analysis.pdf
Budd
,
T.
,
Budd
,
L.
and
Ison
,
S.
(
2015
), “
Environmentally sustainable practices at UK airports
”,
Proceedings - Institution of Civil Engineers: Transport
, Vol. 
168
No. 
2
, pp. 
116
-
123
, doi: .
Bullough
,
J.D.
(
2012
), “
Issues with use of airfield LED light fixtures
”,
Transportation Research Board
, Vol. 
35
, doi: .
Bullough
,
J.D.
(
2017
), “
Human factors impacts of light-emitting diode airfield lighting
”,
Transportation Research Record
, Vol. 
2626
No. 
1
, pp. 
51
-
57
, doi: .
Chao
,
C.C.
,
Chen
,
H.T.
and
Tsai
,
Y.S.
(
2021
), “
Cost assessment model of airport runway lighting systems with consideration on carbon emissions
”,
Journal of Aeronautics, Astronautics and Aviation
, Vol. 
53
No. 
1
, pp. 
67
-
82
, doi: .
Chlebek
,
J.
(
2019
), “
Runway lighting systems as a key tool to extend operational capabilities of VFR airports
”,
Transportation Research Procedia
, Vol. 
43
, pp. 
236
-
242
, doi: .
Collin
,
A.J.
,
Djokic
,
S.Z.
,
Drapela
,
J.
,
Guo
,
Z.
,
Langella
,
R.
,
Testa
,
A.
and
Watson
,
N.R.
(
2020
), “
Analysis of approaches for modeling the low frequency emission of LED lamps
”,
Energies
, Vol. 
13
No. 
7
, 1571, doi: .
Cumo
,
F.
,
Pennacchia
,
E.
and
Sferra
,
A.S.
(
2025
), “
Sustainability in public lighting: the methodology for identifying environmentally optimal solutions in replacement planning—a case study
”,
Energies
, Vol. 
18
No. 
3
, p.
535
, doi: ,
available at:
 https://www.mdpi.com/1996-1073/18/3/535
Damerdash
,
A.M.
,
Abdelhameed
,
D.
,
Aly
,
M.
,
Ahmed
,
E.M.
and
Ahmed
,
M.A.
(
2021
), “
Energy efficiency assessment of power electronic drivers and LED lamps in Li-Fi communication systems
”,
Energy Reports
, Vol. 
7
, pp. 
7648
-
7662
, doi: .
Dang
,
S.
,
Tian
,
Y.
,
Almahfoudh
,
H.H.
,
Song
,
H.
,
Bakr
,
O.M.
,
Ooi
,
B.S.
and
Gan
,
Q.
(
2023
), “
Ground-facing radiative cooling for high power LED lights
”,
Next Energy
, Vol. 
1
No. 
4
, 100069, doi: .
Davidovic
,
M.
and
Kostic
,
M.
(
2022
), “
Comparison of energy efficiency and costs related to conventional and LED road lighting installations
”,
Energy
, Vol. 
254
, 124299, doi: .
De Oliveira
,
R.P.
,
Benvenuti
,
J.
and
Espinosa
,
D.C.R.
(
2021
), “
A review of the current progress in recycling technologies for gallium and rare earth elements from light-emitting diodes
”,
Renewable and Sustainable Energy Reviews
, Vol. 
145
, 111090, doi: .
Dou
,
J.
,
Ma
,
H.
,
Yang
,
J.
,
Zhang
,
Y.
and
Guo
,
R.
(
2021
), “
An improved power quality evaluation for LED lamp based on G1-entropy method
”,
IEEE Access
, Vol. 
9
, pp. 
111171
-
111180
, 9508412, doi:
Ergün
,
E.
and
Usluel
,
Y.K.
(
2016
), “
An analysis of density and degree-centrality according to the social networking structure formed in an online learning environment
”,
Journal of Educational Technology and Society
, Vol. 
19
No. 
4
, pp. 
34
-
46
,
available at:
 https://www.researchgate.net/profile/Esin-Erguen/publication/311670276_An_analysis_of_density_and_degree-centrality_according_to_the_social_networking_structure_formed_in_an_online_learning_environment/links/5f61f24aa6fdcc116415d417/An-analysis-of-density-and-degree-centrality-according-to-the-social-networking-structure-formed-in-an-online-learning-environment.pdf
Fryc
,
I.
,
Czyżewski
,
D.
,
Fan
,
J.
and
Gălăţanu
,
C.D.
(
2021
), “
The drive towards optimization of road lighting energy consumption based on mesopic vision—a suburban street case study
”,
Energies
, Vol. 
14
No. 
4
, 1175, doi: .
Fryc
,
I.
,
Listowski
,
M.
,
Martinsons
,
C.
,
Fan
,
J.
and
Czyżewski
,
D.
(
2024
), “
A paradox of LED road lighting: reducing light pollution is not always linked to energy savings
”,
Energies
, Vol. 
17
No. 
22
,
5727
, doi: ,
available at:
 https://www.mdpi.com/1996-1073/17/22/5727
Gao
,
Y.
,
d'Adda
,
G.
and
Tavoni
,
M.
(
2019
), “
Adopting LEDs changes attitudes towards climate change: experimental evidence from China
”,
Environmental Research Letters
, Vol. 
14
No. 
8
, 084018, doi: .
Gerke
,
B.F.
(
2019
), “Light-emitting diode lighting products. In technological Learning in the Transition to a low-carbon energy system: conceptual issues, empirical findings, and use”, in
Energy Modeling
, pp. 
233
-
256
, doi: .
Göçmen
,
E.
(
2021
), “
Smart airport: evaluation of performance standards and technologies for a smart logistics zone
”,
Transportation Research Record
, Vol. 
2675
No. 
7
, pp. 
480
-
490
, doi: .
Goudjil
,
A.
,
Pigeon
,
E.
,
Pouliquen
,
M.
,
Menard
,
T.
,
Gehan
,
O.
,
Girard
,
S.
,
Dufay
,
B.
and
Boudjelal
,
A.
(
2023
), “
An interior-points algorithm for color and CCT control of multichannel LED lighting system using a Smart 18-Channel Spectral Sensor
”,
Energy and Buildings
, Vol. 
298
, 113541, doi: .
Halima
,
A.B.
,
Araoud
,
Z.
,
Canale
,
L.
,
Charrada
,
K.
and
Zissis
,
G.
(
2022
), “
Energy efficiency of a LED lighting system using a Peltier module thermal converter
”,
Case Studies in Thermal Engineering
, Vol. 
34
, 101989, doi: .
Haraldsson
,
H.V.
(
2004
),
Introduction to System Thinking and Causal Loop Diagrams. Department of Chemical Engineering
,
Lund University
,
Lund, Sweden
,
available at:
 https://www.researchgate.net/profile/Hoerdur-Haraldsson/publication/258261003_Introduction_to_system_thinking_and_causal_loop_diagrams/links/5bcceed6458515f7d9d01e81/Introduction-to-system-thinking-and-causal-loop-diagrams.pdf
Keerthana
,
S.
and
Indumathi
,
G.
(
2025
), “
Revolutionizing interior Spaces: a comprehensive analysis of LED lighting for illumination and communication in modern Architecture
”,
Energy and Buildings
, Vol. 
331
, 115297, doi: .
Khan
,
M.F.
,
Reddy
,
S.
and
Swanson
,
A.G.
(
2023
), “
The performance and impact of LED floodlights in an outdoor electrical substation during misty weather conditions
”,
2023 IEEE Sustainable Smart Lighting World Conference and Expo (LS18)
, pp. 
1
-
6
,
available at:
 https://10.1109/LS1858153.2023.10170044
Kim
,
J.
,
Kang
,
J.
and
Jang
,
W.
(
2021
), “
Analysis on high-power seaport LED luminaire with uniform light distribution based on optimized lens and heatsink
”,
Applied Sciences
, Vol. 
11
No. 
9
,
4035
, doi: ,
available at:
 https://www.mdpi.com/2076-3417/11/9/4035
Kvach
,
Y.
(
2021
), “
Modeling of secondary optics LED aerodrome fires
”,
2021 International Conference on Numerical Simulation of Optoelectronic Devices (NUSOD)
, pp. 
71
-
72
,
available at:
 https://10.1109/NUSOD52207.2021.9541481
Kvach, Y.
(
2022
), “
Observations of LED side lights at the stage of visual piloting [conference paper]
”,
Lecture Notes in Mechanical Engineering
, pp. 1-13, ISSN 2195-4356 ISSN 2195-4364 (electronic), ISBN 978-3-030-85056-2 ISBN 978-3-030-85057-9 (eBook), doi: .
Li
,
T.
,
Liu
,
A.
,
Li
,
Y.
and
Zhang
,
J.
(
2024
), “
Research on the construction of low-current Airfield Groud Lighting system for civil airports in China
”,
Journal of Physics: Conference Series
, Vol. 
2840
No. 
1
, 012029, doi: .
Lisovenko
,
V.
,
Lisovenko
,
D.V.
,
Bazik
,
O.
,
Shmelev
,
Y.
and
Byłeń
,
S.
(
2020
), “
Electronic control of local uniformity of illuminance from power LED
”,
Systemy Logistyczne Wojsk
, Vol. 
52
No. 
1
, pp. 
115
-
124
, doi: .
Liu
,
J.
,
Guan
,
M.
,
Yang
,
H.
,
Chen
,
W.
,
Niu
,
H.
and
Fu
,
Q.
(
2023
), “
Airfield lighting management system development based on digital twin technology
”,
2023 IEEE 5th International Conference on Civil Aviation Safety and Information Technology (ICCASIT)
, pp. 
533
-
539
,
available at:
 https://10.1109/ICCASIT58768.2023.10351572
Lv
,
Z.
,
Guo
,
H.
,
Zhang
,
L.
,
Liang
,
D.
,
Zhu
,
Q.
,
Liu
,
X.
,
Zhou
,
H.
,
Liu
,
Y.
,
Gou
,
Y.
,
Dou
,
X.
and
Chen
,
G.
(
2024
), “
Urban public lighting classification method and analysis of energy and environmental effects based on SDGSAT-1 glimmer imager data
”,
Applied Energy
, Vol. 
355
, 122355, doi: .
Ly Duc
,
M.
,
Bilik
,
P.
and
Martinek
,
R.
(
2024
), “
Hybrid six sigma based on recursive kalman filter and weibull distribution to estimate the lifespan of Bulb LEDs
”,
Results in Engineering
, Vol. 
23
, 102633, doi: .
McLachlan
,
R.I.
and
Callister
,
P.
(
2022
), “
Managing New Zealand's greenhouse gas emissions from aviation
”,
Victoria University of Wellington Institute for Governance and Policy Studies
, Vol. 
54
No. 
4
, pp. 
412
-
432
, doi: .
Mlynczak
,
J.
(
2024
), “
Measuring the low divergent luminous flux emitted by LED torch lamps using a simple detector and a spectrometer as an alternative to an integrating sphere
”,
Measurement
, Vol. 
241
, 115725, doi: .
Nardelli
,
A.
,
Deuschle
,
E.
,
Azevedo
,
L. D.d.
,
Pessoa
,
J.L.N.
and
Ghisi
,
E.
(
2017
), “
Assessment of light emitting diodes technology for general lighting: a critical review
”,
Renewable and Sustainable Energy Reviews
, Vol. 
75
, pp. 
368
-
379
, doi: .
Nazir
,
R.
,
Akbar
,
F.
,
Malik
,
H.
,
Saputra
,
D.A.
and
Muharram
,
I.C.
(
2025
), “
Analysis of the effect of environmental conditions on energy savings in lighting systems with dimming method in campus buildings
”,
International Journal of Power Electronics and Drive Systems
, Vol. 
16
No. 
1
, pp. 
657
-
672
, doi: .
Omran
,
M.M.
,
Aziz
,
V.
and
Youssef
,
K.
(
2019
), “
Energy efficient lighting system
”,
2019 21st International Middle East Power Systems Conference (MEPCON)
, pp. 
307
-
310
,
available at:
 https://10.1109/MEPCON47431.2019.9008179
Oster
,
C.V.
,
Strong
,
J.S.
and
Zorn
,
C.K.
(
2013
), “
Analyzing aviation safety: problems, challenges, opportunities
”,
Research in Transportation Economics
, Vol. 
43
No. 
1
, pp. 
148
-
164
, doi: .
Pagden
,
M.
,
Ngahane
,
K.
and
Amin
,
M.S.R.
(
2020
), “
Changing the colour of night on urban streets - LED vs. part-night lighting system
”,
Socio-Economic Planning Sciences
, Vol. 
69
, 100692, doi: .
Purushothaman
,
M.B.
and
Aguas
,
A.B.
(
2025
), “
Cognitive biases that shape the drivers and barriers to embracing green construction practices
”,
Smart and Sustainable Built Environment
, Vol.
ahead-of-print No. ahead-of-print
, doi: .
Purushothaman
,
M.B.
,
Elenzano
,
D.
,
GhaffarianHoseini
,
A.
and
Ghaffarianhoseini
,
A.
(
2025
), “
Dynamic scheduling: influential and influenced factors and their interrelationships in the New Zealand construction industry
”,
Smart and Sustainable Built Environment
, Vol. 
ahead-of-print
 
No. ahead-of-print
, doi: .
Ramljak
,
I.
and
Tokić
,
A.
(
2020
), “
Harmonic emission of LED lighting
”,
AIMS Energy
, Vol. 
8
No. 
1
, pp.
1
-
26
, doi: .
Różowicz
,
A.
,
Wachta
,
H.
,
Baran
,
K.
,
Leśko
,
M.
and
Różowicz
,
S.
(
2022
), “
Arrangement of LEDs and their impact on thermal operating conditions in high-power luminaires
”,
Energies
, Vol. 
15
No. 
21
, 8142, doi: .
Samarasekara
,
H.M.S.N.
,
Purushothaman
,
M.B.
,
Rotimi
,
F.E.
and
Ghaffarian Hoseini
,
A.
(
2025
), “
A system dynamics framework for whole life costing in seismic and climate-sensitive residential construction in New Zealand
”,
Smart and Sustainable Built Environment
, Vol. 
ahead-of-print
 
No. ahead-of-print
, pp.
1
-
52
, doi: .
Sánchez-Balvás
,
L.A.
,
de Felipe
,
J.J.
,
Quintero
,
J.M.
and
de la Fuente
,
A.
(
2021
), “
An energy efficiency-based classification approach for street lighting by considering operational factors: a case study of Barcelona
”,
Energy Efficiency
, Vol. 
14
No. 
1
, p.
15
, doi: .
Selçuk
,
A.A.
(
2019
), “
A guide for systematic reviews: PRISMA
”,
Turkish Archives of Otolaryngology
, Vol. 
57
No. 
1
, pp. 
57
-
58
, doi: .
Skarżyński
,
K.
and
Wiśniewski
,
A.
(
2024
), “
The reflections on energy costs and efficacy problems of modern LED lamps
”,
Energy Reports
, Vol. 
12
, pp. 
4926
-
4937
, doi: .
Sreenath
,
S.
,
Sudhakar
,
K.
and
Yusop
,
A.F.
(
2021
), “
Sustainability at airports: technologies and best practices from ASEAN countries
”,
Journal of Environmental Management
, Vol. 
299
, 113639, doi: .
Sudjoko
,
R.I.
,
Hartono
,
Hariyadi
,
S.
and
Suwito
(
2021
), “
Design and simulation of airfield lighting system using 8 luminaire in airfield lighting laboratory at politeknik penerbangan surabaya
”,
Journal of Physics: Conference Series
, Vol. 
1845
No. 
1
, 012034, doi: .
Tai
,
H.-D.
,
Wang
,
Y.
,
Chan
,
P.-W.
,
Zhuang
,
Z.-B.
,
Wang
,
W.-H.
and
Liu
,
H.-W.
(
2025
), “
Nighttime measurement errors in the runway visual range and optimization of runway lighting systems
”,
Lighting Research and Technology
, Vol. 
57
No. 
3
, pp. 
278
-
291
, doi: .
Taylor
,
J.
and
Freyssinier
,
J.P.
(
2022
), “
Research: improving airport safety: new research on drone-based photometry
”,
Lighting Design + Application
, Vol. 
52
No. 
5
, pp. 
54
-
56
, doi: .
Valetti
,
L.
,
Piccablotto
,
G.
,
Taraglio
,
R.
and
Pellegrino
,
A.
(
2023
), “
Long-term monitoring campaign of LED street lighting systems: focus on photometric performances, maintenance and energy savings
”,
Sustainability
, Vol. 
15
No. 
24
, 16910, doi: .
Velásquez
,
C.
,
Espín
,
F.
,
Castro
,
M.Á.
and
Rodríguez
,
F.
(
2024
), “
Energy efficiency in public lighting systems friendly to the environment and protected areas
”,
Sustainability
, Vol. 
16
No. 
12
, 5113, doi: .
Vorozhikhin
,
V.V.
,
Moreva
,
E.L.
,
Starovoytov
,
V.G.
and
Tyutyunnik
,
I.G.
(
2019
), “
Possibility of using in Russia the experience of LED lighting application at the USA airfields
”,
Light Engineering
, Vol. 
27
No. 
2
, pp. 
71
-
77
, doi: .
Wagiman
,
K.R.
,
Abdullah
,
M.N.
,
Hassan
,
M.Y.
,
Mohammad Radzi
,
N.H.
,
Abu Bakar
,
A.H.
and
Kwang
,
T.C.
(
2020
), “
Lighting system control techniques in commercial buildings: current trends and future directions
”,
Journal of Building Engineering
, Vol. 
31
, 101342, doi: .
Wingelaar-Jagt
,
Y.Q.
,
Wingelaar
,
T.T.
,
Riedel
,
W.J.
and
Ramaekers
,
J.G.
(
2021
), “
Fatigue in aviation: safety risks, preventive strategies and pharmacological interventions
”,
Frontiers in Physiology
, Vol. 
12
, 712628, doi: .
Published by Emerald Publishing Limited. This article is published under the Creative Commons Attribution (CC BY 4.0) licence. Anyone may reproduce, distribute, translate and create derivative works of this article (for both commercial and non-commercial purposes), subject to full attribution to the original publication and authors. The full terms of this licence may be seen at http://creativecommons.org/licences/by/4.0/legalcode

Data & Figures

Figure 1
A flowchart illustrates the research methodology used for factor identification, analysis, and synthesis.The process flows primarily from left to right with connecting arrows between rectangular boxes. At the top left, a box labeled “Keywords Identification for the Study” connects to a box on the right labeled “Synonym Expansion for the Study”. From the synonym expansion box, a downward arrow leads to a box labeled “Literature Search Using 3 Databases (Scopus, ScienceDirect, E B S C O)”. An arrow from “Keywords Identification for the Study” also leads to the literature search box. From the literature search box, a downward arrow leads to “Article Selection Using PRISMA method”. This box connects downward to “Review Articles for Factors Identification and Recording”. From this review box, two parallel paths extend to the right. The upper path leads to a box labeled “Develop Factors Interrelationship Matrix”. The lower path leads to a box labeled “Develop Author-Factor Matrix”. From the “Develop Factors Interrelationship Matrix” box, two boxes branch to the right in a vertical sequence: “Develop Causal Loop Diagram using Vensim Software” and “Develop Degree of Centrality Table”. From the “Develop Author-Factor Matrix” box, two boxes branch to the right in a vertical sequence: “Develop Pareto Chart for Influential Factor” and “Develop S L R frequency Table”. All four boxes on the right side, causal loop diagram, degree of centrality table, Pareto chart, and S L R frequency table, connect via arrows to a final box on the far right labeled “Analysis and Synthesis”.

Flowchart for SLR data collection and analysis method. Source: Authors’ own work

Figure 1
A flowchart illustrates the research methodology used for factor identification, analysis, and synthesis.The process flows primarily from left to right with connecting arrows between rectangular boxes. At the top left, a box labeled “Keywords Identification for the Study” connects to a box on the right labeled “Synonym Expansion for the Study”. From the synonym expansion box, a downward arrow leads to a box labeled “Literature Search Using 3 Databases (Scopus, ScienceDirect, E B S C O)”. An arrow from “Keywords Identification for the Study” also leads to the literature search box. From the literature search box, a downward arrow leads to “Article Selection Using PRISMA method”. This box connects downward to “Review Articles for Factors Identification and Recording”. From this review box, two parallel paths extend to the right. The upper path leads to a box labeled “Develop Factors Interrelationship Matrix”. The lower path leads to a box labeled “Develop Author-Factor Matrix”. From the “Develop Factors Interrelationship Matrix” box, two boxes branch to the right in a vertical sequence: “Develop Causal Loop Diagram using Vensim Software” and “Develop Degree of Centrality Table”. From the “Develop Author-Factor Matrix” box, two boxes branch to the right in a vertical sequence: “Develop Pareto Chart for Influential Factor” and “Develop S L R frequency Table”. All four boxes on the right side, causal loop diagram, degree of centrality table, Pareto chart, and S L R frequency table, connect via arrows to a final box on the far right labeled “Analysis and Synthesis”.

Flowchart for SLR data collection and analysis method. Source: Authors’ own work

Close modal
Figure 2
A PRISMA-style flowchart shows the identification, screening, and inclusion of studies via databases and registers.The diagram is arranged vertically with three labeled stages on the left: “Identification”, “Screening”, and “Included”, each shown as a vertical label. At the top center, a header reads “Identification of studies via databases and registers”. Under the Identification stage, a box on the left states: “Records identified from: Scopus (n equals 86), ScienceDirect (n equals 144), E B S C O (n equals 36)”. An arrow from this box points to a box on the right that reads: “Records removed before screening. Duplicate records removed (n equals 39)”. A downward arrow from the records identified box leads to a box labeled: “Records screened (n equals 227)”. From this box, a rightward arrow points to a box stating: “Records excluded. Not related to the topic (n equals 176)”. A downward arrow from “Records screened” leads to a box labeled: “Studies sought for retrieval (n equals 51)”. From this box, a rightward arrow points to: “Studies not retrieved (n equals 4)”. A downward arrow then leads to: “Studies assessed for eligibility (n equals 47)”. From this box, a rightward arrow points to: “Reports excluded: (n equals 0)”. Finally, a downward arrow leads to the Included stage, showing a box labeled: “Studies included in review (n equals 47)”.

PRISMA flowchart for this study. Source: Authors’ own work based on PRISMA framework

Figure 2
A PRISMA-style flowchart shows the identification, screening, and inclusion of studies via databases and registers.The diagram is arranged vertically with three labeled stages on the left: “Identification”, “Screening”, and “Included”, each shown as a vertical label. At the top center, a header reads “Identification of studies via databases and registers”. Under the Identification stage, a box on the left states: “Records identified from: Scopus (n equals 86), ScienceDirect (n equals 144), E B S C O (n equals 36)”. An arrow from this box points to a box on the right that reads: “Records removed before screening. Duplicate records removed (n equals 39)”. A downward arrow from the records identified box leads to a box labeled: “Records screened (n equals 227)”. From this box, a rightward arrow points to a box stating: “Records excluded. Not related to the topic (n equals 176)”. A downward arrow from “Records screened” leads to a box labeled: “Studies sought for retrieval (n equals 51)”. From this box, a rightward arrow points to: “Studies not retrieved (n equals 4)”. A downward arrow then leads to: “Studies assessed for eligibility (n equals 47)”. From this box, a rightward arrow points to: “Reports excluded: (n equals 0)”. Finally, a downward arrow leads to the Included stage, showing a box labeled: “Studies included in review (n equals 47)”.

PRISMA flowchart for this study. Source: Authors’ own work based on PRISMA framework

Close modal
Figure 3
A stacked bar chart shows the year- and country-wise distribution of selected articles.The chart is titled “Year and Country Wise Distribution of the Selected Article for the Studies”. The left vertical axis is labeled “Number of Articles” and ranges from 0 to 16 in increments of 2. The right vertical axis ranges from 0 to 16 in increments of 2. The horizontal axis is labeled “Years of publication” and shows the years 2019, 2020, 2021, 2022, 2023, and 2024. Each bar is stacked with different colors representing contributing countries, as listed in the legend below the chart: “ASEAN Countries”, “Azerbaijan”, “Bosnia and Herzegovina”, “Brazil”, “China”, “Czech Republic”, “Egypt”, “France”, “India”, “Indonesia”, “Italy”, “Korea”, “Malaysia”, “Poland”, “Poland, China, Romania”, “Russia”, “South Africa”, “Saudi Arabia”, “Spain”, “Switzerland”, “Taiwan”, “Tunisia”, “Ukraine”, “United Kingdom”, “U S A”, and “Vietnam”. In 2019, a total of 5 articles are published, contributed by multiple countries with small individual shares. In 2020, the total increases to 6 articles, again spread across several countries. In 2021, the highest count among the early years appears with 10 articles, showing broader international contributions. In 2022, the total decreases to 6 articles, with fewer countries contributing. In 2023, the number remains at 6 articles, dominated by a small set of countries. In 2024, the total rises sharply to 14 articles, the highest across all years, with strong contributions from multiple countries, particularly China and other European and Asian countries. Note: All numerical values are approximated.

Year and country-wise distribution of the selected articles for this study. Source: Authors’ own work

Figure 3
A stacked bar chart shows the year- and country-wise distribution of selected articles.The chart is titled “Year and Country Wise Distribution of the Selected Article for the Studies”. The left vertical axis is labeled “Number of Articles” and ranges from 0 to 16 in increments of 2. The right vertical axis ranges from 0 to 16 in increments of 2. The horizontal axis is labeled “Years of publication” and shows the years 2019, 2020, 2021, 2022, 2023, and 2024. Each bar is stacked with different colors representing contributing countries, as listed in the legend below the chart: “ASEAN Countries”, “Azerbaijan”, “Bosnia and Herzegovina”, “Brazil”, “China”, “Czech Republic”, “Egypt”, “France”, “India”, “Indonesia”, “Italy”, “Korea”, “Malaysia”, “Poland”, “Poland, China, Romania”, “Russia”, “South Africa”, “Saudi Arabia”, “Spain”, “Switzerland”, “Taiwan”, “Tunisia”, “Ukraine”, “United Kingdom”, “U S A”, and “Vietnam”. In 2019, a total of 5 articles are published, contributed by multiple countries with small individual shares. In 2020, the total increases to 6 articles, again spread across several countries. In 2021, the highest count among the early years appears with 10 articles, showing broader international contributions. In 2022, the total decreases to 6 articles, with fewer countries contributing. In 2023, the number remains at 6 articles, dominated by a small set of countries. In 2024, the total rises sharply to 14 articles, the highest across all years, with strong contributions from multiple countries, particularly China and other European and Asian countries. Note: All numerical values are approximated.

Year and country-wise distribution of the selected articles for this study. Source: Authors’ own work

Close modal
Figure 4
A Pareto chart shows the relative contribution of multiple factors and their cumulative effect.The vertical axis on the left shows frequency values ranging from 0 to about 40 in increments of 5. The vertical axis on the right shows a cumulative percentage ranging from 0 percent to 100 percent in increments of 10 percent. The horizontal axis lists factor codes from left to right, starting with E E-01, E E-02, I R-02, I R-01, E I-02, I R-03, C E-01, E I-01, O S-03, S R-01, N I-01, C E-02, N I-08, N I-07, O S-01, T I-01, S R-02, N I-05, N I-03, N I-09, O S-02, T I-02, E E-03, N I-06, N I-10, C E-03, E I-03, I R-04, I R-05, I R-06, N I-02, N I-04, O S-04. Dark vertical bars represent the frequency of each factor, ordered from highest to lowest. The tallest bar, E E-01, has a value of about 36, followed by E E-02 at about 30 and I R-02 at about 29. Frequencies gradually decrease across subsequent factors, with most of the later factors having values below 5. A smooth cumulative percentage line starts near 10 percent at the first factor, rises steeply across the first few factors, crosses about 50 percent around the fifth factor, reaches approximately 80 percent by around the thirteenth factor, and gradually approaches 100 percent at the final factor. Note: All numerical values are approximated.

Factor pareto analysis. Source: Authors’ own work

Figure 4
A Pareto chart shows the relative contribution of multiple factors and their cumulative effect.The vertical axis on the left shows frequency values ranging from 0 to about 40 in increments of 5. The vertical axis on the right shows a cumulative percentage ranging from 0 percent to 100 percent in increments of 10 percent. The horizontal axis lists factor codes from left to right, starting with E E-01, E E-02, I R-02, I R-01, E I-02, I R-03, C E-01, E I-01, O S-03, S R-01, N I-01, C E-02, N I-08, N I-07, O S-01, T I-01, S R-02, N I-05, N I-03, N I-09, O S-02, T I-02, E E-03, N I-06, N I-10, C E-03, E I-03, I R-04, I R-05, I R-06, N I-02, N I-04, O S-04. Dark vertical bars represent the frequency of each factor, ordered from highest to lowest. The tallest bar, E E-01, has a value of about 36, followed by E E-02 at about 30 and I R-02 at about 29. Frequencies gradually decrease across subsequent factors, with most of the later factors having values below 5. A smooth cumulative percentage line starts near 10 percent at the first factor, rises steeply across the first few factors, crosses about 50 percent around the fifth factor, reaches approximately 80 percent by around the thirteenth factor, and gradually approaches 100 percent at the final factor. Note: All numerical values are approximated.

Factor pareto analysis. Source: Authors’ own work

Close modal
Figure 5
A network diagram shows “L E D Airfield Lighting Impacts” at the center, with multiple interconnected input and output nodes.The dense network-style causal diagram centers on a rectangular box labeled “L E D Airfield Lighting Impacts”, with arrows labeled “Inputs” entering from the left and arrows labeled “Outputs” exiting to the right. Above the central box are multiple interconnected nodes labeled “I R-01”, “T I-02”, “N I-05”, “N I-03”, “C E-01”, “O S-03”, “C E-02”, “I R-03”, “N I-06”, “T I-01”, “E E-03”, “E E-02”, “I R-02”, “S R-01”, “E E-01” and “O S-04” These nodes are linked by numerous curved arrows forming feedback loops among themselves and directing arrows downward toward the central “L E D Airfield Lighting Impacts” box, indicating contributing or influencing relationships. Below the central box are nodes labeled “E I-01”, “N I-10”, “N I-02”, “I R-04”, “N I-04”, “I R-05”, “I R-06”, “C E-03”, “E I-02” “N I-01”, “N I-07” “S R-02”, “O S-02” “N I-08”, “N I-09”, “O S-01” and “N I-09”. These nodes are also interconnected with curved arrows, with several arrows pointing upward into the central box and others forming feedback loops among the lower nodes, representing outcomes and secondary effects.

Causal loop diagram generated using vensim software. Source: Authors’ own work

Figure 5
A network diagram shows “L E D Airfield Lighting Impacts” at the center, with multiple interconnected input and output nodes.The dense network-style causal diagram centers on a rectangular box labeled “L E D Airfield Lighting Impacts”, with arrows labeled “Inputs” entering from the left and arrows labeled “Outputs” exiting to the right. Above the central box are multiple interconnected nodes labeled “I R-01”, “T I-02”, “N I-05”, “N I-03”, “C E-01”, “O S-03”, “C E-02”, “I R-03”, “N I-06”, “T I-01”, “E E-03”, “E E-02”, “I R-02”, “S R-01”, “E E-01” and “O S-04” These nodes are linked by numerous curved arrows forming feedback loops among themselves and directing arrows downward toward the central “L E D Airfield Lighting Impacts” box, indicating contributing or influencing relationships. Below the central box are nodes labeled “E I-01”, “N I-10”, “N I-02”, “I R-04”, “N I-04”, “I R-05”, “I R-06”, “C E-03”, “E I-02” “N I-01”, “N I-07” “S R-02”, “O S-02” “N I-08”, “N I-09”, “O S-01” and “N I-09”. These nodes are also interconnected with curved arrows, with several arrows pointing upward into the central box and others forming feedback loops among the lower nodes, representing outcomes and secondary effects.

Causal loop diagram generated using vensim software. Source: Authors’ own work

Close modal
Figure 6
A network-style causal diagram shows several labeled nodes connected by curved directional arrows.Near the left-center, a darkly highlighted node labeled “E E-01” appears as a focal element. Above “E E-01” is a node labeled “S R-01”. Below “S R-01” is a node labeled “E E-02”. “S R-01” connects to “E E-02”. “E E-02” connects downward to “E I-01”. “E I-01” connects upward to “E E-01”. To the right of “E I-01” is a node labeled “E I-02”. “E E-01” curves downward to “E I-02”. “E I-02” connects rightward to “O S-01”. “O S-01” connects upward to “I R-01”. “I R-01” curves upward and connects to “S R-01”.

Reinforcing feedback loop involving EE-01 (energy efficiency) in LED airfield lighting systems. Source: Authors’ own work

Figure 6
A network-style causal diagram shows several labeled nodes connected by curved directional arrows.Near the left-center, a darkly highlighted node labeled “E E-01” appears as a focal element. Above “E E-01” is a node labeled “S R-01”. Below “S R-01” is a node labeled “E E-02”. “S R-01” connects to “E E-02”. “E E-02” connects downward to “E I-01”. “E I-01” connects upward to “E E-01”. To the right of “E I-01” is a node labeled “E I-02”. “E E-01” curves downward to “E I-02”. “E I-02” connects rightward to “O S-01”. “O S-01” connects upward to “I R-01”. “I R-01” curves upward and connects to “S R-01”.

Reinforcing feedback loop involving EE-01 (energy efficiency) in LED airfield lighting systems. Source: Authors’ own work

Close modal
Figure 7
A network-style causal diagram shows multiple labeled nodes connected by curved directional arrows.The nodes are arranged roughly in a circular layout. Each node is shown as a small rectangular label with an alphanumeric code. Near the left-center, a highlighted node labeled “E E-02” serves as a focal point. “EE-02” connects to “E E-01”, which connects downward to “E I-02”. “E I-02” connects to “O S-01” near the bottom right, and “O S-01” connects upward to “I R-01”. Slightly above and to the right of “E E-02” is a node labeled “I R-02”. At the top-right area, a node labeled “N I-03” connects downward to “I R-03”, which in turn connects to “I R-01”. Slightly above and to the left of “E E-02” is a node labeled “S R-01”. “S R-01” connects to “T I-01”, and “TI-01” connects back upward to “N I-03”, forming a feedback loop. Near the lower-right portion of the diagram, “I R-01” connects to “S R-01”. “S R-02” connects upward and leftward back to “E E-02”, completing another feedback loop. “I R-02” connects downward to “N I-01”, and “NI-01” connects upward to “S R-02”. Several arrows are visually emphasized, highlighting key directional relationships, including the arrows from “N I-03” to “I R-03”, from “N I-01” to “S R-02”, and from “T I-01” to “N I-03” within the upper feedback loop.

Balancing feedback loop involving EE-02 (reduction of energy consumption) in LED airfield lighting systems. Source: Authors’ own work

Figure 7
A network-style causal diagram shows multiple labeled nodes connected by curved directional arrows.The nodes are arranged roughly in a circular layout. Each node is shown as a small rectangular label with an alphanumeric code. Near the left-center, a highlighted node labeled “E E-02” serves as a focal point. “EE-02” connects to “E E-01”, which connects downward to “E I-02”. “E I-02” connects to “O S-01” near the bottom right, and “O S-01” connects upward to “I R-01”. Slightly above and to the right of “E E-02” is a node labeled “I R-02”. At the top-right area, a node labeled “N I-03” connects downward to “I R-03”, which in turn connects to “I R-01”. Slightly above and to the left of “E E-02” is a node labeled “S R-01”. “S R-01” connects to “T I-01”, and “TI-01” connects back upward to “N I-03”, forming a feedback loop. Near the lower-right portion of the diagram, “I R-01” connects to “S R-01”. “S R-02” connects upward and leftward back to “E E-02”, completing another feedback loop. “I R-02” connects downward to “N I-01”, and “NI-01” connects upward to “S R-02”. Several arrows are visually emphasized, highlighting key directional relationships, including the arrows from “N I-03” to “I R-03”, from “N I-01” to “S R-02”, and from “T I-01” to “N I-03” within the upper feedback loop.

Balancing feedback loop involving EE-02 (reduction of energy consumption) in LED airfield lighting systems. Source: Authors’ own work

Close modal
Table 1

Search strings for this study

DatabaseSearch string
Scopus(“Effect*” OR “Impact*” OR “Influence*” OR “Outcome*” OR “Consequence*” OR “Result*”) AND (“LED” OR “Light-emitting diode” OR “LED technology” OR “LED lighting systems”) AND (“Airfield light*” OR “Runway light*” OR “Taxiway light*” OR “Airport light*” OR “Aviation light* “ OR “Airfield illumination*”) AND (“Sustain*” OR “Environmental sustain*” OR “Eco-friendly” OR “Green practice*” OR “Energy efficiency” OR “Sustainable development”) AND (“Occupational safety” OR “Worker safety” OR “Health and safety” OR “Workplace hazards” OR “Operational safety”) AND PUBYEAR >2019 AND PUBYEAR <2024
Science direct(“LED lighting” OR “LED technology”) AND (“Sustainability” OR “Energy efficiency”) AND (“Airport operations” OR “Aviation” OR “Airports”) AND PUBYEAR >2019 AND PUBYEAR <2024
(“Light-emitting diode” OR “LED lighting systems”) AND (“Occupational safety” OR “Worker safety”) AND (“Airport operations” OR “Aviation” OR “Airports”) AND PUBYEAR >2019 AND PUBYEAR <2024
EBSCO(“Effect*” OR “Impact*” OR “Influence*” OR “Outcome*” OR “Consequence*” OR “Result*”) AND (“LED” OR “Light-emitting diode” OR “LED technology” OR “LED lighting systems”) AND (“Airfield light*” OR “Runway light*” OR “Taxiway light*” OR “Airport light*” OR “Aviation light* “ OR “Airfield illumination*”) AND (“Sustain*” OR “Environmental sustain*” OR “Eco-friendly” OR “Green practice*”) AND (“Occupational safety” OR “Worker safety” OR “Health and safety” OR “Workplace hazards” OR “Operational safety”) AND PUBYEAR >2019 AND PUBYEAR <2024
Source(s): Authors’ own work
Table 2

Inclusion and exclusion criteria table for this study

Inclusion criteriaExclusion criteriaJustification
Published within the last five years (2019–2024)Studies published before 2019To ensure relevance and reflect the latest advances in LED technology and sustainability practices
Literature available exclusively in EnglishNon-English papers due to translation constraintsEnglish-language sources were prioritised due to language proficiency and resource limitations
Journal articles, conference proceedings, booksShort surveys, draft publications, literature reviews, SLRs and critical reviewsTo focus on peer-reviewed, original research offering empirical data or analytical models
Studies related to the Construction and Engineering sectorsStudies outside the field of construction and engineeringTo ensure content aligns with the technical and infrastructure-related focus of the study
Studies related to Health and SafetyStudies not related to Health and SafetyTo include only research relevant to the occupational safety dimension of LED airfield lighting
Source(s): Authors’ own work
Table 3

Factors and themes categorisation

ThemeCodeDescription of the code
Energy EfficiencyEE-01Energy efficiency of LED systems
EE-02Reduction of energy consumption in lighting
EE-03Lower Energy Loss
Occupational Safety and Visual PerformanceOS-01Operational Safety Improvement
OS-02Uniformity of light distribution
OS-03Importance of Lighting for Operational Safety
OS-04Importance of light control in airfield lighting
Environmental Impact and Light PollutionEI-01Reduction of carbon emissions
EI-02General environmental friendliness of LED systems
EI-03Resource Efficiency
Technological IntegrationTI-01Smart Control and Adaptability
TI-02Technological Integration
Lighting Intensity and RobustnessIR-01High-Performance light output
IR-02Durability of LED lighting
IR-03Flexibility in light control
IR-04Stable light output under varying conditions
IR-05Resistance to harsh/corrosive environments
IR-06Reduced light intensity during winter conditions
Cost EffectivenessCE-01Reduced maintenance costs
CE-02Reduced operational costs
CE-03Economic feasibility for large-scale implementation
Negative Impacts or DisadvantagesNI-01High setup or installation costs
NI-02High operational and maintenance costs
NI-03Technical limitations
NI-04Risk of rapid obsolescence or adaptation needs
NI-05Electrical interference or harmonic disruption
NI-06Power instability sensitivity
NI-07Colour variation or distortion under conditions
NI-08Blue light emission concerns
NI-09Sleep Cycle disruption from the light spectrum
NI-10Skyglow Pollution
Safety Regulations and ComplianceSR-01Compliance with regulations and standards
SR-02Government incentives for LED adoption
Source(s): Authors’ own work
Table 4

Author-factor matrix for this study

SLAuthorEE-01EE-02EE-03OS-010S-02OS-03OS-04EI-01EI-02EI-03TI-01TI-02NI-01NI-02NI-03NI-04NI-05NI-06NI-07NI-08NI-09NI-10CE-01CE-02CE-03IR-01IR-02IR-03IR-04IR-05IR-06SR-01SR-02
1Taylor and Freyssinier (2022)                               
2Kvach (2022)                            
3Kvach (2021)                           
4Chao et al. (2021)                       
5Vorozhikhin et al. (2019)                        
6Ly Duc et al. (2024)                        
7Pagden et al. (2020)                       
8Baghirov (2023)                         
9Baghirov and Baghirova (2023)                                
10Kim et al. (2021)                           
11Fryc et al. (2021)                            
12Dou et al. (2021)                            
13Sánchez-Balvás et al. (2021)                              
14Lisovenko et al. (2020)                             
15Wagiman et al. (2020)                               
16Lv et al. (2024)                           
17Keerthana and Indumathi (2025)                             
18Azis (2021)                              
19Mlynczak (2024)                           
20Sreenath et al. (2021)                                
21De Oliveira et al. (2021)                            
22Dang et al. (2023)                            
23Tai et al. (2025)                                
24Goudjil et al. (2023)                             
25Barbara et al. (2024)                            
26Chlebek (2019)                        
27Li et al. (2024)                              
28Sudjoko et al. (2021)                                
29Liu et al. (2023)                                
30Bloudicek et al. (2024)                         
31Ahmed et al. (2022)                        
32Halima et al. (2022)                           
33Damerdash et al. (2021)                                
34Barwar et al. (2022)                             
35Nazir et al. (2025)                           
36Cumo et al. (2025)                             
37Skarżyński and Wiśniewski (2024)                                
38Fryc et al. (2024)                          
39Gerke (2019)                           
40Gao et al. (2019)                                
41Omran et al. (2019)                          
42Khan et al. (2023)                             
43Różowicz et al. (2022)                               
44Velásquez et al. (2024)                        
45Valetti et al. (2023)                      
46Collin et al. (2020)                               
47Ramljak and Tokić (2020)                               
 Total Factor Count36302531211219153101314267321371232917111105
Source(s): Authors’ own work
Table 5

Interrelationship table for this study

Factor codeEE-01EE-02EE-03OS-01OS-02OS-03OS-04EI-01EI-02EI-03TI-01TI-02IR-01IR-02IR-03IR-04IR-05IR-06CE-01CE-02CE-03NI-01NI-02NI-03NI-04NI-05NI-06NI-07NI-08NI-09NI-10SR-01SR-02
EE-01 P -16, 17, 20, 25, 26, 27, 30, 32, 35, 36, 39, 44, 45
NA -34
NA -47NA -47NA -47NA -47NA -47P -4, 7, 16, 22, 32, 36, 45
NA -30
P -26, 30, 32, 40, 41, 44
NA -33
NA -47NA -47NA -47P -32, 44, 45, 46
NA -43
P -21, 41
NA -45
P -34
NA -46
NA -47NA -47NA -47P -7, 18, 31, 45
NA -43
P -37, 41
NA -45
NA -34P -42
NA -46
NA -47NA -47NA -47NA -47NA -47NA -47NA -47NA -47P -38
NA -46
P -12
NA -33
NA -47
EE-02P -11, 12, 13. 18, 41
NA -42
 NA -47NA -47NA -47NA -47NA -47P -4. 35, 36, 39, 45
NA -42
NA -47NA -47NA -47NA -47NA -47P -22, 30
NA -45
NA -47NA -47NA -47NA -47P -5, 7, 18, 19, 22, 25, 27, 30, 31
NA- 38
P -8, 31, 35, 44
NA -43
NA -47NA -47NA -47NA -47NA -47NA -47NA -47NA -47NA -47NA -47P -38
NA -46
NA -47NA -47
EE-03P -32
NA -46
P -45
NA -46
 NA -47NA -47NA -47NA -47NA -47NA -47NA -47NA -47NA -47NA -47NA -47NA -47NA -47NA -47NA -47NA -47NA -47NA -47NA -47NA -47NA -47NA -47NA -47NA -47NA -47NA -47NA -47NA -47NA -47NA -47
OS-01NA -47NA -47NA -47 NA -47P -19
NA -46
NA -47NA -47NA -47NA -47NA -47NA -47P -38
NA -46
NA -47NA -47NA -47NA -47NA -47NA -47NA -47NA -47NA -47NA -47NA -47NA -47NA -47NA -47NA -47NA -47NA -47NA -47NA -47NA -47
OS-02NA -47NA -47NA -47P -10
NA -46
 NA -47NA -47NA -47NA -47NA -47NA -47NA -47P -17
NA -46
NA -47NA -47NA -47NA -47NA -47NA -47NA -47NA -47NA -47NA -47NA -47NA -47NA -47NA -47NA -47NA -47NA -47NA -47NA -47NA -47
OS-03NA -47NA -47NA -47NA -47NA -47 NA -47NA -47NA -47NA -47NA -47NA -47NA -47NA -47NA -47NA -47NA -47NA -47NA -47NA -47NA -47NA -47NA -47NA -47NA -47NA -47NA -47NA -47NA -47NA -47P -44
NA -46
NA -47NA -47
OS-04NA -47NA -47NA -47NA -47NA -47NA -47 NA -47NA -47NA -47NA -47NA -47NA -47NA -47NA -47NA -47NA -47NA -47NA -47NA -47NA -47NA -47NA -47NA -47NA -47NA -47NA -47NA -47NA -47NA -47NA -47NA -47NA -47
EI-01P -38
NA -46
NA -47NA -47NA -47NA -47NA -47NA -47 NA -47NA -47NA -47NA -47NA -47NA -47NA -47NA -47NA -47NA -47NA -47NA -47NA -47NA -47NA -47NA -47NA -47NA -47NA -47NA -47NA -47NA -47NA -47NA -47NA -47
EI-02NA -47P -11
NA -46
NA -47P -8
NA -46
NA -47P -6
NA -46
NA -47NA -47 P-21
NA -46
NA -47NA -47NA -47NA -47NA -47NA -47NA -47NA -47P -18
NA -46
NA -47NA -47NA -47NA -47NA -47NA -47NA -47NA -47NA -47NA -47NA -47NA -47NA -47NA -47
EI-03NA -47NA -47NA -47NA -47NA -47NA -47NA -47NA -47NA -47 NA -47NA -47NA -47NA -47NA -47NA -47NA -47NA -47NA -47NA -47NA -47NA -47NA -47NA -47NA -47NA -47NA -47NA -47NA -47NA -47NA -47NA -47NA -47
TI-01NA -47P -45
NA -46
NA -47NA -47P -14
NA -46
P -14
NA -46
P -23
NA -46
NA -47NA -47NA -47 NA -47NA -47NA -47P -3, 6, 7
NA -46
NA -47NA -47NA -47P -45
NA -46
NA -47NA -47NA -47NA -47N -6
NA -46
NA -47NA -47NA -47NA -47NA -47NA -47NA -47NA -47NA -47
TI-02NA -47P -10
NA -46
NA -47NA -47NA -47NA -47NA -47NA -47NA -47NA -47NA -47 P -26
NA -46
NA -47NA -47NA -47NA -47NA -47NA -47NA -47NA -47NA -47NA -47NA -47NA -47NA -47NA -47NA -47NA -47NA -47NA -47P -36
NA -46
NA -47
IR-01P -6, 44
NA -45
NA -47NA -47NA -47NA -47P -45
NA -46
NA -47NA -47NA -47NA -47NA -47NA -47 NA -47NA -47NA -47NA -47NA -47NA -47NA -47NA -47NA -47NA -47NA -47NA -47NA -47NA -47NA -47NA -47NA -47NA -47P -30
NA -46
NA -47
IR-02P -8, 42
NA -45
P -5, 11, 24
NA -44
NA -47NA -47NA -47NA -47NA -47P -4, 21, 25
NA -44
NA -47NA -47NA -47NA -47P -32
NA -46
 NA -47NA -47NA -47NA -47P -4, 6, 7, 10, 19, 22, 26
NA -40
P -6
NA -46
NA -47P -35
NA -46
P -1 
NA -46
NA -47NA -47NA -47NA -47NA -47NA -47NA -47NA -47NA -47NA -47
IR-03P -8, 13
NA -45
P -11, 13, 24
NA -44
NA -47NA -47NA -47NA -47NA -47NA -47NA -47NA -47NA -47NA -47NA -47P -35
NA -46
 NA -47NA -47NA -47NA -47NA -47NA -47NA -47NA -47NA -47NA -47NA -47NA -47NA -47NA -47NA -47NA -47NA -47NA -47
IR-04P -8
NA -46
NA -47NA -47NA -47NA -47NA -47NA -47NA -47NA -47NA -47NA -47NA -47NA -47NA -47NA -47 NA -47NA -47NA -47NA -47NA -47NA -47NA -47NA -47NA -47NA -47NA -47NA -47NA -47NA -47NA -47NA -47NA -47
IR-05NA -47NA -47NA -47NA -47NA -47NA -47NA -47NA -47NA -47NA -47NA -47NA -47NA -47NA -47NA -47NA -47 NA -47NA -47NA -47NA -47NA -47NA -47NA -47NA -47NA -47NA -47NA -47NA -47NA -47NA -47NA -47NA -47
IR-06NA -47NA -47NA -47NA -47NA -47NA -47NA -47NA -47NA -47NA -47NA -47NA -47NA -47NA -47NA -47NA -47NA -47 NA -47NA -47NA -47NA -47NA -47NA -47NA -47NA -47NA -47NA -47NA -47NA -47NA -47NA -47NA -47
CE-01NA -47NA -47NA -47NA -47NA -47NA -47NA -47NA -47NA -47NA -47NA -47NA -47NA -47NA -47NA -47NA -47NA -47NA -47 NA -47NA -47NA -47NA -47NA -47NA -47NA -47NA -47NA -47NA -47NA -47NA -47NA -47NA -47
CE-02NA -47NA -47NA -47NA -47NA -47NA -47NA -47NA -47NA -47NA -47NA -47NA -47NA -47NA -47NA -47NA -47NA -47NA -47NA -47 NA -47NA -47NA -47NA -47NA -47NA -47NA -47NA -47NA -47NA -47NA -47NA -47NA -47
CE-03NA -47NA -47NA -47NA -47NA -47NA -47NA -47NA -47NA -47NA -47NA -47NA -47NA -47NA -47NA -47NA -47NA -47NA -47P -18
NA -46
NA -47 NA -47NA -47NA -47NA -47NA -47NA -47NA -47NA -47NA -47NA -47NA -47NA -47
NI-01NA -47NA -47NA -47NA -47NA -47NA -47NA -47NA -47NA -47NA -47NA -47NA -47NA -47NA -47NA -47NA -47NA -47NA -47N -7, 16
NA -45
NA -47NA -47 NA -47NA -47NA -47NA -47NA -47NA -47NA -47NA -47NA -47NA -47N -27
NA -46
NI-02NA -47NA -47NA -47NA -47NA -47NA -47NA -47NA -47NA -47NA -47NA -47NA -47NA -47NA -47NA -47NA -47NA -47NA -47N -27
NA -46
NA -47NA -47NA -47 NA -47NA -47NA -47NA -47NA -47NA -47NA -47NA -47NA -47NA -47
NI-03NA -47NA -47NA -47NA -47NA -47NA -47NA -47NA -47NA -47NA -47NA -47NA -47N -43
NA -46
N -6, 43
NA -45
N -6
NA -46
NA -47NA -47NA -47N -6
NA -46
NA -47NA -47NA -47NA -47 NA -47NA -47NA -47NA -47NA -47NA -47NA -47NA -47NA -47
NI-04NA -47NA -47NA -47NA -47NA -47NA -47NA -47NA -47NA -47NA -47NA -47NA -47NA -47NA -47NA -47NA -47NA -47NA -47NA -47NA -47NA -47NA -47NA -47N -5
NA -46
 NA -47NA -47NA -47NA -47NA -47NA -47NA -47NA -47
NI-05NA -34NA -34NA -34NA -34NA -34NA -34NA -47NA -47NA -47NA -47NA -47NA -47N -34
NA -46
NA -47N -12
NA -46
NA -47NA -47NA -47NA -47NA -47NA -47NA -47NA -47NA -47NA -47 NA -47NA -47NA -47NA -47NA -47NA -47NA -47
NI-06NA -47NA -47NA -47NA -47NA -47NA -47NA -47NA -47NA -47NA -47NA -47NA -47NA -47NA -47NA -47NA -47NA -47NA -47NA -47NA -47NA -47NA -47NA -47NA -47NA -47NA -47 NA -47NA -47NA -47NA -47NA -47NA -47
NI-07NA -47NA -47NA -47N -2
NA -46
NA -47NA -47NA -47NA -47NA -47NA -47NA -47NA -47N -32
NA -46
NA -47NA -47NA -47NA -47N -26
NA -46
NA -47NA -47NA -47NA -47NA -47NA -47NA -47NA -47NA -47 NA -47NA -47N -31
NA -46
NA -47NA -47
NI-08NA -47NA -47NA -47N -2
NA -46
NA -47NA -47NA -47NA -47NA -47NA -47NA -47NA -47NA -47NA -47NA -47NA -47NA -47NA -47NA -47NA -47NA -47NA -47NA -47NA -47NA -47NA -47NA -47N -3, 9
NA -45
 N -7, 38, 44
NA -44
NA -47NA -47NA -47
NI-09NA -47NA -47NA -47NA -47NA -47NA -47NA -47NA -47NA -47NA -47NA -47NA -47NA -47NA -47NA -47NA -47NA -47NA -47NA -47NA -47NA -47NA -47NA -47NA -47NA -47NA -47NA -47NA -47NA -47 NA -47NA -47NA -47
NI-10NA -47NA -47NA -47NA -47NA -47NA -47NA -47NA -47NA -47NA -47NA -47NA -47NA -47NA -47NA -47NA -47NA -47NA -47NA -47NA -47NA -47NA -47NA -47NA -47NA -47NA -47NA -47NA -47NA -47NA -47 NA -47NA -47
SR-01P -17, 36, 42, 45
NA -43
P -3
NA -46
NA -47NA -47NA -47P -1, 28, 29
NA -44
NA -47NA -47NA -47NA -47P -45
NA -46
NA -34P -3
NA -46
P -1, 3
NA -45
NA -47NA -47NA -47NA -47NA -47NA -47NA -47NA -47NA -47NA -47NA -47NA -47NA -47NA -47NA -47NA -47NA -47 NA -47
SR-02P -16, 41, 44
NA -44
P -39
NA -46
NA -47NA -47NA -47NA -47NA -47NA -47NA -47NA -47NA -47NA -47NA -47NA -47NA -47NA -47NA -47NA -47NA -47NA -47NA -47NA -47NA -47NA -47NA -47NA -47NA -47NA -47NA -47NA -47NA -47NA -47 

Note(s): The number corresponds to the author in Table 4, blue indicates positive and red indicates negative. NA–Not applicable and the corresponding number represent the number of articles that did not identify the relations

Source(s): Authors’ own work
Table 6

Degree of centrality results

Interrelationship table node analysis
Factor codeNo. of interactionDegree of centralityRank
EE-01201.001
EE-02150.752
IR-02130.653
IR-01120.604
CE-0190.455
TI-0180.406
IR-0370.357
OS-0160.308
EI-0260.30
NI-0360.30
OS-0360.30
NI-0750.25>10
EI-0140.20 
NI-0140.20 
NI-0840.20 
NI-1040.20 
CE-0230.15 
OS-0230.15 
SR-0130.15 
TI-0230.15 
EE-0320.10 
NI-0220.10 
NI-0520.10 
CE-0310.05 
EI-0310.05 
IR-0410.05 
IR-0610.05 
NI-0410.05 
NI-0910.05 
OS-0410.05 
SR-0210.05 
IR-0500.00 
NI-0600.00 
Source(s): Authors’ own work
Table 7

Causal loop analysis result

Factor codeTotal number of loopsNumber of reinforcing loopsNumber of balancing loopsRank
EE-01263207561
SR-01232176562
IR-02215143723
IR-01190146444
EE-02189131585
TI-01164122426
IR-03150112387
EI-019173188
NI-038358259
NI-017507510
SR-0275075>10
EI-02614417 
OS-01544915 
NI-0531238 
OS-02440 
CE-01000 
CE-02000 
CE-03000 
EE-03000 
EI-03000 
IR-04000 
IR-05000 
IR-06000 
NI-02000 
NI-04000 
NI-06000 
NI-07000 
NI-08000 
NI-09000 
NI-10000 
OS-03000 
OS-04000 
TI-02000 
Source(s): Authors’ own work
Table 8

Top factors comparison

Factor codeDegree of centralityDegree of centrality rankRankFactor codeNumber of loopsCLD rankFactor codeSLR frequencySLR rank
EE-01201.001EE-012631EE-01361
EE-02150.752SR-012322EE-02302
IR-02130.653IR-022153IR-02293
IR-01120.604IR-011904IR-01234
CE-0190.455EE-021895EI-02195
TI-0180.406TI-011646IR-03176
IR-0370.357IR-031507CE-01137
OS-0160.308EI-01918EI-01128
EI-0260.30NI-03839OS-03129
NI-0360.30NI-017510SR-011110
OS-0360.30
Source(s): Authors’ own work

Supplements

References

Ahmed
,
T.
,
Khalid
,
W.
and
Aslam
,
A.
(
2022
), “
Energy conservation potential in highway illumination system: a Techno-Enviro-Economic study on retrofitting HPS with LED luminaires
”,
Energy and Environment
, Vol. 
33
No. 
3
, pp. 
599
-
613
, doi: .
Airport
,
A.
(
2025a
), “
Annual report 2025
”,
available at:
 https://www.aucklandairport.co.nz/content/dam/aia/files/corporate/annual-report-2025/2025%20Annual%20Report.pdf (
accessed
 18 November 2025).
Airport
,
A.
(
2025b
), “
ESG metrics
”,
available at:
 https://www.aucklandairport.co.nz/content/dam/aia/files/corporate/sustainability/FY25%20AKL%20ESG%20databook.xlsx (
accessed
 18 November 2025).
An
,
H.
,
Wang
,
Y.
,
Wang
,
Y.
,
Liu
,
J.
,
Tang
,
X.
and
Yi
,
H.
(
2025
), “
Civil aviation emissions in China in 2019: characteristics and abatement potential
”,
Journal of Environmental Sciences
, Vol. 
151
, pp. 
225
-
237
, doi: .
Azis
,
S.S.A.
(
2021
), “
Improving present-day energy savings among green building sector in Malaysia using benefit transfer approach: cooling and lighting loads
”,
Renewable and Sustainable Energy Reviews
, Vol. 
137
, 110570, doi: .
Baghirov
,
S.
(
2023
), “
Study of energy efficiency indicators of led light sources
”,
International Journal on “Technical and Physical Problems of Engineering” (IJTPE)
, Vol. 
15
No. 
77
, p.
4
,
available at:
 https://www.researchgate.net/profile/Sabir-Baghirov-2/publication/396832974_STUDY_OF_ENERGY_EFFICIENCY_INDICATORS_OF_LED_LIGHT_SOURCES/links/68fa8ab0e7f5f867e6e1ed1c/STUDY-OF-ENERGY-EFFICIENCY-INDICATORS-OF-LED-LIGHT-SOURCES.pdf
Baghirov
,
S.
and
Baghirova
,
S.
(
2023
), “
Research on influence of radiation from LED light sources
”,
International Journal on Technical and Physical Problems of Engineering (IJTPE)
, No. 
55
, pp. 
335
-
339
,
available at:
 https://www.researchgate.net/profile/Sabir-Baghirov-2/publication/396842121_RESEARCH_ON_INFLUENCE_OF_RADIATION_FROM_LED_LIGHT_SOURCES/links/68fa88127d9a4d4e870bf990/RESEARCH-ON-INFLUENCE-OF-RADIATION-FROM-LED-LIGHT-SOURCES.pdf
Barbara
,
C.E.
,
Adamo
,
I.D.
,
Gastaldi
,
M.
and
Nizami
,
A.S.
(
2024
), “
Clean energy for a sustainable future: analysis of a PV system and LED bulbs in a hotel
”,
Energy
, Vol. 
299
, 131547, doi: .
Barwar
,
M.K.
,
Sahu
,
L.K.
and
Bhatnagar
,
P.
(
2022
), “
Reliability analysis of flicker-free LED driver based on five-level rectifier
”,
Optik
, Vol. 
268
, 169762, doi: .
Baxter
,
G.
(
2023
), “
An assessment of sustainable energy management at a major United Kingdom based hub airport: a case study of London gatwick airport
”,
International Journal of Environment, Agriculture and Biotechnology
, Vol. 
8
No. 
2
, pp. 
001
-
023
, doi: .
Baxter
,
G.
,
Srisaeng
,
P.
and
Wild
,
G.
(
2018
), “
An assessment of airport sustainability, part 2-Energy management at Copenhagen Airport
”,
Resources
, Vol. 
7
No. 
2
, 32, doi: .
Bloudicek
,
R.
,
Perina
,
S.
,
Rydlo
,
S.
and
Makula
,
P.
(
2024
), “
Degradation of photometric characteristics of phosphor layers in LED based airfield lights
”,
2024 AIAA DATC/IEEE 43rd Digital Avionics Systems Conference (DASC)
, pp. 
1
-
7
, doi: .
Brooks
,
C.
(
2014
), “
What is a pareto analysis
”,
Business News Daily Senior
, Vol. 
29
No. 
1
, pp. 
1
-
5
,
available at:
 https://www.burkeadvisory.com/wp-content/uploads/2018/07/What-Is-a-Pareto-Analysis.pdf
Budd
,
T.
,
Budd
,
L.
and
Ison
,
S.
(
2015
), “
Environmentally sustainable practices at UK airports
”,
Proceedings - Institution of Civil Engineers: Transport
, Vol. 
168
No. 
2
, pp. 
116
-
123
, doi: .
Bullough
,
J.D.
(
2012
), “
Issues with use of airfield LED light fixtures
”,
Transportation Research Board
, Vol. 
35
, doi: .
Bullough
,
J.D.
(
2017
), “
Human factors impacts of light-emitting diode airfield lighting
”,
Transportation Research Record
, Vol. 
2626
No. 
1
, pp. 
51
-
57
, doi: .
Chao
,
C.C.
,
Chen
,
H.T.
and
Tsai
,
Y.S.
(
2021
), “
Cost assessment model of airport runway lighting systems with consideration on carbon emissions
”,
Journal of Aeronautics, Astronautics and Aviation
, Vol. 
53
No. 
1
, pp. 
67
-
82
, doi: .
Chlebek
,
J.
(
2019
), “
Runway lighting systems as a key tool to extend operational capabilities of VFR airports
”,
Transportation Research Procedia
, Vol. 
43
, pp. 
236
-
242
, doi: .
Collin
,
A.J.
,
Djokic
,
S.Z.
,
Drapela
,
J.
,
Guo
,
Z.
,
Langella
,
R.
,
Testa
,
A.
and
Watson
,
N.R.
(
2020
), “
Analysis of approaches for modeling the low frequency emission of LED lamps
”,
Energies
, Vol. 
13
No. 
7
, 1571, doi: .
Cumo
,
F.
,
Pennacchia
,
E.
and
Sferra
,
A.S.
(
2025
), “
Sustainability in public lighting: the methodology for identifying environmentally optimal solutions in replacement planning—a case study
”,
Energies
, Vol. 
18
No. 
3
, p.
535
, doi: ,
available at:
 https://www.mdpi.com/1996-1073/18/3/535
Damerdash
,
A.M.
,
Abdelhameed
,
D.
,
Aly
,
M.
,
Ahmed
,
E.M.
and
Ahmed
,
M.A.
(
2021
), “
Energy efficiency assessment of power electronic drivers and LED lamps in Li-Fi communication systems
”,
Energy Reports
, Vol. 
7
, pp. 
7648
-
7662
, doi: .
Dang
,
S.
,
Tian
,
Y.
,
Almahfoudh
,
H.H.
,
Song
,
H.
,
Bakr
,
O.M.
,
Ooi
,
B.S.
and
Gan
,
Q.
(
2023
), “
Ground-facing radiative cooling for high power LED lights
”,
Next Energy
, Vol. 
1
No. 
4
, 100069, doi: .
Davidovic
,
M.
and
Kostic
,
M.
(
2022
), “
Comparison of energy efficiency and costs related to conventional and LED road lighting installations
”,
Energy
, Vol. 
254
, 124299, doi: .
De Oliveira
,
R.P.
,
Benvenuti
,
J.
and
Espinosa
,
D.C.R.
(
2021
), “
A review of the current progress in recycling technologies for gallium and rare earth elements from light-emitting diodes
”,
Renewable and Sustainable Energy Reviews
, Vol. 
145
, 111090, doi: .
Dou
,
J.
,
Ma
,
H.
,
Yang
,
J.
,
Zhang
,
Y.
and
Guo
,
R.
(
2021
), “
An improved power quality evaluation for LED lamp based on G1-entropy method
”,
IEEE Access
, Vol. 
9
, pp. 
111171
-
111180
, 9508412, doi:
Ergün
,
E.
and
Usluel
,
Y.K.
(
2016
), “
An analysis of density and degree-centrality according to the social networking structure formed in an online learning environment
”,
Journal of Educational Technology and Society
, Vol. 
19
No. 
4
, pp. 
34
-
46
,
available at:
 https://www.researchgate.net/profile/Esin-Erguen/publication/311670276_An_analysis_of_density_and_degree-centrality_according_to_the_social_networking_structure_formed_in_an_online_learning_environment/links/5f61f24aa6fdcc116415d417/An-analysis-of-density-and-degree-centrality-according-to-the-social-networking-structure-formed-in-an-online-learning-environment.pdf
Fryc
,
I.
,
Czyżewski
,
D.
,
Fan
,
J.
and
Gălăţanu
,
C.D.
(
2021
), “
The drive towards optimization of road lighting energy consumption based on mesopic vision—a suburban street case study
”,
Energies
, Vol. 
14
No. 
4
, 1175, doi: .
Fryc
,
I.
,
Listowski
,
M.
,
Martinsons
,
C.
,
Fan
,
J.
and
Czyżewski
,
D.
(
2024
), “
A paradox of LED road lighting: reducing light pollution is not always linked to energy savings
”,
Energies
, Vol. 
17
No. 
22
,
5727
, doi: ,
available at:
 https://www.mdpi.com/1996-1073/17/22/5727
Gao
,
Y.
,
d'Adda
,
G.
and
Tavoni
,
M.
(
2019
), “
Adopting LEDs changes attitudes towards climate change: experimental evidence from China
”,
Environmental Research Letters
, Vol. 
14
No. 
8
, 084018, doi: .
Gerke
,
B.F.
(
2019
), “Light-emitting diode lighting products. In technological Learning in the Transition to a low-carbon energy system: conceptual issues, empirical findings, and use”, in
Energy Modeling
, pp. 
233
-
256
, doi: .
Göçmen
,
E.
(
2021
), “
Smart airport: evaluation of performance standards and technologies for a smart logistics zone
”,
Transportation Research Record
, Vol. 
2675
No. 
7
, pp. 
480
-
490
, doi: .
Goudjil
,
A.
,
Pigeon
,
E.
,
Pouliquen
,
M.
,
Menard
,
T.
,
Gehan
,
O.
,
Girard
,
S.
,
Dufay
,
B.
and
Boudjelal
,
A.
(
2023
), “
An interior-points algorithm for color and CCT control of multichannel LED lighting system using a Smart 18-Channel Spectral Sensor
”,
Energy and Buildings
, Vol. 
298
, 113541, doi: .
Halima
,
A.B.
,
Araoud
,
Z.
,
Canale
,
L.
,
Charrada
,
K.
and
Zissis
,
G.
(
2022
), “
Energy efficiency of a LED lighting system using a Peltier module thermal converter
”,
Case Studies in Thermal Engineering
, Vol. 
34
, 101989, doi: .
Haraldsson
,
H.V.
(
2004
),
Introduction to System Thinking and Causal Loop Diagrams. Department of Chemical Engineering
,
Lund University
,
Lund, Sweden
,
available at:
 https://www.researchgate.net/profile/Hoerdur-Haraldsson/publication/258261003_Introduction_to_system_thinking_and_causal_loop_diagrams/links/5bcceed6458515f7d9d01e81/Introduction-to-system-thinking-and-causal-loop-diagrams.pdf
Keerthana
,
S.
and
Indumathi
,
G.
(
2025
), “
Revolutionizing interior Spaces: a comprehensive analysis of LED lighting for illumination and communication in modern Architecture
”,
Energy and Buildings
, Vol. 
331
, 115297, doi: .
Khan
,
M.F.
,
Reddy
,
S.
and
Swanson
,
A.G.
(
2023
), “
The performance and impact of LED floodlights in an outdoor electrical substation during misty weather conditions
”,
2023 IEEE Sustainable Smart Lighting World Conference and Expo (LS18)
, pp. 
1
-
6
,
available at:
 https://10.1109/LS1858153.2023.10170044
Kim
,
J.
,
Kang
,
J.
and
Jang
,
W.
(
2021
), “
Analysis on high-power seaport LED luminaire with uniform light distribution based on optimized lens and heatsink
”,
Applied Sciences
, Vol. 
11
No. 
9
,
4035
, doi: ,
available at:
 https://www.mdpi.com/2076-3417/11/9/4035
Kvach
,
Y.
(
2021
), “
Modeling of secondary optics LED aerodrome fires
”,
2021 International Conference on Numerical Simulation of Optoelectronic Devices (NUSOD)
, pp. 
71
-
72
,
available at:
 https://10.1109/NUSOD52207.2021.9541481
Kvach, Y.
(
2022
), “
Observations of LED side lights at the stage of visual piloting [conference paper]
”,
Lecture Notes in Mechanical Engineering
, pp. 1-13, ISSN 2195-4356 ISSN 2195-4364 (electronic), ISBN 978-3-030-85056-2 ISBN 978-3-030-85057-9 (eBook), doi: .
Li
,
T.
,
Liu
,
A.
,
Li
,
Y.
and
Zhang
,
J.
(
2024
), “
Research on the construction of low-current Airfield Groud Lighting system for civil airports in China
”,
Journal of Physics: Conference Series
, Vol. 
2840
No. 
1
, 012029, doi: .
Lisovenko
,
V.
,
Lisovenko
,
D.V.
,
Bazik
,
O.
,
Shmelev
,
Y.
and
Byłeń
,
S.
(
2020
), “
Electronic control of local uniformity of illuminance from power LED
”,
Systemy Logistyczne Wojsk
, Vol. 
52
No. 
1
, pp. 
115
-
124
, doi: .
Liu
,
J.
,
Guan
,
M.
,
Yang
,
H.
,
Chen
,
W.
,
Niu
,
H.
and
Fu
,
Q.
(
2023
), “
Airfield lighting management system development based on digital twin technology
”,
2023 IEEE 5th International Conference on Civil Aviation Safety and Information Technology (ICCASIT)
, pp. 
533
-
539
,
available at:
 https://10.1109/ICCASIT58768.2023.10351572
Lv
,
Z.
,
Guo
,
H.
,
Zhang
,
L.
,
Liang
,
D.
,
Zhu
,
Q.
,
Liu
,
X.
,
Zhou
,
H.
,
Liu
,
Y.
,
Gou
,
Y.
,
Dou
,
X.
and
Chen
,
G.
(
2024
), “
Urban public lighting classification method and analysis of energy and environmental effects based on SDGSAT-1 glimmer imager data
”,
Applied Energy
, Vol. 
355
, 122355, doi: .
Ly Duc
,
M.
,
Bilik
,
P.
and
Martinek
,
R.
(
2024
), “
Hybrid six sigma based on recursive kalman filter and weibull distribution to estimate the lifespan of Bulb LEDs
”,
Results in Engineering
, Vol. 
23
, 102633, doi: .
McLachlan
,
R.I.
and
Callister
,
P.
(
2022
), “
Managing New Zealand's greenhouse gas emissions from aviation
”,
Victoria University of Wellington Institute for Governance and Policy Studies
, Vol. 
54
No. 
4
, pp. 
412
-
432
, doi: .
Mlynczak
,
J.
(
2024
), “
Measuring the low divergent luminous flux emitted by LED torch lamps using a simple detector and a spectrometer as an alternative to an integrating sphere
”,
Measurement
, Vol. 
241
, 115725, doi: .
Nardelli
,
A.
,
Deuschle
,
E.
,
Azevedo
,
L. D.d.
,
Pessoa
,
J.L.N.
and
Ghisi
,
E.
(
2017
), “
Assessment of light emitting diodes technology for general lighting: a critical review
”,
Renewable and Sustainable Energy Reviews
, Vol. 
75
, pp. 
368
-
379
, doi: .
Nazir
,
R.
,
Akbar
,
F.
,
Malik
,
H.
,
Saputra
,
D.A.
and
Muharram
,
I.C.
(
2025
), “
Analysis of the effect of environmental conditions on energy savings in lighting systems with dimming method in campus buildings
”,
International Journal of Power Electronics and Drive Systems
, Vol. 
16
No. 
1
, pp. 
657
-
672
, doi: .
Omran
,
M.M.
,
Aziz
,
V.
and
Youssef
,
K.
(
2019
), “
Energy efficient lighting system
”,
2019 21st International Middle East Power Systems Conference (MEPCON)
, pp. 
307
-
310
,
available at:
 https://10.1109/MEPCON47431.2019.9008179
Oster
,
C.V.
,
Strong
,
J.S.
and
Zorn
,
C.K.
(
2013
), “
Analyzing aviation safety: problems, challenges, opportunities
”,
Research in Transportation Economics
, Vol. 
43
No. 
1
, pp. 
148
-
164
, doi: .
Pagden
,
M.
,
Ngahane
,
K.
and
Amin
,
M.S.R.
(
2020
), “
Changing the colour of night on urban streets - LED vs. part-night lighting system
”,
Socio-Economic Planning Sciences
, Vol. 
69
, 100692, doi: .
Purushothaman
,
M.B.
and
Aguas
,
A.B.
(
2025
), “
Cognitive biases that shape the drivers and barriers to embracing green construction practices
”,
Smart and Sustainable Built Environment
, Vol.
ahead-of-print No. ahead-of-print
, doi: .
Purushothaman
,
M.B.
,
Elenzano
,
D.
,
GhaffarianHoseini
,
A.
and
Ghaffarianhoseini
,
A.
(
2025
), “
Dynamic scheduling: influential and influenced factors and their interrelationships in the New Zealand construction industry
”,
Smart and Sustainable Built Environment
, Vol. 
ahead-of-print
 
No. ahead-of-print
, doi: .
Ramljak
,
I.
and
Tokić
,
A.
(
2020
), “
Harmonic emission of LED lighting
”,
AIMS Energy
, Vol. 
8
No. 
1
, pp.
1
-
26
, doi: .
Różowicz
,
A.
,
Wachta
,
H.
,
Baran
,
K.
,
Leśko
,
M.
and
Różowicz
,
S.
(
2022
), “
Arrangement of LEDs and their impact on thermal operating conditions in high-power luminaires
”,
Energies
, Vol. 
15
No. 
21
, 8142, doi: .
Samarasekara
,
H.M.S.N.
,
Purushothaman
,
M.B.
,
Rotimi
,
F.E.
and
Ghaffarian Hoseini
,
A.
(
2025
), “
A system dynamics framework for whole life costing in seismic and climate-sensitive residential construction in New Zealand
”,
Smart and Sustainable Built Environment
, Vol. 
ahead-of-print
 
No. ahead-of-print
, pp.
1
-
52
, doi: .
Sánchez-Balvás
,
L.A.
,
de Felipe
,
J.J.
,
Quintero
,
J.M.
and
de la Fuente
,
A.
(
2021
), “
An energy efficiency-based classification approach for street lighting by considering operational factors: a case study of Barcelona
”,
Energy Efficiency
, Vol. 
14
No. 
1
, p.
15
, doi: .
Selçuk
,
A.A.
(
2019
), “
A guide for systematic reviews: PRISMA
”,
Turkish Archives of Otolaryngology
, Vol. 
57
No. 
1
, pp. 
57
-
58
, doi: .
Skarżyński
,
K.
and
Wiśniewski
,
A.
(
2024
), “
The reflections on energy costs and efficacy problems of modern LED lamps
”,
Energy Reports
, Vol. 
12
, pp. 
4926
-
4937
, doi: .
Sreenath
,
S.
,
Sudhakar
,
K.
and
Yusop
,
A.F.
(
2021
), “
Sustainability at airports: technologies and best practices from ASEAN countries
”,
Journal of Environmental Management
, Vol. 
299
, 113639, doi: .
Sudjoko
,
R.I.
,
Hartono
,
Hariyadi
,
S.
and
Suwito
(
2021
), “
Design and simulation of airfield lighting system using 8 luminaire in airfield lighting laboratory at politeknik penerbangan surabaya
”,
Journal of Physics: Conference Series
, Vol. 
1845
No. 
1
, 012034, doi: .
Tai
,
H.-D.
,
Wang
,
Y.
,
Chan
,
P.-W.
,
Zhuang
,
Z.-B.
,
Wang
,
W.-H.
and
Liu
,
H.-W.
(
2025
), “
Nighttime measurement errors in the runway visual range and optimization of runway lighting systems
”,
Lighting Research and Technology
, Vol. 
57
No. 
3
, pp. 
278
-
291
, doi: .
Taylor
,
J.
and
Freyssinier
,
J.P.
(
2022
), “
Research: improving airport safety: new research on drone-based photometry
”,
Lighting Design + Application
, Vol. 
52
No. 
5
, pp. 
54
-
56
, doi: .
Valetti
,
L.
,
Piccablotto
,
G.
,
Taraglio
,
R.
and
Pellegrino
,
A.
(
2023
), “
Long-term monitoring campaign of LED street lighting systems: focus on photometric performances, maintenance and energy savings
”,
Sustainability
, Vol. 
15
No. 
24
, 16910, doi: .
Velásquez
,
C.
,
Espín
,
F.
,
Castro
,
M.Á.
and
Rodríguez
,
F.
(
2024
), “
Energy efficiency in public lighting systems friendly to the environment and protected areas
”,
Sustainability
, Vol. 
16
No. 
12
, 5113, doi: .
Vorozhikhin
,
V.V.
,
Moreva
,
E.L.
,
Starovoytov
,
V.G.
and
Tyutyunnik
,
I.G.
(
2019
), “
Possibility of using in Russia the experience of LED lighting application at the USA airfields
”,
Light Engineering
, Vol. 
27
No. 
2
, pp. 
71
-
77
, doi: .
Wagiman
,
K.R.
,
Abdullah
,
M.N.
,
Hassan
,
M.Y.
,
Mohammad Radzi
,
N.H.
,
Abu Bakar
,
A.H.
and
Kwang
,
T.C.
(
2020
), “
Lighting system control techniques in commercial buildings: current trends and future directions
”,
Journal of Building Engineering
, Vol. 
31
, 101342, doi: .
Wingelaar-Jagt
,
Y.Q.
,
Wingelaar
,
T.T.
,
Riedel
,
W.J.
and
Ramaekers
,
J.G.
(
2021
), “
Fatigue in aviation: safety risks, preventive strategies and pharmacological interventions
”,
Frontiers in Physiology
, Vol. 
12
, 712628, doi: .

Languages

or Create an Account

Close Modal
Close Modal