The implementation of the European Union's Level(s) framework at Level 3 – focused on in-use performance – is hindered by fragmented tools and a lack of integrated digital workflows. To bridge this gap, this study proposes and develops a prototype Collaborative Digital Platform (CDP) designed specifically to address Level 3 requirements by integrating Building Information Modeling (BIM), Internet of Things (IoT), Digital Twin and Artificial Intelligence (AI) components.
Employing a Design Science Research methodology, the study conceptualizes, architects and demonstrates a functional CDP prototype. The platform is built using a modular, openBIM-based architecture to enable the merging of static design data with dynamic operational data streams.
The developed prototype successfully demonstrates the technical feasibility of integrating BIM, simulated IoT sensor data and a rule-based AI interface within a unified dashboard. It provides a proof-of-concept workflow for visualizing key Level 3 indicators – specifically operational energy use, carbon emissions and indoor environmental quality – in near real time. The findings highlight the platform's potential to support data-informed monitoring and enhance transparency for sustainability reporting.
The study provides a replicable architectural template and a functional prototype, demonstrated via a tutorial residential building case study. This foundational work offers a concrete starting point for developers and researchers aiming to build digital tools for Level(s) compliance and establishes a basis for future pilot deployments, empirical validation and the development of automated compliance-checking features.
The primary contribution of this research is a novel, problem-specific digital architecture designed explicitly to operationalize the reporting requirements of the EU Level(s) framework at Level 3. While the constituent technologies are established, their purposeful synthesis into a cohesive platform blueprint addresses a distinct gap in translating policy-led sustainability assessment into practical, integrated digital workflows.
1. Introduction
The built environment is a major contributor to global environmental impacts, accounting for nearly 40% of global energy consumption and 36% of CO2 emissions (IEA, 2023). As climate change accelerates, the urgency to decarbonize buildings has intensified under international agreements such as the Paris Climate Accord and regional frameworks like the European Green Deal. In response, the European Commission introduced the Level(s) framework, a voluntary reporting tool designed to harmonize sustainability metrics and drive lifecycle-based decision-making across Europe's construction sector (European Commission, 2020).
Level(s) emphasizes circularity and life cycle performance across three stages of a building's development. Level(s) is structured around six macro-objectives: (1) greenhouse gas emissions over a building's life cycle, (2) resource-efficient and circular material life cycles, (3) efficient use of water resources, (4) healthy and comfortable indoor environments, (5) resilience to climate change and (6) life cycle cost and value optimization (Dodd et al., 2017; European Commission, 2020; Rastegari et al., 2025). Each macro-objective is operationalized through a set of core and optional indicators to be used across three levels of increasing complexity and detail. Level(s) is structured into three levels of assessment complexity. Level 1 involves conceptual design for the building project, entailing early stage qualitative assessments. Level 2 comprises detailed design and the construction of the building, entailing the quantitative assessments, and Level 3 encompasses the as-built and in-use performance of how the building performs after completion and handover to the client, entailing the monitoring and surveying of activity. Of these, Level 3 represents the most technically demanding tier, challenging the integration of continuous, real-world performance data. While the framework itself is technology-agnostic, achieving its objectives for holistic, lifecycle-based reporting creates a clear operational demand for integrated digital solutions such as Building Information Modeling (BIM), Internet of Things (IoT), Digital Twins (DTs) and Artificial Intelligence (AI) that can seamlessly combine planned performance data (e.g., from BIM) with actual operational data (e.g., from IoT sensors) (Dodd et al., 2021). Furthermore, compared to other sustainability frameworks such as BREEAM or LEED, which emphasize design-time scoring, Level(s) uniquely incorporates post-occupancy feedback, aligning better with circular economy principles through indicators like operational carbon, indoor air quality and lifecycle cost (Ferrari et al., 2022). Despite its potential, Level 3 adoption remains limited due to challenges such as data fragmentation, lack of interoperability and underutilized post-construction BIM models (Hosamo et al., 2023; Xu et al., 2024). These limitations delay regulatory compliance, reduce transparency and impede lifecycle optimization – all of which undermine the EU's broader sustainability goals. Furthermore, small residential buildings, such as the one used in this study, often fall outside the scope of large-scale digital innovation. However, they constitute a significant portion of the EU's building stock and frequently face the highest barriers to adopting Level 3 practices due to cost, complexity and technical fragmentation.
To effectively close the “performance gap” between design intent and actual in-use performance (De Wilde, 2014; Petri et al., 2023; Skidmore et al., 2024), Level 3 implementation necessitates a shift from static, snapshot assessments to dynamic, data-driven monitoring. While the Level(s) framework itself is technology-agnostic, achieving its ambition for holistic, lifecycle-based reporting creates a clear demand for integrated digital solutions that can seamlessly combine planned performance data (e.g., from BIM) with actual operational data (e.g., from IoT sensors).
A significant body of research has developed sophisticated digital tools to address aspects of building performance monitoring and sustainability assessment. Recent studies can be categorized by their primary technological focus and scope:
DTs for Operational Intelligence: Research by Cespedes-Cubides and Jradi (2024), Ghansah (2025) and Kang and Mo (2024) demonstrates the value of DTs for intelligent monitoring, predictive maintenance and enhancing real-time data connectivity. However, these studies often focus on optimizing specific systems (e.g., HVAC, structural health) and are largely technology-centric and framework-agnostic, not explicitly designed to compute or report against a multi-indicator regulatory framework like Level(s).
Cloud-BIM and Data Management Platforms: Work by Piras et al. (2025) and Samaro et al. (2025) advances cloud-BIM environments for integrated data management, risk assessment and collaborative workflows. These contributions are crucial for handling complex building data but are predominantly focused on the design and construction phases. Their application to the continuous, post-occupancy performance tracking required by Level 3 remains underexplored.
AI-Driven Interfaces for Occupant Engagement: Studies by Yitmen et al. (2025) and Gordo-Gregorio et al. (2025) highlight the potential of AI-driven interfaces to enhance occupant interaction, comfort and system efficiency. While pioneering in user-centric control, these interfaces are typically domain-specific [e.g., targeting energy or indoor environmental quality (IEQ)] and are not architected to serve as a central portal for holistic sustainability indicator reporting and stakeholder dialogue.
Integrated Assessment and Digitization Tools: Research by Spudys et al. (2025) and commercial tools like One Click LCA represent important progress in digitizing lifecycle assessments (LCA) and integrating audit data. A key limitation, however, is that these often function as standalone calculation engines. They require manual data transfer from other sources [e.g., BIM, Building Management Systems (BMS)], creating fragmented workflows that undermine the “real-time” and integrated data environment envisioned for effective Level 3 compliance (De Wolf et al., 2023).
This analysis reveals a persistent gap: while excellent tools exist for isolated domains or singular aspects of sustainability, a critical disconnect remains between these technological advancements and the integrated, policy-driven reporting needs of Level 3. What is lacking is a unified, purpose-built platform explicitly architected to operationalize the multi-indicator, lifecycle-oriented and stakeholder-collaborative assessment philosophy central to Level 3. Therefore, the core research gap this study addresses is the lack of a purpose-built Collaborative Digital Platform (CDP) that synthesizes BIM, IoT, DT and AI into a cohesive system blueprint, designed from first principles to translate the Level(s) framework's reporting requirements into a functional, integrated digital workflow.
A critical gap persists when viewed through the specific lens of Level 3 compliance. Existing platforms and research prototypes often focus on isolated domains (e.g., energy management, structural health) or singular aspects of sustainability. What remains underdeveloped is a unified, interoperable platform explicitly architected to operationalize the multi-indicator, stakeholder-collaborative and continuous assessment thinking central to Level 3. Key shortcomings include:
Fragmented Workflows: Tools frequently operate in silos, requiring manual data transfer between BIM models, sensor networks and analysis software, which undermines the “real-time” potential and increases error (Dodd et al., 2021; De Wolf et al., 2023).
Lack of Holistic Indicator Integration: Few platforms are designed to concurrently compute, visualize and report on the interconnected set of Level 3 indicators – such as operational energy use (Indicator 1.2), lifecycle global warming potential (Indicator 2.1) and IEQ (Indicator 3.1) – from a single, synchronized data environment.
Limited Built-in Stakeholder Engagement: While dashboards exist, integrated mechanisms to facilitate collaboration and understanding among diverse stakeholders (e.g., facility managers, designers, occupants) through intuitive interfaces like AI-driven assistants are not commonly embedded within sustainability compliance platforms.
This study aims to bridge the identified gap by developing and demonstrating a prototype CDP. This platform is designed to support the implementation of Level 3 indicators within the EU Level(s) framework by integrating BIM, IoT, DT and AI to enable real-time environmental monitoring, lifecycle performance assessment and basic stakeholder interaction.
The scope of the research is limited to the conceptualization and prototyping of the CDP within a simulated environment. Implementation includes a backend simulator for synthetic sensor data, integration of a BIM-based model, real-time visualization via a web dashboard and the development of a basic AI chatbot. Full-scale deployment, third-party testing and comprehensive circularity assessments are outside the scope of this work but are identified as critical directions for future research. To fulfill the aim, the study pursues the following objectives:
Develop a CDP architecture integrating BIM, IoT sensors, DT environment and AI services using openBIM standards
Enable real-time monitoring and visualization of key Level 3 sustainability indicators – IEQ, Energy Use Intensity (EUI) and carbon emissions.
Initiate basic predictive features (e.g., anomaly detection logic and simulated forecasting scenarios) using rule-based thresholds rather than fully automated predictive analytics.
Facilitate multi-stakeholder engagement through an interactive dashboard and a conversational AI chatbot capable of basic natural language queries.
Based on the purpose of the study, the following three research questions are posed:
Primary Research Question:
How can a CDP integrating BIM, IoT, DTs and AI enable real-time monitoring and compliance with Level 3 indicators of the EU Level(s) framework?
Operational Sub-Questions:
What data structures and interoperability standards are required to integrate static BIM data with dynamic IoT sensor streams?
How can real-time environmental and operational data be processed to compute Level 3 KPIs?
What architectural components and protocols ensure secure, scalable and transparent data exchange across the CDP?
How can stakeholder interaction be enhanced through AI-driven interfaces for sustainability decision-making?
The rest of the study is organized as follows. Section 2 provides the methods used for the study covering Design Science Research (DSR) methodology, process model, system architecture and a case study. Section 3 presents the results of the case study, including identified requirements, real-time data integration, energy performance monitoring, carbon emission tracking and prototype dashboard. Section 4 provides a comprehensive discussion of the theoretical and practical implications, and finally, in Section 5, the study is concluded together with the achievements and recommendations for future research.
2. Methods
This section outlines the methodological framework used to develop the CDP, grounded in the DSR approach. DSR is particularly suitable for constructing innovative artifacts to solve real-world problems. In this context, the artifact refers to the CDP prototype developed to address Level 3 requirements under the EU Level(s) framework.
The methodology involves four structured phases: (1) problem identification and motivation, (2) objective definition, (3) design and development and (4) demonstration. These phases guide the end-to-end creation of the CDP, from defining sustainability challenges and stakeholder needs to demonstrating the prototype within a simulated environment.
The case study component involves a tutorial model of a small residential building conceived in Autodesk Revit and its 3D-printed physical (1:100 scaled) representation for hosting the sensors and the CDP. The CDP is connected to synthetic sensor data through a backend simulator. Outdoor real-time environmental data, such as temperature and humidity, are retrieved via application programming interface (API) integration with OpenWeather services, while indoor real-time environmental data (temperature, humidity and lighting intensity) are gathered through sensors placed in the scaled model. These elements form a controlled testbed to evaluate the CDP's performance in real-time monitoring, Level 3 indicator visualization and stakeholder interaction.
2.1 Design Science Research
The research methodology adopted in this study follows the structured steps outlined in the DSR approach. DSR is centered on addressing real-world challenges by developing an artifact within the research context (Peffers et al., 2007). The primary outcome of DSR, known as an artifact, can take various forms, including constructs, models, methods and instantiations (Hevner et al., 2004). Constructs serve as the foundational language for problem formulation, incorporating terms, notations and definitions necessary for identifying possible solutions (Johannesson and Perjons, 2021). Models utilize these constructs to represent practical problems and their corresponding solutions (Johannesson and Perjons, 2021). Methods establish structured guidelines and processes to facilitate problem-solving and goal attainment (Johannesson and Perjons, 2021). Instantiations demonstrate the feasibility of constructs, models or methods by implementing them in functional prototype systems (Hevner et al., 2004). Since this study applies the DSR methodology within the domain of information systems and particularly focuses on BIM, the research output is classified as a BIM artifact (Kehily and Underwood, 2015), specifically falling under the category of method artifact (Hevner et al., 2004).
2.1.1 Process model
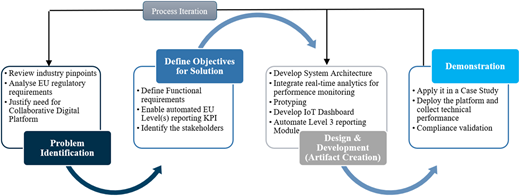
The development of a CDP to support EU Level(s) – Level 3 reporting begins with a comprehensive problem identification and motivation phase. This phase aims to highlight existing gaps in digital solutions that hinder effective environmental performance reporting across the building lifecycle. A critical review of industry practices revealed that one of the major pain points is the lack of interoperability between as-built BIM data and in-use performance data collected via IoT devices or BMS. This disconnection limits the capacity to monitor and manage operational performance effectively. Furthermore, an analysis of the European regulatory framework, specifically the Energy Performance of Buildings Directive and the Construction Products Regulation, demonstrated a growing demand for tools that enable transparent and standardized environmental performance tracking. These findings justify the need for a CDP that integrates BIM and IoT data to facilitate ongoing performance monitoring and regulatory compliance.
The next step involves defining clear and measurable objectives for the proposed solution. The primary goal here is to establish the technical and functional requirements necessary to support automated EU Level(s) reporting. Key functionalities include the integration of as-built data models or with in-use performance data sourced from sensors and BMS platforms. These integrated datasets will support the computation and reporting of Level 3 indicators, particularly energy use, carbon emissions and IEQ. To ensure relevance and usability, the study identifies and involves key stakeholders – including contractors, facility managers and policymakers – who each have unique data needs and roles in the building lifecycle and regulatory landscape.
Once the objectives are clearly defined, the design and development phase focuses on creating a proof-of-concept (PoC) digital platform. The system architecture is cloud-based, enabling scalable and flexible integration of BIM and IoT data through the use of open standards like Industry Foundation Classes (IFC) and APIs. This architecture supports real-time data processing and analytics, allowing users to monitor performance metrics dynamically. As part of the prototyping effort, an IoT dashboard is developed to visualize operational data such as energy consumption, temperature and air quality. Additionally, an automated reporting module is built to generate compliance-ready reports aligned with Level 3 indicators, reducing the manual effort typically associated with environmental performance reporting.
The final phase involves the demonstration and evaluation of the CDP prototype in a controlled, simulated context. This was achieved by applying the CDP to a tutorial case study where both as-built BIM data and simulated/scale-model sensor data were accessible. The CDP prototype was deployed in this testbed to assess its technical functionality, including data integration, latency and system responsiveness. More importantly, a compliance alignment assessment was conducted within this simulated environment to explore the CDP's capability to support reporting on key Level 3 indicators of the EU Level(s) framework. The assessment focused on three core indicators: operational energy use (Indicator 1.2), lifecycle global warming potential (Indicator 2.1) and IEQ (Indicator 3.1). Real-time energy and IEQ data were simulated and benchmarked against predefined thresholds, while embodied and operational carbon values were calculated using BIM-based material quantities and Environmental Product Declarations (EPDs). Although performed in a virtual testbed, the validation demonstrated the CDP's capability to support automated data monitoring, visualization and compliance feedback for Level 3 reporting. The process model involving problem identification, defining objectives for the solution, design and development and demonstration is depicted in Figure 1.
2.1.2 System architecture of CDP prototype
2.1.2.1 Technological frameworks and orchestration
The CDP was implemented using a modular architecture built on Node.js for backend orchestration, complemented by several specialized frameworks and libraries:
Backend and API Layer:
Express.js was used to structure RESTful APIs for data exchange between the platform components.
Socket.IO enabled real-time bidirectional communication for dynamic sensor updates and dashboard synchronization.
Data Handling and Persistence:
MongoDB served as the primary database, accessed via Mongoose ORM for schema enforcement and query optimization.
Data ingestion pipelines were implemented using PyMongo for initial BIM-to-JSON conversion and storage.
BIM Data Processing and Visualization:
BIM models were exported in IFC format from Autodesk Revit.
IfcOpenShell (Python library) was used to parse IFC files and extract entities such as IfcWall, IfcSpace and IfcMaterial.
Extracted data were transformed into JSON documents and mapped into MongoDB collections for semantic alignment.
Visualization of BIM geometry in the dashboard was achieved using Three.js, which rendered lightweight 3D models converted from IFC to glTF format via IfcConvert.
Frontend and Dashboard:
The interactive dashboard was developed using React.js for component-based rendering and Chart.js for KPI visualization.
Real-time updates were handled through Socket.IO integration with the backend.
AI Integration:
A rule-based chatbot was implemented using OpenAI key for GPT 4o-mini for natural language processing (NLP), connected to the backend via REST APIs for query resolution.
2.1.2.2 Data extraction and storage workflow
To operationalize BIM data within the CDP, the as-built model created in Autodesk Revit is exported using openBIM standards in IFC format. The extraction process focuses on key entities relevant to Level 3 indicators, including:
IfcWall, IfcWindow and IfcDoor for material specifications and thermal properties.
IfcSpace for occupancy assumptions and spatial classifications.
IfcMaterial and IfcQuantityTakeOff for embodied carbon calculations.
The IFC file is parsed using IfcOpenShell and converted into structured JSON documents through a Python-based pipeline. Each JSON document represents a semantic grouping (e.g., spaces, materials, components) and is mapped into dedicated MongoDB collections such as:
spaces (fields: space_id, area, occupancy, thermal_properties)
materials (fields: material_id, EPD_reference, embodied_carbon)
1 {
2 “component_id”: “WALL_001”,
3 “type”: “Ifcwall”,
4 “material”: “Concrete”,
5 “U_value”: 0.35,
6 “quantity_m2”: 12.5,
7 “embodied_carbon”: 87.5
8 }
components (fields: component_id, type, U_value, quantity).
An example of a JSON snippet for a wall component:
2.1.2.3 Indexing strategy
MongoDB collections are indexed on component_id and material_id for fast retrieval during KPI computation. Compound indexes (e.g., {type, U_value}) are used for queries related to thermal performance.
2.1.2.4 Interfaces and contracts
Data exchange between the parsing pipeline and MongoDB occurs via the PyMongo driver, ensuring schema validation through JSON Schema contracts. The backend Node.js service interacts with MongoDB using Mongoose ORM, enforcing consistency across API endpoints.
2.1.2.5 AI integration and technical details
The AI component of the CDP was designed to enhance stakeholder interaction and support sustainability decision-making through natural language queries and automated KPI feedback. The implementation involved the following:
Type of AI Used:
The platform employs NLP and rule-based reasoning for chatbot functionality. While the current prototype does not use full-scale generative AI, exploratory tests were conducted with Large Language Models (LLMs) such as OpenAI GPT-4o mini to evaluate their potential for automated reporting and contextual assistance.
Prompting Techniques and Evaluation:
Different prompting strategies were tested, including zero-shot and few-shot prompts, to assess response accuracy and relevance for Level(s) indicators. Comparisons were made based on query success rate, response latency and semantic correctness against predefined benchmarks derived from Level 3 documentation.
Interface Integration:
The AI-assisted component is embedded in the interactive dashboard as a chatbot panel, enabling users to query sustainability indicators, request compliance checks and receive contextual explanations. The chatbot communicates with the backend via REST APIs and retrieves data from MongoDB collections to provide real-time answers.
Future Enhancements:
While the current implementation is rule-based, future iterations will integrate ontology-driven reasoning and generative AI models for automated compliance reporting and predictive analytics.
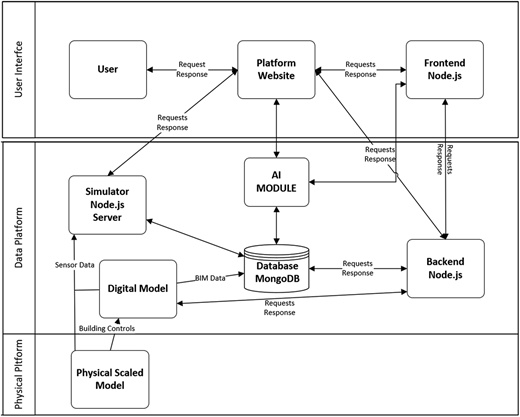
The proposed CDP architecture integrates BIM, IoT data and AI to enable dynamic monitoring and sustainability assessment aligned with the EU Level(s) framework. The architecture is structured into two principal layers: the User Interface layer and the Data Platform layer, each comprising multiple interoperable components that collectively support real-time data interaction, performance analysis and user engagement.
At the User Interface layer, the User interacts with the system through a web-based Platform Website, which acts as the primary access portal for visualization, queries and decision support. This interface is powered by a Frontend Node.js service that handles rendering and asynchronous communication. Notably, an AI module is embedded at this layer, enabling intelligent interactions such as chatbot-assisted queries, predictive reporting interfaces and user-specific performance recommendations. The AI module receives processed data from the backend and database, and dynamically augments the frontend interface with contextualized insights, thereby enhancing decision-making and user experience.
The Data Platform layer handles data acquisition, processing, storage and simulation. Sensor Data from the Physical Asset is captured in real time by a Simulator Node.js Server, which forwards the data to a centralized MongoDB Database. This database also stores BIM data and performance parameters from the Digital Model, enabling a unified repository for both as-built and in-use information. The Backend Node.js service acts as a middleware, managing data flow between the digital model, the frontend and the AI module. It also processes analytical requests and communicates directly with the AI service to support automated KPI evaluation based on Level 3 indicators (e.g., operational energy use, lifecycle carbon emissions, IEQ).
The AI module serves a dual function: it operates at the backend to perform data-driven analytics such as anomaly detection, energy forecasting and lifecycle assessment, while also interfacing with the frontend to support user-driven queries and visualization. The placement of the AI component across both layers supports a closed-loop feedback mechanism, allowing for real-time control strategies to be implemented through the simulator and reflected in the physical asset. Feedback from the digital model (e.g., energy simulation or carbon footprint analysis) is continuously updated in the database, ensuring synchronization between virtual and physical representations.
In summary, this modular and scalable architecture facilitates a smart, AI-assisted, BIM-integrated digital platform that enables real-time monitoring, decision support and sustainability benchmarking for the built environment. The system supports dynamic KPI reporting and stakeholder collaboration, meeting the functional and regulatory expectations outlined in the EU Level(s) framework, particularly at Level 3 operational performance assessment. The system architecture of the CDP involving the overall framework for conceptual data workflow is depicted in Figure 2.
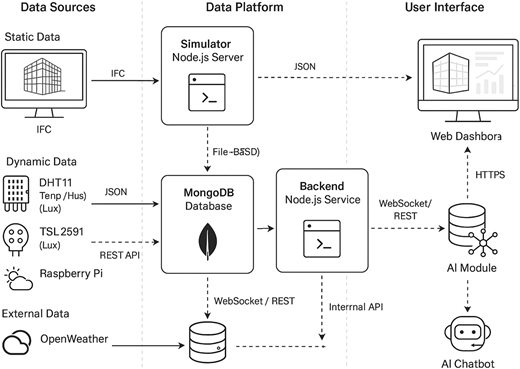
Figure 3 illustrates the end-to-end workflow of the CDP, showing how static and dynamic data sources are integrated through the data platform and presented to users via an interactive interface. Static BIM data in IFC format flows from the design model into the MongoDB database, while dynamic sensor readings and external weather data are transmitted in JSON format via REST APIs. These inputs are processed by the backend Node.js service and AI module using WebSocket and internal API protocols to enable real-time KPI computation and anomaly detection. The user interface layer, comprising a web dashboard and an AI chatbot, communicates through HTTPS and WebSocket protocols to provide visualization, compliance feedback and natural language interaction. Solid arrows represent static flows, and dashed arrows indicate dynamic flows, with each interface annotated by its respective data format and protocol to ensure transparency and interoperability.
2.1.3 Evaluation approach for the prototype
Given the prototype nature of this research conducted within a DSR paradigm, a formal evaluation with real-world performance metrics (e.g., annual energy savings, user acceptance scores) was outside the scope of this initial development cycle. Instead, the evaluation was designed to demonstrate technical feasibility and core functional integration against the specific objectives outlined in Section 1. The success of the CDP prototype was assessed based on the following demonstrable criteria:
Functional Integration: Successful bi-directional data flow between all core modules (BIM parser, IoT simulator, database, backend API, frontend dashboard and AI chatbot).
Data Interoperability: Ability to ingest, map and store heterogeneous data formats (IFC, JSON from APIs/simulators) into a unified database schema without manual intervention in the pipeline.
Real-time Visualization: Demonstration of live updating of sensor data and simulated KPIs on the web dashboard with a latency of less than 5 s, indicating a functional real-time communication layer (WebSocket/REST).
KPI Computation and Visualization: Successful derivation and display of the targeted Level 3 indicators (EUI, operational/embodied carbon estimates, IEQ parameters) from the integrated data streams.
Stakeholder Interaction Interface: Operational functionality of the AI chatbot to respond to predefined natural language queries about the platform and the displayed data.
This evaluation is qualitative and demonstrative, focusing on “proof-of-existence” for the proposed architecture. It provides the necessary validation for the design artifact (the CDP framework) within a DSR cycle, establishing a foundation for future cycles involving real-world deployment and rigorous empirical evaluation.
2.1.3.1 Simulated validation environment and case study
To demonstrate the CDP prototype within a controlled yet realistic context, a simulated validation environment was constructed. This environment served as a PoC testbed, not a real-world Level 3 deployment. Its purpose was to isolate and test the platform's core integration logic and data workflows without the confounding variables and high costs of a full-scale building installation.
The testbed consisted of two interconnected components:
A Digital Building Model: A detailed BIM model of a generic small residential unit was created in Autodesk Revit to provide the static, as-designed data (geometry, materials, thermal properties).
A Physical Sensor Hub: A scaled (1:100), 3D-printed physical model of the digital design was fabricated. This model housed a simplified sensor array (DHT11 for temperature/humidity, Adafruit TSL2591 for light), and a polykristallin solar cell (for solar energy tracking) connected to a Raspberry Pi 5 that served as the local backend, collecting sensor data and exposing it via REST APIs. This setup provided a source of genuine, albeit micro-environmental, real-time sensor data streams.
Critical Simulation Parameters: To evaluate the platform's handling of operational data, key parameters were simulated:
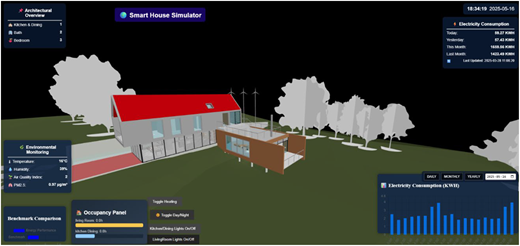
Energy Data: A custom Node.js “smart-house simulator” generated synthetic energy consumption streams based on variable occupancy profiles, providing a consistent and controllable data source for testing the energy KPI modules as shown in Figure 4. Insight generated operational EUI projections and calculated embodied carbon values by linking modeled elements to EPDs from the EC3 database.
Stakeholder Interaction: User needs and queries were simulated during development to inform the AI chatbot's rule base. No external stakeholders were involved in testing at this stage.
This hybrid (digital-physical-simulated) approach allowed for the demonstration of the end-to-end data pipeline – from static BIM extraction and dynamic sensor ingestion through to KPI computation and dashboard visualization – in a manageable, repeatable laboratory setting. It conclusively shows how the CDP would function, providing the necessary validation to proceed to the next DSR cycle involving pilot deployment and evaluation with real users and buildings.
3. Results
This section presents the results from the design, development and demonstration of the proposed CDP. The evaluation focused on assessing the CDP's ability to process and visualize both static BIM-derived data and real-time environmental inputs in alignment with selected Level 3 indicators of the EU Level(s) framework.
3.1 Identified requirements of the CDP
The development of the CDP aligned with the EU Level(s) Level 3 framework successfully achieved several key outcomes. Identified requirements and corresponding capabilities of the CDP aligning with Level(s) 3 framework are provided in Table 1.
3.2 Real-time data integration and simulation workflow
The CDP's data integration capability was demonstrated using a hybrid data source. Real-time environmental data (temperature, humidity, light) was captured from sensors embedded in the 3D-printed physical model of the case study building, providing a genuine, small-scale data stream. Specifically, a DHT11 sensor was used to measure temperature and humidity, and an Adafruit TSL2591 lux sensor captured indoor light intensity. These sensors were connected to a Raspberry Pi 5, and the data were accessed via HTTP endpoints and RESTful APIs hosted on a local server. To test the platform's handling of operational building data – which was not available from a real building – a simulated energy data stream was generated in Revit.
Simulation Logic and Purpose: A custom Node.js simulator was developed to produce synthetic, time-series energy consumption data. This approach allowed for controlled testing of the dashboard's visualization and processing logic under variable conditions. For the demonstration, a simple scenario was created: energy use was modeled to increase proportionally with simulated occupancy. The baseline was set at 88 kWh/day for an occupancy of 4 persons, rising to 127 kWh/day for 8 persons. These values are not validated predictions but were chosen as plausible, order-of-magnitude figures for a small residential unit to demonstrate the platform's dynamic graphing and scenario comparison features. The core result is the platform's successful ingestion and real-time plotting of this synthetic data stream alongside live sensor data.
3.3 Energy performance visualization and reference data integration
The platform's ability to incorporate and display static design-phase data was demonstrated using outputs from Autodesk Insight. The BIM model of the case study building was processed in Insight, which generated reference values for annual EUI based on standard climate data and default assumptions.
Role of Insight Data in the Demo: The Insight-derived EUI served as a static benchmark layer within the dashboard. The simulated operational data (Section 3.2) was visualized alongside this benchmark, as shown in Figure 5. This side-by-side visualization is a core functionality of the platform, intended to allow users to compare design intent with actual or simulated operation. The result is not a validation of the energy model but a successful demonstration of the CDP's capability to integrate and co-visualize disparate data types (static benchmarks and dynamic streams) relevant to Level 3 Indicator 1.2 (Operational Energy Use).
3.4 Carbon emissions data handling and scenario visualization
The platform's module for lifecycle carbon assessment was populated with data sourced from Autodesk Insight's embodied carbon calculator. Insight linked elements in the BIM model to generic EPDs from the EC3 database to compute totals.
Presentation of Carbon Data: For demonstration purposes, the platform visualized the output of two material scenarios processed by Insight:
Scenario A (Baseline): Embodied carbon = 87,004 kgCO2-eq
Scenario B (Alternative Glazing): Embodied carbon = 64,566 kgCO2-eq
Important Clarification on Carbon Values: These values represent the total estimated embodied carbon for all building elements in the tutorial model as calculated by Insight. They are presented here solely to demonstrate the platform's ability to import, store and visually compare different design scenarios as seen in Table 2. The absolute values are not intended to represent a realistic assessment for a typical small residential building; they are artifacts of the tutorial model's specific composition and the tool's default database. The key finding is the functional workflow: the platform can receive such analysis outputs and present them for comparative assessment, addressing the data need for Level 3 Indicator 2.1 (Lifecycle GWP).
Operational Carbon Visualization: Similarly, the platform demonstrated a calculation workflow by applying a standard emission factor (e.g., 0.276 kgCO2/kWh for the Swedish grid) to the simulated energy data stream, producing a corresponding graph of estimated operational carbon emissions. This showcases the platform's ability to perform derivative calculations on integrated data streams to generate additional sustainability KPIs.
3.5 IEQ monitoring
The real-time IEQ monitoring functionality was implemented using the DHT11 and TSL2591 sensors. Temperature and humidity values were tracked and compared to EN 16798-1 comfort thresholds. The dashboard issued alerts when deviations occurred – e.g., indoor temperatures exceeded 21 °C, but CO2 levels and VOCs were not monitored due to hardware limitations. Lighting levels were also visualized, although no daylight dimming control system was implemented. This setup demonstrated basic compliance checking for Level 3 Indicator 3.1 using a simplified sensor array.
The platform successfully demonstrated the following:
Real-time visualization of sensor data from a physical 3D model.
Simulated operational energy scenarios based on occupancy assumptions.
Lifecycle carbon comparisons based on manual BIM-EPD matching.
IEQ monitoring using live temperature, humidity and lux level.
However, several limitations were noted, including the lack of semantic interoperability between data sources, latency in real-time updates and the absence of automated EPD integration. These findings are further discussed in the following sections on discussion, limitations and future work.
3.6 Interactive dashboard
The interactive dashboard serves as the frontend interface of the CDP, enabling real-time monitoring, scenario analysis and stakeholder interaction through four key components: static data, dynamic data, operational scenarios and an AI-integrated chatbot. It was developed using a custom Node.js-based architecture that connects both real sensor data and simulation outputs to the dashboard.
3.6.1 Static data
The static layer is derived from the Autodesk Revit BIM model and includes non-variable parameters such as material specifications, surface areas, U-values and occupancy assumptions. These were used as inputs for Autodesk Insight, which provided reference values for operational EUI and embodied carbon calculations. Material-linked EPDs were accessed through Insight's integration with the EC3 database, forming the baseline for lifecycle performance assessments. These static data points are visualized in the dashboard for benchmarking and cross-referencing with real-time sensor inputs.
3.6.2 Dynamic data
Dynamic data are captured from the 3D-printed physical prototype using embedded DHT11 sensors (for temperature and humidity) and an Adafruit TSL2591 sensor (for indoor light levels), all connected via a Raspberry Pi 5. Data are collected through REST APIs and displayed in real time on the dashboard. Environmental readings are continuously compared against comfort thresholds defined by EN 16798-1, with alerts triggered for deviations – such as overheating or insufficient illumination. This component supports Level 3 Indicator 3.1 on IEQ.
3.6.3 Operational scenarios
To simulate operational behavior, energy use data were generated through a smart-house simulator running on a backend Node.js server. These simulations reflected changes in energy consumption based on variables like occupancy count, HVAC logic and lighting schedules. The system demonstrated, for example, how daily energy usage increased from 88 kWh to 127 kWh when occupancy rose from four to eight people. These scenarios were visualized alongside insight-derived baselines to support understanding of Indicator 1.2 (Operational Energy Use). Although no physical smart meters were installed, this simulated approach offered a flexible way to model performance shifts.
3.6.4 Indoor environmental quality (IEQ)
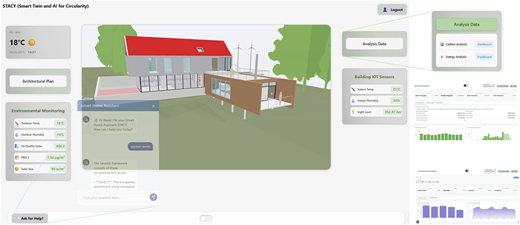
The platform displays real-time temperature and humidity data from connected IOT sensors. It visualizes deviations from EN 16798-1 thresholds, alerts occupants or facility managers, as seen in Figure 5.
3.6.5 AI-integrated chatbot on level 3 and connected database
The dashboard also features a basic AI-powered chatbot, as seen in Figure 5, which is trained using project-specific content and documentation from the Level(s) framework. It supports natural language queries on sustainability indicators, system status and dashboard functionalities. The chatbot provides contextual assistance – such as explanations of Indicator 2.1 (Lifecycle GWP) or tips on navigating the carbon analysis module – thereby enhancing stakeholder engagement. While current capabilities are rule-based and limited in scope, future enhancements could integrate generative AI models for automated reporting and deeper decision support.
3.7 Core demonstration findings
The integrated tests successfully demonstrated the following platform functionalities, which address the operational sub-questions:
Data Interoperability: Successful ingestion and mapping of IFC (BIM), JSON (sensor/simulator) and API-sourced (weather) data into a unified database.
KPI Computation and Visualization: Functional pipelines to derive and display metrics for Energy Use, Carbon Emissions (embodied and operational) and IEQ parameters (temperature, humidity, light).
Real-time Dashboard Operation: A working interface that updates dynamic data with low latency (<5s) and provides static reference data for context.
Scenario Comparison: Effective visualization of “what-if” scenarios (e.g., material choice, occupancy change) by comparing different data sets on a common dashboard.
The platform did not perform automated compliance verification or generate quantitative performance scores against Level 3 thresholds. The current result is a proven, functional data integration and visualization framework upon which automated assessment and compliance features can be built in future development cycles. Outcomes of the CDP Prototype as achieved functionalities are presented in Table 3, each tied directly to a design objective from Section 2 and a Level 3 indicator.
4. Discussion
4.1 Revisiting the research contribution in context
This study set out to explore how a CDP integrating BIM, IoT, DT and AI components could potentially support real-time monitoring and reporting aligned with Level 3 of the EU Level(s) framework. The primary outcome is a functional prototype developed through DSR, which demonstrates a possible architectural pathway for addressing known challenges in Level 3 implementation, such as data fragmentation and the disconnect between design intent and in-use performance.
The developed CDP is a PoC demonstrator, not a fully validated, field-tested system. The work is novel in its problem specificity – it is designed not for generic monitoring, but to directly map onto the macro-objectives and indicators (e.g., 1.2, 2.1, 3.1) of a significant European policy instrument. The specific modular architecture (detailed in Section 2.1.2) that prioritizes the bidirectional flow between static BIM data (for embodied impacts) and dynamic IoT/simulated data (for operational impacts) is designed explicitly for lifecycle assessment as required by Level(s). Embedding an AI-driven query interface (even in basic form) directly within the sustainability compliance dashboard is a novel approach to lowering the barrier for non-expert stakeholders (e.g., facility managers) to engage with Level 3 data, moving beyond visualization-only dashboards. The study provides a crucial translational bridge between high-level policy (Level(s) framework) and practical digital implementation. It moves the discussion from “what indicators are needed” to “how a digital system can be built to calculate and present them in an integrated manner.” The prototype simulates the technical workflows that would be necessary for these functions. For instance:
Interoperability was demonstrated in a controlled pipeline (IFC to JSON to database), but not across heterogeneous, real-world software ecosystems.
Anomaly detection was implemented as basic, rule-based threshold checking against static benchmarks, not through advanced predictive analytics or machine learning on operational histories.
Stakeholder engagement was facilitated through a rudimentary, rule-based chatbot interface within the dashboard, but was not evaluated with external users.
Therefore, the core contribution of this paper is not a novel theoretical extension of the Level(s) framework, nor is it a validated solution for Level 3 compliance. Rather, it is the design and demonstration of a prototype artifact that provides a tangible, integrative model for how key digital technologies (BIM, IoT, DT, and AI) can be architected to work together toward the goals of Level 3. This work translates the high-level requirements of Level 3 into a concrete, though preliminary, digital systems blueprint.
4.2 Interpretation of findings and their implications
The findings confirm the technical feasibility of integrating static BIM data with dynamic sensor streams (simulated and from a physical scale model) within a unified web-based dashboard. The platform successfully visualized data relevant to three core Level 3 indicators: EUI (Indicator 1.2), Lifecycle Global Warming Potential (Indicator 2.1) and IEQ (Indicator 3.1). This demonstrates a foundational capability for side-by-side visualization of design-phase benchmarks and (simulated) operational data – a crucial first step in bridging the design-use gap.
In response to the operational sub-questions:
Data structures and interoperability: The prototype employed a pragmatic pipeline using IFC and JSON, showing that semantic mapping into a common database (MongoDB) is a viable, though manual, first step. True semantic interoperability would require ontology adoption (e.g., ifcOWL, Smart Appliances REFerence Ontology (SAREF), Semantic Sensor Network (SSN)).
Real-time KPI computation: The system performed basic calculations (e.g., applying emission factors to energy data) and displayed live sensor readings, proving the concept of dynamic KPI derivation.
System architecture: A modular Node.js-based architecture using REST APIs and WebSockets proved effective for the demonstration, establishing a pattern for secure, scalable data flow.
Stakeholder interaction: The inclusion of a chatbot, while basic, illustrates a potential interface for lowering the technical barrier to accessing sustainability data.
The key implication is that the greatest challenge is not the individual technologies, but their purposeful integration within a workflow specifically designed for sustainability performance tracking. Our prototype serves as a concrete example of such integration, highlighting both its potential and the significant work remaining, particularly in automation, semantics and user-centric design.
4.3 Research and practical implications
Based on the PoC demonstration, the following potential implications and future pathways for research, practice and policy can be identified. Implications for research contributing to the body of knowledge include:
Providing a Potentially Replicable Design Artifact: The primary research contribution is a publicly documented, open-standards-based architectural blueprint for a Level(s)-oriented digital platform. This provides a concrete starting point for other researchers to replicate, critique, extend or compare against, advancing methodological discourse in digital sustainability tools.
Demonstrating a DSR Approach to Policy Implementation: The study serves as a detailed case example of applying DSR to translate high-level policy requirements (Level(s)) into a functional digital prototype. This contributes to the methodology of digitally enabled policy operationalization.
Identifying Specific Technical Challenges for Further Study: The work concretely identifies and demonstrates next-order research challenges, such as the need for:
Semantic Interoperability: Moving beyond file-based IFC/JSON mapping to ontology-driven (e.g., ifcOWL, SAREF) data integration.
Automated Compliance Logic: Developing rule engines and algorithms to automatically check KPI streams against Level(s) thresholds.
Generative AI for Reporting: Exploring LLMs for automated generation of compliance narratives from structured KPI data.
Implications for Practice (Pathways to Economic and Commercial Impact) include:
Potentially Offering a Development Template for Tool Vendors: The modular architecture demonstrates a viable technical approach for software companies aiming to develop or enhance commercial solutions for Level(s) compliance, reducing initial R&D uncertainty.
Reducing Conceptual Risk for Early Adopters: For forward-thinking contractors, asset owners or sustainability consultants, the prototype provides a tangible, functional model of what an integrated Level 3 monitoring system could look like, helping to justify internal pilot projects and investment.
Highlighting the “Integration” Business Case: The work underscores that the future commercial value lies not in new sensors or BIM software, but in platforms that seamlessly unite them. This clarifies the market need for interoperability-focused products and services.
Implications for Policy and Standardization include:
Potentially Informing “Digital Ready” Policy Design: The prototype demonstrates the technical prerequisites (e.g., openBIM data, structured sensor outputs) needed for any digital compliance tool. This evidence can inform policymakers and standards bodies (e.g., CEN, buildingSMART) in mandating or promoting specific data standards to make frameworks like Level(s) practically implementable.
Advocating for a “Compliance-by-Design” Workflow: The study visually makes the case for shifting sustainability reporting from a retrospective, document-based audit to a continuous, data-driven process embedded in building operations. This can influence policy thinking on updating certification schemes (e.g., EPCs) to accept dynamic data submissions.
Societal Implications (Long-term, Indirect Impact) include:
Suggesting a pathway toward enhanced transparency: If such platforms become widespread, they could provide auditable, real-time data on building performance to occupants, buyers and the public, increasing trust in sustainability claims and building certifications.
Contributing to Closing the Performance Gap: By providing tools to continuously compare design intent with actual operation, this line of research ultimately supports the societal goal of reducing the built environment's actual energy and carbon footprint, not just its designed one.
Raising Digital Literacy for Sustainability: The inclusion of an explanatory AI interface points toward a future where complex sustainability data is more accessible to non-experts, promoting broader engagement with environmental performance.
It is crucial to reiterate that these implications are forward-looking projections based on the technical feasibility demonstrated by the prototype. Their realization is contingent upon future research, development, pilot deployments and stakeholder adoption.
4.4 Limitations and grounding the claims
The limitations of this study are substantial and must be clearly acknowledged to ground its claims:
PoC, Not Validation: The demonstration was conducted in a simulated testbed by the authors. There was no real-world deployment, no third-party user testing and no verification of outputs against actual building performance data. Therefore, the study does not “validate” the platform for compliance use. It demonstrates the feasibility of the internal technical functionality and integration logic of the prototype within a laboratory setting. Claims about usability, reliability or accuracy in a regulatory context cannot be made.
Theoretical Contribution Scope: The work does not extend or refine the Level(s) framework theoretically. It operationalizes – in a very preliminary, technical sense – a subset of its Level 3 reporting requirements into a digital prototype. The contribution is in the applied translation of framework ambitions into a systems design, not in critiquing or advancing the framework's concepts.
Platform Capabilities: The prototype aggregates and visualizes data; it does not yet “bridge gaps” or “enable circularity” in an automated way. These are aspirational outcomes for which the prototype establishes a foundational technical basis.
4.5 Recommendations for further studies: pathways from demonstration to implementation
For this research to progress from a promising demonstration to a tool with practical and theoretical impact, future work must address the gaps highlighted above:
Pilot Deployment and Empirical Evaluation: The essential next step is a pilot in an operational building, involving real stakeholders (facility managers, sustainability officers). This will generate genuine insights into usability, data robustness and the platform's actual value in decision-making and reporting workflows.
Advancing from Visualization to Analysis: The platform must evolve to include automated compliance checking (logic against Level 3 thresholds), predictive analytics (e.g., for anomaly detection and forecasting) and scenario simulation tools. This would shift its role from a data viewer to an analytical decision-support system.
Embracing Semantic Interoperability: To move beyond manual data pipelines, future versions must integrate ontology-based data models (e.g., using ifcOWL, BOT, SAREF) to enable true semantic alignment and automated reasoning across data sources.
Critical Engagement with the Framework: With empirical data from pilots, future research can critically engage with the Level(s) framework itself – evaluating the practicality of its indicators, suggesting refinements based on digital feasibility and contributing genuinely to its methodological evolution.
5. Conclusions
This study developed and demonstrated a CDP prototype designed to operationalize the Level 3 indicators of the EU Level(s) framework. By integrating BIM, IoT, DT and AI components, the platform successfully enabled real-time monitoring of IEQ, EUI and carbon emissions, providing a unified dashboard for visualization and stakeholder interaction. The findings confirm that a digitally integrated approach can bridge the critical gap between static design assessments and dynamic in-use performance, addressing key challenges of data fragmentation and limited interoperability highlighted in the Level(s) implementation.
Looking forward, the CDP framework offers a foundational model with significant potential for evolution and broader impact. To provoke further research and practical application, three critical pathways are emphasized:
Scalability and Adaptation for Diverse Building Typologies: The modular, openBIM-based architecture of the CDP is inherently scalable. Beyond the small residential case study, the framework can be adapted for commercial high-rises, public institutions, industrial facilities and even heritage buildings. Scaling requires configurable KPI modules and dashboards tailored to specific stakeholder needs (e.g., portfolio managers vs facility engineers). Future research should pilot the CDP in these diverse contexts, leveraging cloud-native deployment and edge computing to handle larger data volumes and more complex building systems, thereby validating its robustness and flexibility across the built environment spectrum.
Policy Integration for Streamlined EU Compliance: For the Level(s) framework to achieve widespread adoption, digital tools must be seamlessly embedded into regulatory workflows. We recommend policymakers and standardization bodies (e.g., CEN, ISO) to: (a) Endorse open data standards like IFC and linked data formats as the official medium for Level(s) submissions, (b) Establish certification protocols for third-party platforms (like the proposed CDP) to generate audit-ready compliance reports, reducing verification overhead, and (c) Promote “compliance-by-design” by integrating platform outputs into building permits and performance certification schemes (e.g., Energy Performance Certificates – EPCs). This would transform sustainability reporting from a retrospective audit into a continuous, transparent process.
Overcoming Data Interoperability Through Standardization and Collaboration: The persistent challenge of data interoperability requires a concerted, two-pronged strategy. First, technical standardization must move beyond file formats to semantic interoperability. This involves the adoption of modular ontologies (e.g., ifcOWL, SAREF, BOT) to create a unified data language, enabling automated reasoning and seamless data fusion across BIM, IoT and external databases. Second, organizational collaboration is essential. We advocate for forming pre-competitive industry consortia – bringing together software vendors, construction firms and research institutions – to co-develop and adopt shared data protocols and reference implementations. This collective action is crucial to break down silos and create the integrated digital ecosystem envisioned by Level(s).
In conclusion, this study provides more than a PoC; it offers a scalable architectural blueprint and a clear agenda for future work. By addressing scalability, policy integration and interoperability through standardization and collaboration, the CDP framework can evolve from a research prototype into a catalytic tool for the built environment's digital and green transitions. The journey ahead necessitates continued interdisciplinary research, supportive policy frameworks and committed industry partnerships to fully realize the potential of digital technologies in achieving sustainable, circular and high-performance buildings across Europe and beyond.
List of abbreviations are presented in the Appendix.
The authors would like to thank the collaboration of students from Computer Science, Embedded systems and New Media Design to facilitate the development of the CDP. No human participants were involved in data collection or experimental procedures, and the study did not require ethical approval as it focused solely on technical system development and demonstration. AI-based tools (e.g., ChatGPT, Grammarly) were not used for drafting, summarizing or refining this manuscript.
Appendix
A1. List of Abbreviations
- AI
Artificial intelligence
- APIs
Application programming interfaces
- BIM
Building information modeling
- BMS
Building management systems
- BREEAM
Building research establishment environmental assessment methodology
- CDP
Collaborative digital platform
- CE
Circular economy
- COBie
Construction operations building information exchange
- DSR
Design science research
- DT
Digital twins
- EC
Embodied carbon
- EC3
Embodied carbon in construction calculator
- EPDs
Environmental product declarations
- EPBD
Energy Performance of Buildings Directive
- CPR
Construction Products Regulation
- EUI
Energy use intensity
- GDPR
General data protection regulation
- GWP
Global warming potential
- HVAC
Heating ventilation air conditioning
- IEQ
Indoor environmental quality
- IFC
Industry foundation classes
- IfcOWL
Industry foundation classes web ontology language
- IoT
Internet of things
- kgCO2-eq
Kilograms of carbon dioxide equivalent
- KPI
Key performance indicator
- kWh
Kilowatt hours
- LCA
Life cycle assessment
- LCF
Lifecycle carbon footprint
- LEED
Leadership in energy and environmental design