


The potential of virtual reality (VR) to replicate real-life scenarios remains an emerging field of research. Despite the promise of VR, there are still limited studies validating immersive virtual environments (IVEs) against real environments (REs), particularly in terms of comfort and behavioral responses across varying activity intensities. The study aims to contribute by examining thermal comfort and adaptive behaviors in both REs and VEs during sedentary and high-intensity activities.
Observations were conducted for two activity types: reading/watching and fabrication/machine work, in both the RE involving 50 participants and in IVEs with 24 participants. Between- and within-subject designs were adopted for real/Unreg. and virtual/Reg. environments, respectively.
The findings revealed significant differences in thermal comfort and preferences between real and virtual environments, except for thermal sensation during sedentary activities. For high-intensity activity, significant differences were found in thermal sensation and preferences between the two environments, except for thermal comfort. Ecological validity was rated high, particularly regarding the lighting and general appearance of IVEs compared to RE.
The study gave an insight that thermal perception partially supports criterion validity for activity intensities, i.e., fair agreement between RE and IVEs, adaptive behaviors were supported in both environments and activity intensities. Further research can be used to explore a wider range of activity intensity. Additionally, a more comprehensive validation framework can be incorporated, which encompasses thermal, visual comfort, and behavioral responses in both real and virtual environments.
1. Introduction
In recent times, Australians spend 90% of their time inside a building, carrying out different activities (Morawska et al., 2022). These varied activities influence how users interact with building systems and components to ensure their thermal comfort. The advancement of digital technologies has brought a revolution to the design, construction, and operations of buildings, including augmented reality (AR), mixed reality (MR), virtual reality (VR), Internet of things (IoT), and building information modelling (BIM). Digital technologies have emerged in building design and research, which help to engage end-users in the immersion and visualization of the built environment (Yigitbas et al., 2023; Mohammadi et al., 2025). VR is a low-cost technology that is effective in the replication of tests or tasks due to the speed of execution and the ability to modify multiple variables. This technology is an alternative tool to use rather than using a lot of time and resources to set up real spaces to test and comprehend users' perceptions and interactions (Silvera et al., 2022).
VR technology is a useful tool for human–computer interaction, environmental psychology, thermal comfort, and behavioral research. However, immersive virtual environments (IVEs) are still an emerging area for studying comfort and behaviors, indicating there is a need for more validation and comparison with real-life environments (Di Giuseppe et al., 2022). To compare observations in IVEs, an accurate representation of the same or similar indoor environment of a real environment (RE) should be replicated for immersive virtual experiments. This is a crucial part of validating user feedback (Alamirah et al., 2022).
The IVEs are combined with a climate chamber to generate thermal stimuli similar to REs. This tool can investigate and examine different domains and variables such as visual and thermal, acoustic and thermal, visual and acoustic, air quality, and thermal stimuli, etc (Rentala et al., 2021; Saeidi et al., 2021; Azmi et al., 2025). However, the use of VR in comfort and behavior research is still at a nascent stage and needs more attention in the validation aspect (Salamone et al., 2020).
Some of the validation studies conducted, i.e. IVE and RE, focused on thermal comfort (Saeidi, 2016; Yeom et al., 2019; Latini et al., 2023b), visual comfort (Chamilothori et al., 2019; Latini et al., 2023b), lighting behaviors, and thermally driven behaviors (Heydarian et al., 2015a; Saeidi et al., 2018; Latini et al., 2023b; Ozcelik and Becerik-Gerber, 2018), building design and layout, i.e. lighting status (Heydarian et al., 2015a; Hegazy et al., 2021), wall color (Latini et al., 2021, 2023b; Salamone et al., 2020), façade characteristics (Hong et al., 2019; Chamilothori et al., 2019), building features (Hong et al., 2019; Abd-Alhamid et al., 2019; Chen et al., 2019), biopic exposure on users, acoustic VR for indoor noise design protection.
Most of these studies have just been carried out for sedentary activities, i.e., relaxed activities such as reading and sitting. To further deepen the understanding of thermal comfort and user experience in IVEs, the study draws from notable frameworks, including predicted mean votes (PMV) by Fanger and adaptive comfort theory from Dear and Brager. Also, misalignment of cognitive-affective factors of users, such as perceived control and cognitive dissonance, helps explain variability. Therefore, it is pertinent to reinforce the validation of this immersive technology by accurately demonstrating real-life scenarios and activities. The adequacy of VEs in replicating REs and activities is limited in comparison with an in situ setting to understand the differences between the RE and IVE-collected data.
To contribute to existing validation studies, there is a need to investigate the extent to which virtual thermal stimuli of users accurately represent the RE for varied levels of activities. Also, this paper examines whether the user's adaptive behaviors and responses observed in VR are particularly related to real-world behaviors in the RE. This is conducted by comparing real-world observations with the VR experiment for sedentary (reading/watching) and high-intensity activity (fabrication/machine).
The rest of the paper is as follows: Section 2 reviews existing literature on validation studies for IVEs. Section 3 discusses the methodological approach used in experimenting, while Section 4 discusses the findings from the experiment and implications. Section 5 describes the conclusion, limitations, and areas of further study.
2. Literature review
2.1 Validation studies for the immersive virtual environment for different activities
The adoption of VR for building research is currently emerging; however, validation studies are limited. Validation is a crucial factor in experimental design, particularly when VR is used as a medium for empirical measurement (Harris et al., 2020a). According to studies, there are six major validity criteria for the application of IVE to occupant/user behaviors: ecological, internal, content, construct, criterion-related, and face. Out of the five validity tests, three are assessed during the pre-experimental phase of the research, which are content, construct, internal, and face validity. Tests and subjective votes that serve as markers for constructs that require further investigation make up the established instrument known as content validity. Construct validity compares applied IVE measurements to in situ contexts. Presence, content, and face validity are all parts of ecological validity. Internal validity is when the experiment's intervention can be linked to the observed result (Latini et al., 2023a). This is also defined as the use of repeated measures (the same set of participants receive different treatments) or independent measure design research (different groups receive different treatments).
Ecological and criterion validity are mostly evaluated during or after the experimental phase. Ecological validity is an important step for experiments, which is the ability to ensure that the virtual environment (VE) adequately represents the RE (Harris et al., 2020b). The key indicators for assessing ecological validity are graphical satisfaction, involvement, experience realism, spatial presence, and cybersickness disorder settings. The higher the users perceive these indicators, such as high presence in the environment, the higher the effectiveness of the experimental study. This is being carried out to ensure that the results obtained from the VR are suitable, reliable, and able to comprehend cause-and-effect relationships (Parsons, 2015).
Ecological validity can be conducted using direct, indirect or both. Indirect evaluation compares direct to indirect by assessing the influence on participants with subjective (e.g., perceived symptoms) or objective (e.g., performance), direct comparison of a virtual scene with a physical scene is done through subjective evaluations (Bellazzi et al., 2022). However, criterion validity is when both contexts (RE and IVE) are compared and there is a good agreement; when the VR performs well, there will be no significant difference between the outcomes of the constructs. This means the adequacy of the tool in replicating real observations can be confirmed. Here are some validation studies carried out using VR for perceptions and behaviors.
The existing body of knowledge on IVEs for studying thermal perception and behaviors has some conflicting results in validation. Heydarian et al. (2015b) and Saeidi (2016) investigated both light and thermal comfort-related behaviors in real and virtual office spaces. The earlier study adopted four artificial lights that were tested for typical tasks (answering questions, counting objects, and reading passages). Later studies compared the perception and experiences of IVE to real scenarios using a temperature range of 24 °C–29 °C. The study was conducted to understand the feasibility and effectiveness of IVE in conducting visual perception, preferences, and occupant behavior studies. Tasks like reading and questionnaires about visual perception were recorded after a 5-min interval. Both studies revealed there was no significant difference.
A growing trend in the multisensory stimuli adopts a spatial-temporal event-driven (STED) modeling approach to collect occupant behavior data in IVEs (Saeidi et al., 2018). The lighting behavior of people and occupancy was studied using a single-occupant office as a case study for IVE and a RE. Among the 6 temporary events that were examined, only two were not statistically different between the IVE and REs.
Another increasing focus was comparative validation to examine user comfort, presence, and satisfaction of both real and virtual environments. Chamilothori et al. (2019) conducted a real and IVE experiment to compare the perceptions of visual and physiological reactions and presence in IVE to a real scenario. Latini et al. (2023b) conducted a validation study using 104 subjects in either a virtual or RE concurrently. Both studies revealed there was no significance in the thermal, visual perception, and behaviors of users.
Another study examined the thermal sensation of students using the real and IVE (Yeom et al., 2019). The ambient temperature gradually increased by 1 °C in 10 min, where thermal sensation was collected after the interval, and the heart and skin temperature were measured every 10 s. However, the study did not provide a detailed experimental design or duration. The results revealed a slightly significant difference in the thermal sensations for the two environments. Hong et al. (2019) conducted a study on the sense of presence and satisfaction with changes in the Window Wall Ratio (WWR) in physical and virtual office spaces. This study was conducted by subjecting participants to four WWRs (15%, 30%, 45%, and 60%) in IVE. While some findings suggest agreement between the real and virtual settings, others highlight inconsistencies, which may be a result of experimental design, measurement interval, and type of stimuli adopted.
Despite the advances, there are several gaps that exist, such as activity levels and narrow environmental conditions. There is a lack of validation using varied activity levels, especially using Unregulated (Unreg.) and IVEs. There is a need to compare findings from Unreg. environments that dynamically change with controlled settings, where environmental parameters and clothing levels are fixed. This will extend the body of knowledge in understanding rational and adaptive approaches to thermal comfort. Table 1 shows the summary of previous validation studies conducted for thermal perception and behaviors for varied activity levels. The conceptual paradigm or framework for testing IVEs in a controlled environment for validation is also shown in Figure 1 (Latini et al., 2023a; Alamirah et al., 2022).
Summary of validation studies for thermal, visual perception and behaviors for different activities
| Authors | Experimental design | Sample size | Perceptual variables | Activity | Observations | |
|---|---|---|---|---|---|---|
| RE | VE | |||||
| Heydarian et al. (2015b) | Between subjects | 112 | Visual Comfort, Performance | Reading, identifying, and counting objects | Office | Office |
| Saeidi (2016) | Within Subjects | 17 | Thermal perception (TSV, TCV, and TPV), behavior | Listening to music | Climate chamber | Climate chamber |
| Chamilothori et al. (2019) | Within subjects | 28 | Visual Comfort | – | Office | Office |
| Abd-Alhamid et al. (2019) | Within subjects | 20 | Visual perception and appearance | – | Office | Office |
| Yeom et al. (2019) | Within subjects | 16 | Thermal sensation | Reading | Climate chamber | Climate chamber |
| Salamone et al. (2020) | Within subjects | 25 | Thermal and visual perception | Watching | Climate chamber | Climate chamber |
| Rockcastle et al. (2021) | Between Subjects | 53 | Visual Comfort | Viewing | Studio | Studio |
| Latini et al. (2023b) | Between Subjects | 104 | Visual, thermal perception, and behaviors | Reading | Climate chamber | Climate chamber |
| Present study | Within subjects | 24 | Thermal perception and behaviors | Sedentary (reading/watching) and high intensity (machining/fabrication) | Field | Climate chamber |
 The flowchart shows a horizontal line spanning at the bottom, with three divisions representing three stages, arranged in a horizontal series. Labeled from left to right, these are as follows: “Independent” as the first stage, the second stage is not labeled, and the final stage is labeled “Dependent.” The flow begins from the “Independent” stage, with a text box titled “Thermal environment,” with the following labeled values: “17 to 19.9 degrees Celsius, 18 degrees Celsius,” “23 to 25.9 degrees Celsius, 24 degrees Celsius,” and “29 to 31.9 degrees Celsius, 30 degrees Celsius.” This text box is under the heading “Single-domain.” From this text box, a solid and dashed arrow extends rightward and points to a text box labeled “Cool White Light” in the Independent stage. From “Cool White Light,” a set of two arrows, one solid and one dashed, extends upward and downward and points to two text boxes. The upward arrow points to the text box labeled “Reading or Watching.” The downward arrow points to the text box labeled “Fabrication or Machine.” The text boxes “Reading or Watching” and “Fabrication or Machine” are in the Independent stage, under the heading “Behavioral.” From “Reading or Watching,” a solid and dashed arrow labeled “H 1” together point to a text box labeled “Thermal perception” in the Dependent stage. From “Fabrication or Machine,” a solid and dashed arrow labeled “H 1” together point to a text box labeled “Thermal perception.” From “Reading or Watching,” a solid and dashed arrow labeled “H 2” together point to a text box labeled “Behaviors or behavioral intentions” in the Dependent stage. From “Fabrication or Machine,” a solid and dashed arrow labeled “H 2” together point to a text box labeled “Behaviors or behavioral intentions.” At the bottom, a legend shows that a solid arrow represents “Observed environments (Makerspace)” and a dashed arrow represents “Chambers (I V E).”
Conceptual framework for VR validation with RE. Source: Authors’ own work
The flowchart shows a horizontal line spanning at the bottom, with three divisions representing three stages, arranged in a horizontal series. Labeled from left to right, these are as follows: “Independent” as the first stage, the second stage is not labeled, and the final stage is labeled “Dependent.” The flow begins from the “Independent” stage, with a text box titled “Thermal environment,” with the following labeled values: “17 to 19.9 degrees Celsius, 18 degrees Celsius,” “23 to 25.9 degrees Celsius, 24 degrees Celsius,” and “29 to 31.9 degrees Celsius, 30 degrees Celsius.” This text box is under the heading “Single-domain.” From this text box, a solid and dashed arrow extends rightward and points to a text box labeled “Cool White Light” in the Independent stage. From “Cool White Light,” a set of two arrows, one solid and one dashed, extends upward and downward and points to two text boxes. The upward arrow points to the text box labeled “Reading or Watching.” The downward arrow points to the text box labeled “Fabrication or Machine.” The text boxes “Reading or Watching” and “Fabrication or Machine” are in the Independent stage, under the heading “Behavioral.” From “Reading or Watching,” a solid and dashed arrow labeled “H 1” together point to a text box labeled “Thermal perception” in the Dependent stage. From “Fabrication or Machine,” a solid and dashed arrow labeled “H 1” together point to a text box labeled “Thermal perception.” From “Reading or Watching,” a solid and dashed arrow labeled “H 2” together point to a text box labeled “Behaviors or behavioral intentions” in the Dependent stage. From “Fabrication or Machine,” a solid and dashed arrow labeled “H 2” together point to a text box labeled “Behaviors or behavioral intentions.” At the bottom, a legend shows that a solid arrow represents “Observed environments (Makerspace)” and a dashed arrow represents “Chambers (I V E).”Conceptual framework for VR validation with RE. Source: Authors’ own work
2.2 Research hypothesis
There is no significant difference in thermal perception (sensation, comfort and preferences) between the real environment and IVE for sedentary (reading/watching) and high-intensity (fabrication/machine) activities.
There is no significant difference between observed adaptive behaviors in the real environment and behavioral intentions in an IVE for sedentary (reading/watching) and high-intensity (fabrication/machine) activities.
3. Methodology
This study was designed to compare thermal comfort and behavioral responses across RE and IVE to evaluate effectiveness in replicating users' experiences during varying activity intensities. In real-world settings, observations were conducted in an Unreg. environment using a between-subjects design. A total of 50 participants were involved in the field experiment. 20 participants were recruited for sedentary activities (reading/watching), while 30 participants were engaged in high-intensity tasks (fabrication/machine) within the Makerspace. This spans several months to capture different thermal variations. A G*power software indicated that the between-subjects design (N = 50, d = 0.5) had statistical power of 0.70, which is acceptable for moderate effects. In the VE, a Regulated (Reg.) setting was ensured, and it employs a within-subjects design. A total of 24 participants were recruited and took part in both activities, i.e., sedentary activities (reading/watching) and high-intensity tasks (fabrication/machine). The statistical power is 0.86, which is adequate for medium effects (Faul et al., 2007).
3.1 Field experimental setting and study context
Melbourne experiences a temperate climate characterized by four seasons. To capture a range of thermal conditions, thermal comfort observations were conducted between August 2023 and February 2024, covering late winter, spring, and summer seasons. Before the field and controlled experiment, approvals were obtained from Monash Human Ethics. The study was carried out in the Makerspace at Monash University, a state-of-the-art fabrication and prototyping facility where student teams engage in various hands-on projects at different functional zones.
3.1.1 Survey instruments
This study employed a QR code-based questionnaire survey to investigate thermal comfort, users' preferences, and adaptive behaviors. The first section gave information about the survey and asked if they had participated before in the survey. This guided the appropriate section; those who had not participated before proceeded to section 2 (Static parameters – Gender, height, age), while returning participants were directed to section 3 (Dynamic parameters – activity, clothing level). Clothing options were provided for users to select, including short-sleeved and shorts (0.36), long-sleeved and shorts (0.50), short-sleeved and trousers (0.57), long-sleeved and trousers (0.61), long-sleeved, trousers with jackets (0.96), long-sleeved, shorts with jackets (0.86), short-sleeved, shorts with jackets (0.72), together with socks and shoes for sedentary activity. Although the clothing ensemble for high intensity had a slight difference because of safety boots, which replaced shoes.
Section 4 includes subjective users' thermal sensations, comfort, preferences, and adaptive behaviors. Thermal sensations were measured on a 9-point scale (very cold, cold, cool, slightly cool, neutral, slightly warm, warm, hot, and very hot), while thermal comfort was evaluated on a three-point scale (cold discomfort, comfortable and warm discomfort). Thermal preferences were assessed as warmer, no change, and cooler. The survey responses were matched with Next Environmental Monitoring (NEMo) sensing data collected during sedentary and high-intensity activities. To ensure reliable data, respondents were only allowed to fill in the survey following at least 15 min of indoor acclimatization. In addition, the interval between the first and second responses should be at least 20 min.
3.2 Instruments and setup for virtual environment
The instruments used in the controlled climate chambers include NEMo sensors, Wet Bulb Globe Temperature (WBGT) SD Card Data loggers, and HOBO air velocity sensors. NEMo sensors measure air temperature, relative humidity, and CO2 with a 55 °C to +125 °C, 0–95%, and 0–5000ppm measuring range, respectively. The accuracy for the sensors is ±2 °C between 25 and 100 °C, ±3% between 11 and 89%, and ±50ppm (±3% of reading value) respectively. WBGT measures the globe temperature with a 32–176F (0 °C–80 °C) range and precision of ±0.6 °C. The HOBO Air velocity sensor has a 0–1.0 m/s range and ±1% of reading.
An existing 3D BIM model of the facility was imported into Autodesk 3Ds max to add shading and insert any missing objects, such as furniture, machines, tools, and lighting fixtures. A cool white light (6000k) from the RE was converted into red, green and blue (RGB) values and baked into the Unity scene to simulate realistic lighting conditions. The simulation was deployed using High Tech Computer Virtual Immersive Virtual Environment (HTC VIVE) and Hewlett-Packard Reverb Generation 2 (HP Reverb G2) because of high-resolution displays and eye-tracking data to capture immersive user experiences across activity intensity (Bellazzi et al., 2022).
In assessing thermal comfort, textual cues indicating thermal sensations and others (e.g. hot, warm, neutral, cool, and cold) were displayed in the VE. Additional cues were displayed to inform the participants of possible users' behavioral intents during different activity intensities. These include no intention, opening/closing windows, clothing adjustment, adjusting thermostat, using fans or heater (Latini et al., 2023b). Virtual fans, heaters, and window adjustment were implemented in VE, while other options such as thermostat and clothing adjustment were either selected options or implemented in the real world (Kothari, 2019).
3.2.1 Pre-experimental stage
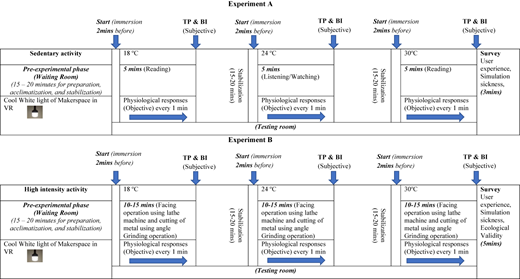
At a pre-experimental stage, the participant was allowed to sit comfortably, rest, and acclimatize to the environmental conditions in the waiting room for 15–20 min. While acclimating in the waiting room, the researcher gave some instructions on how the experiment would be carried out, the general setup, reading and watching activities (sedentary), and explained how angle grinding cutting and facing an operation for a lathe machine (high intensity) would be conducted in VR through video clips, captions, and display.
3.2.2 Experimental session
After an initial briefing, the participants were moved to the testing room. The experiment consisted of two phases: (1) sedentary activities where participants remained seated engaging in reading, listening, and watching activities as indicated in Figure 2a, and (2) high-intensity tasks, which involved virtual simulations of lathe-facing operations indicated in Figure 2b and metal cutting with an angle grinder shown in Figure 2c, where participants stood. VR headsets were worn to ensure immersion, following a short stabilization period in the waiting area.
 The figure shows three photographs arranged side by side, each panel depicting a person using virtual reality equipment. Below each panel, centered, are the labels “Figure 2 a,” “Figure 2 b,” and “Figure 2 c.” At the bottom right corner of the figure, the label “Source: Author’s own work” is present. Above each photographic panel is a circular inset image showing either a workstation monitor or a rendered VR scene. Each inset is connected to its corresponding panel with an arrow. In “Figure 2 a” (left panel), a seated participant is shown in profile facing rightward. The participant wears a head-mounted V R display and holds a handheld controller in both hands at lap level. The circular inset above shows a desk-view monitor. In “Figure 2 b” (center panel), a standing participant wears a head-mounted V R display and interacts with a long, black horizontal apparatus mounted on a table. The participant grips a handle attached to a sliding rail and appears to be applying force along the rail while looking into the headset. The circular inset above shows a workstation monitor or virtual scene with a grid-like, color-coded interface corresponding to the participant’s task. In “Figure 2 c” (right panel), a standing participant operates handheld V R controllers while wearing a head-mounted display. The participant stands at a table with additional equipment visible. The circular inset above shows another screen or rendered scene linked to this activity.
(a-c) Participants carrying out sedentary and high-intensity tasks. Source: Authors’ own work
The figure shows three photographs arranged side by side, each panel depicting a person using virtual reality equipment. Below each panel, centered, are the labels “Figure 2 a,” “Figure 2 b,” and “Figure 2 c.” At the bottom right corner of the figure, the label “Source: Author’s own work” is present. Above each photographic panel is a circular inset image showing either a workstation monitor or a rendered VR scene. Each inset is connected to its corresponding panel with an arrow. In “Figure 2 a” (left panel), a seated participant is shown in profile facing rightward. The participant wears a head-mounted V R display and holds a handheld controller in both hands at lap level. The circular inset above shows a desk-view monitor. In “Figure 2 b” (center panel), a standing participant wears a head-mounted V R display and interacts with a long, black horizontal apparatus mounted on a table. The participant grips a handle attached to a sliding rail and appears to be applying force along the rail while looking into the headset. The circular inset above shows a workstation monitor or virtual scene with a grid-like, color-coded interface corresponding to the participant’s task. In “Figure 2 c” (right panel), a standing participant operates handheld V R controllers while wearing a head-mounted display. The participant stands at a table with additional equipment visible. The circular inset above shows another screen or rendered scene linked to this activity.(a-c) Participants carrying out sedentary and high-intensity tasks. Source: Authors’ own work
Clothing insulation was standardized to 0.61 clo (long-sleeved shirts and trousers) in accordance with American Society of Heating, Refrigerating and Air-Conditioning Engineers (ASHRAE) 55, in IVEs, as shown in Figure 2 (Liu et al., 2022; Schweiker et al., 2020). Machine operations were realistically replicated in Unity through behavior scripting. Subjective responses on thermal perception and adaptive behaviors were collected at 7–10-min intervals for sedentary activities and post-task (10–15 min) for high-intensity activities.
Each experiment lasted approximately 1 h for sedentary and 1 h 15 min for high-intensity, with 5–10-min breaks to prevent VR fatigue. Thermal chamber settings were randomized across 18 °C, 24 °C, and 30 °C to eliminate order effects and ensure unbiased results (Yeom et al., 2019; Chinazzo et al., 2020). Experimental timelines and the design process are outlined in Table 2.
3.2.3 Post-experimental session
User experience and simulation sickness were collected at the end of the VR experiments for sedentary and high-intensity activity. User feedback and suggestions were collected in the waiting room at the end of the session. Similarly, direct validation was conducted after experiments for luminous lighting, spatial representation, texture, and the general environment of the IVE were compared with RE (Salamone et al., 2020; Latini et al., 2023b).
This post-experimental survey was conducted to validate the luminous and general environment (Alamirah et al., 2022; Bellazzi et al., 2022). The luminous environment in VR was compared to the RE, i.e. evaluating brightness, distribution, differences, commonness/regularity, transparency of glare, and color correlated temperature (CCT). Furthermore, the perception of the general environment (ecological validity) was also examined through questionnaires, i.e. pleasantness, spaciousness, satisfaction with the amount of view, reality with real, VR environment scaled to the RE.
3.3 Data analysis
To enable proper comparison between observations in Unreg. and Reg. environments. Temperature intervals in the Unreg. setting were compared to the Reg. setting. A Reg. temperature of 18 °C was compared to a temperature range of 17.0–19.9 °C for an Unreg. environment, 24 °C conditions compared with 23.0–25.9 °C, and 30 °C conditions compared with 29.0–31.9 °C. This temperature was selected to allow for direct comparison with the real-world experience while minimizing the influence of variability inherent in naturally fluctuating environments.
Data collected in an Unreg. environment that is outside these temperature ranges were excluded from comparison. Thermal perception and clothing insulation from both environments were compared using interval/box plots. A statistical test was conducted using Graphpad Prism 10 to determine whether there was a significant difference between Reg. and Unreg. environments across different thermal conditions. The Mann–Whitney U test was carried out to understand whether there is a significant difference in the thermal sensations, comfort, and preferences between the real and virtual environments during sedentary and high-intensity activity.
User-adaptive behaviors were compared between the real and virtual environments using descriptive statistics, i.e. a bar chart. Furthermore, Mann–Whitney U was used to test whether there is a significant difference between the real-world behaviors and behavioral intentions in IVE during sedentary and high-intensity activity (Kothari, 2019). ***p < 0.001 indicates a highly significant difference, **p < 0.01 shows significant difference, *p < 0.05 means weak significant difference and p > 0.05 means no significant difference.
4. Results
4.1 Demography of respondents
All participants used for both experiments were undergraduate and postgraduate students within the age bracket of 18 and 40 years (Arowoiya et al., 2025). For the VR experiments, 40% of the 24 participants have had experience with a VR interface. The criteria for participation in the VR experimental setup were no physical, visual, mental, or somatic disorder.
4.2 Clothing level for Reg. and Unreg. environments
The section discusses the clothing level for Unreg. and Reg. environments. The Unreg. level thermal conditions are 17.0–19.9 °C, 23.0–25.9 °C, and 29.0–31.9 °C, while Reg. environments are 18 °C, 24 °C, and 30 °C, respectively, for sedentary and high-intensity activity. A comparison of the median and mean clothing levels was carried out at each thermal condition for varying activity levels using a box plot.
4.2.1 Sedentary activity
Figure 3a shows the distribution of clothing insulation level in an Unreg. and Reg. environment for different thermal conditions. It was observed at 17 –19 °C and 18 °C, clothing insulation level was increased to resist the cold and make users feel warm, with an average of 0.79 for real compared to the IVE (mean clo = 0.63). The mean clothing difference level for both environments was 0.16, indicating behavioral adjustments to cold conditions in Unreg. environments. At 23 °C–25 °C and 24 °C, clothing levels were lower with slight mean deviations of 0.08. Despite the clothing levels being minimized to a mean clo of 0.55 in Unreg. environments, which are closely related to virtual environments. There were highly statistically significant differences (p < 0.001) in the range of these thermal conditions due to high variance. This means RE users exhibited higher clothing values than IVE. At 29 °C - 31.9 °C and 30 °C, it was found that the mean clothing level reduced drastically to accommodate the thermal conditions for Unreg. conditions. This implies that clothing value was lower compared to the IVE, with a difference of 0.17. A highly statistically significant difference (p < 0.001) was revealed in both environments.
 The figure shows two box plots side by side. In both graphs, the horizontal axis is labeled “Operative temperature,” and the markings from left to right are: “17 degrees Celsius to 19.9 degrees Celsius,” “18 degrees Celsius,” “23 degrees Celsius to 25.9 degrees Celsius,” “24 degrees Celsius,” “29 degrees Celsius to 31.9 degrees Celsius,” and “30 degrees Celsius.” The vertical axis is labeled “Clothing values” and ranges from 0.0 to 1.5 in increments of 0.5 units. Each marking on the horizontal axis has one box plot. For each operative temperature, the red box plot represents “R E,” and the blue box plot represents “V E.” The box plot on the left is labeled “a,” and the details for the box plot are as follows: 17 degrees Celsius to 19.9 degrees Celsius: R E: Minimum: 0.37. Lower Quartile: 0.61. Median: 0.79. Upper Quartile: 0.97. Maximum: Nil. 18 degrees Celsius: I V E: Minimum: 0.59. Lower Quartile: 0.63. Median: 0.63. Upper Quartile: 0.63. Maximum: 0.84. 23 degrees Celsius to 25.9 degrees Celsius: R E: Minimum: Nil. Lower Quartile: 0.37. Median: 0.59. Upper Quartile: 0.61. Maximum: 0.97. 24 degrees Celsius: I V E: Minimum: 0.58. Lower Quartile: 0.63. Median: 0.63. Upper Quartile: 0.63. Maximum: 0.86. Three outliers are present horizontally between the “Maximum” of “23 degrees Celsius to 25.9 degrees Celsius” and “24 degrees Celsius.” 29 degrees Celsius to 31.9 degrees Celsius: R E: Minimum: Nil. Lower Quartile: 0.37. Median: 0.45. Upper Quartile: 0.56. Maximum: 0.63. 30 degrees Celsius: I V E: Minimum: 0.58. Lower Quartile: 0.63. Median: 0.63. Upper Quartile: 0.63. Maximum: 0.87. Three outliers are present horizontally between the “Maximum” of “29 degrees Celsius to 31.9 degrees Celsius” and “30 degrees Celsius.” The box plot on the left is labeled “b,” and the details for the box plot are as follows: 17 degrees Celsius to 19.9 degrees Celsius: R E: Minimum: 0.65. Lower Quartile: 0.66. Median:0.86. Upper Quartile: 1.02. Maximum: 1.13. 18 degrees Celsius: I V E: Minimum: 0.56. Lower Quartile: 0.61. Median:0.61. Upper Quartile: 0.61. Maximum: 0.71. Three outliers are present horizontally between the “Maximum” of “17 degrees Celsius to 19.9 degrees Celsius,” and “18 degrees Celsius.” 23 degrees Celsius to 25.9 degrees Celsius: R E: Minimum: Nil. Lower Quartile: 0.44. Median:0.61. Upper Quartile: 0.65. Maximum: 1.05. 24 degrees Celsius: I V E: Minimum: 0.56. Lower Quartile: 0.61. Median:0.61. Upper Quartile: 0.61. Maximum: 0.71. 29 degrees Celsius to 31.9 degrees Celsius: R E: Minimum: 0.43. Lower Quartile: 0.43. Median:0.43. Upper Quartile: 0.43. Maximum: 0.43. 30 degrees Celsius: I V E: Minimum: 0.56. Lower Quartile: 0.61. Median:0.61. Upper Quartile: 0.61. Maximum: 0.71. Note: All numerical data values are approximated.
Mean value test for clothing level (a) sedentary activity and (b) high intensity activity, ***p < 0.001, **p < 0.01, *p < 0.05, n.s. = no significant difference. Source: Authors’ own work
The figure shows two box plots side by side. In both graphs, the horizontal axis is labeled “Operative temperature,” and the markings from left to right are: “17 degrees Celsius to 19.9 degrees Celsius,” “18 degrees Celsius,” “23 degrees Celsius to 25.9 degrees Celsius,” “24 degrees Celsius,” “29 degrees Celsius to 31.9 degrees Celsius,” and “30 degrees Celsius.” The vertical axis is labeled “Clothing values” and ranges from 0.0 to 1.5 in increments of 0.5 units. Each marking on the horizontal axis has one box plot. For each operative temperature, the red box plot represents “R E,” and the blue box plot represents “V E.” The box plot on the left is labeled “a,” and the details for the box plot are as follows: 17 degrees Celsius to 19.9 degrees Celsius: R E: Minimum: 0.37. Lower Quartile: 0.61. Median: 0.79. Upper Quartile: 0.97. Maximum: Nil. 18 degrees Celsius: I V E: Minimum: 0.59. Lower Quartile: 0.63. Median: 0.63. Upper Quartile: 0.63. Maximum: 0.84. 23 degrees Celsius to 25.9 degrees Celsius: R E: Minimum: Nil. Lower Quartile: 0.37. Median: 0.59. Upper Quartile: 0.61. Maximum: 0.97. 24 degrees Celsius: I V E: Minimum: 0.58. Lower Quartile: 0.63. Median: 0.63. Upper Quartile: 0.63. Maximum: 0.86. Three outliers are present horizontally between the “Maximum” of “23 degrees Celsius to 25.9 degrees Celsius” and “24 degrees Celsius.” 29 degrees Celsius to 31.9 degrees Celsius: R E: Minimum: Nil. Lower Quartile: 0.37. Median: 0.45. Upper Quartile: 0.56. Maximum: 0.63. 30 degrees Celsius: I V E: Minimum: 0.58. Lower Quartile: 0.63. Median: 0.63. Upper Quartile: 0.63. Maximum: 0.87. Three outliers are present horizontally between the “Maximum” of “29 degrees Celsius to 31.9 degrees Celsius” and “30 degrees Celsius.” The box plot on the left is labeled “b,” and the details for the box plot are as follows: 17 degrees Celsius to 19.9 degrees Celsius: R E: Minimum: 0.65. Lower Quartile: 0.66. Median:0.86. Upper Quartile: 1.02. Maximum: 1.13. 18 degrees Celsius: I V E: Minimum: 0.56. Lower Quartile: 0.61. Median:0.61. Upper Quartile: 0.61. Maximum: 0.71. Three outliers are present horizontally between the “Maximum” of “17 degrees Celsius to 19.9 degrees Celsius,” and “18 degrees Celsius.” 23 degrees Celsius to 25.9 degrees Celsius: R E: Minimum: Nil. Lower Quartile: 0.44. Median:0.61. Upper Quartile: 0.65. Maximum: 1.05. 24 degrees Celsius: I V E: Minimum: 0.56. Lower Quartile: 0.61. Median:0.61. Upper Quartile: 0.61. Maximum: 0.71. 29 degrees Celsius to 31.9 degrees Celsius: R E: Minimum: 0.43. Lower Quartile: 0.43. Median:0.43. Upper Quartile: 0.43. Maximum: 0.43. 30 degrees Celsius: I V E: Minimum: 0.56. Lower Quartile: 0.61. Median:0.61. Upper Quartile: 0.61. Maximum: 0.71. Note: All numerical data values are approximated.Mean value test for clothing level (a) sedentary activity and (b) high intensity activity, ***p < 0.001, **p < 0.01, *p < 0.05, n.s. = no significant difference. Source: Authors’ own work
4.2.2 High-intensity activity
Figure 3b shows the distribution of clothing levels of users in an Unreg. and Reg. environment at different thermal conditions. It was observed at 17 –19 °C and 18 °C, clothing insulation level was high for the Unreg. (mean clo = 0.86) compared to the Reg. environment (mean clo = 0.61). The mean difference for both environments was 0.25, which is highly statistically significant (p < 0.001). The variance of clothing was wider in Unreg. conditions with maximum values above 1.0, compared to a Reg. environment. However, there were no disparities between the mean clothing levels, particularly at 23 °C–25 °C and 24 °C. This indicates that users in Unreg. environments minimized clothing levels, which is closely related to Reg. environments. This means a more uniform adaptation leading to a non-significant difference. During 29 °C - 31.9 °C and 30 °C, it was found that the average clothing level reduced drastically to accommodate the thermal conditions for Unreg. The mean clothing difference between the Unreg. and Reg. was 0.17, with no statistically significant difference.
In sedentary activity, the outcome shows there was a significant difference in thermal perception between the RE and IVE (U = 1919, Z = −4.374 < −1.96; p = 0.001 < 0.05). Conversely, fabrication/machine activity had no significant difference in clothing level between the real and VE (U = 2925, Z score within ±1.96; p = 0.224 > 0.05), as shown in Table 3.
Mann–Whitney U-test between real and virtual environments of clothing level for varied activity intensity levels
| Parameters | Sum of ranks RE | Sum of ranks IVE | U-value | Z-score | p-value | |
|---|---|---|---|---|---|---|
| Clothing | Sedentary | 5747.00 | 6973.00 | 1919.00 | −4.374 | <0.001*** |
| Fabrication/machine | 7813.00 | 5553.00 | 2925.00 | −1.217 | 0.224 |
Note(s): Significant at p-value <0.05
4.3 Comparison of thermal perception for reg. and unreg. environments
This section discusses thermal perception for sedentary and high-intensity activity in Reg. and Unreg. environments. The thermal perception, including thermal sensation, comfort, and preferences, was compared between different thermal conditions. A box plot was used to compare the Unreg. and Reg. environments. The Unreg. environment shows the observations in the RE, while the Reg. environment is the VE.
4.3.1 Sedentary activity
Figure 4a illustrates thermal sensation votes (TSV) under Unreg. and Reg. environments for sedentary activity at varying thermal conditions. The mean thermal sensation has slight discrepancies between the Unreg. and Reg. environments at varied thermal conditions. Although the mean test values revealed no statistically significant differences between these environments at 18 °C, 24 °C, and 30 °C.
 The figure shows three box plots. The box plot on the top left is labeled “a,” and the details for the box plot are as follows. The horizontal axis is labeled “Operative temperature,” and the markings from left to right are: “17 degrees Celsius to 19.9 degrees Celsius,” “18 degrees Celsius,” “23 degrees Celsius to 25.9 degrees Celsius,” “24 degrees Celsius,” “29 degrees Celsius to 31.9 degrees Celsius,” and “30 degrees Celsius.” The vertical axis on the left is labeled “Thermal sensation” and ranges from negative 5 to 4 in increments of 1 unit. On the right side of the vertical axis, each marking is labeled from top to bottom as follows: “4” is “very hot,” “3” is “hot,” “2” is “warm,” “1” is “slightly warm,” “0” is “neutral,” “negative 1” is “slightly cool,” “negative 2” is “cool,” “negative 3” is “cold,” and “negative 4” is “very cold.” Each marking on the horizontal axis has one box plot. For each operative temperature, the red box plot represents “R E,” and the blue box plot represents “I V E.” The details for the box plot are as follows: 17 degrees Celsius to 19.9 degrees Celsius: R E: Minimum: negative 4. Lower Quartile: negative 2. Median: negative 1. Upper Quartile: 0.3. Maximum: 1. 18 degrees Celsius: I V E: Minimum: negative 3. Lower Quartile: negative 2. Median: negative 1.5. Upper Quartile: negative 1. Maximum: 0. 23 degrees Celsius to 25.9 degrees Celsius: R E: Minimum: negative 3. Lower Quartile: negative 1. Median: 0. Upper Quartile: 0.3. Maximum: 2. 24 degrees Celsius: I V E: Minimum: negative 1. Lower Quartile: 0. Median: 0.2. Upper Quartile: 1. Maximum: 2. 29 degrees Celsius to 31.9 degrees Celsius: R E: Minimum: 0. Lower Quartile: 1. Median: 1.1. Upper Quartile: 2. Maximum: NIL. 30 degrees Celsius: I V E: Minimum: 1. Lower Quartile: 2. Median: 2.2. Upper Quartile: 3. Maximum: NIL. The box plot on the top right is labeled “b,” and the details for the box plot are as follows. The horizontal axis is labeled “Operative temperature,” and the markings from left to right are: “17 degrees Celsius to 19.9 degrees Celsius,” “18 degrees Celsius,” “23 degrees Celsius to 25.9 degrees Celsius,” “24 degrees Celsius,” “29 degrees Celsius to 31.9 degrees Celsius,” and “30 degrees Celsius.” The vertical axis on the left is labeled “Thermal comfort” and ranges from negative 1.5 to 1.5 in increments of 1 unit. On the right side of the vertical axis, some markings are labeled from top to bottom as follows: “1.0” is “warm discomfort,” “0.0” is “comfortable,” and “negative 1.0” is “cold discomfort.” Each marking on the horizontal axis has one box plot. For each operative temperature, the red box plot represents “R E,” and the blue box plot represents “I V E.” The details for the box plot are as follows: 17 degrees Celsius to 19.9 degrees Celsius: R E: Minimum: NIL. Lower Quartile: negative 1.0. Median: negative 0.4. Upper Quartile: 0.0. Maximum: NIL. 18 degrees Celsius: I V E: Minimum: NIL. Lower Quartile: negative 1.0. Median: negative 0.4. Upper Quartile: 0.0. Maximum: NIL. 23 degrees Celsius to 25.9 degrees Celsius: R E: Minimum: negative 1.0. Lower Quartile: 0.0. Median: 0.0. Upper Quartile: 0.0. Maximum: 1.0. 24 degrees Celsius: I V E: Minimum: 0.0. Lower Quartile: 0.1. Median: 0.1. Upper Quartile: 0.1. Maximum: 1.0. 29 degrees Celsius to 31.9 degrees Celsius: R E: Minimum: 0.0. Lower Quartile: 0.1. Median: 0.1. Upper Quartile: 0.1. Maximum: 1.0. 30 degrees Celsius: I V E: Minimum: 0.0. Lower Quartile: 0.7. Median: 0.7. Upper Quartile: 0.7. Maximum: 1.0. Three outliers are present horizontally between the “Maximum” of “29 degrees Celsius to 31.9 degrees Celsius” and “30 degrees Celsius.” The box plot on the bottom center is labeled “c,” and the details for the box plot are as follows. The horizontal axis is labeled “Operative temperature,” and the markings from left to right are: “17 degrees Celsius to 19.9 degrees Celsius,” “18 degrees Celsius,” “23 degrees Celsius to 25.9 degrees Celsius,” “24 degrees Celsius,” “29 degrees Celsius to 31.9 degrees Celsius,” and “30 degrees Celsius.” The vertical axis on the left is labeled “Thermal preferences” and ranges from negative 1.5 to 1.5 in increments of 1 unit. On the right side of the vertical axis, some markings are labeled from top to bottom as follows: “1.0” is “warmer,” “0.0” is “no change,” and “negative 1.0” is “cooler.” Each marking on the horizontal axis has one box plot. For each operative temperature, the red box plot represents “R E,” and the blue box plot represents “I V E.” The details for the box plot are as follows: 17 degrees Celsius to 19.9 degrees Celsius: R E: Minimum: NIL. Lower Quartile: 0.0. Median: negative 0.5. Upper Quartile: 1.0. Maximum: NIL. 18 degrees Celsius: I V E: Minimum: NIL. Lower Quartile: 0.0. Median: negative 0.5. Upper Quartile: 1.0. Maximum: NIL. 23 degrees Celsius to 25.9 degrees Celsius: R E: Minimum: negative 1.0. Lower Quartile: 0.0. Median: 0.0. Upper Quartile: 0.0. Maximum: 1.0. 24 degrees Celsius: I V E: Minimum: NIL. Lower Quartile: negative 1.0. Median: negative 0.4. Upper Quartile: 0.0. Maximum: 1.0. One outlier is present between the “Maximum” of “23 degrees Celsius to 25.9 degrees Celsius” and “24 degrees Celsius.” 29 degrees Celsius to 31.9 degrees Celsius: R E: Minimum: NIL. Lower Quartile: negative 1.0. Median: negative 0.2. Upper Quartile: 0.0. Maximum: 1.0. 30 degrees Celsius: I V E: Minimum: negative 1.0. Lower Quartile: NIL. Median: NIL. Upper Quartile: NIL. Maximum: 0.0. Two outliers are present horizontally between the “Maximum” of “29 degrees Celsius to 31.9 degrees Celsius” and “30 degrees Celsius.” Note: All numerical data values are approximated.
Mean value test for sedentary (a) TSV, (b) TCV and (c) TPV, ***p < 0.001, **p < 0.01, *p < 0.05, n.s. = no significant difference. Source: Authors’ own work
The figure shows three box plots. The box plot on the top left is labeled “a,” and the details for the box plot are as follows. The horizontal axis is labeled “Operative temperature,” and the markings from left to right are: “17 degrees Celsius to 19.9 degrees Celsius,” “18 degrees Celsius,” “23 degrees Celsius to 25.9 degrees Celsius,” “24 degrees Celsius,” “29 degrees Celsius to 31.9 degrees Celsius,” and “30 degrees Celsius.” The vertical axis on the left is labeled “Thermal sensation” and ranges from negative 5 to 4 in increments of 1 unit. On the right side of the vertical axis, each marking is labeled from top to bottom as follows: “4” is “very hot,” “3” is “hot,” “2” is “warm,” “1” is “slightly warm,” “0” is “neutral,” “negative 1” is “slightly cool,” “negative 2” is “cool,” “negative 3” is “cold,” and “negative 4” is “very cold.” Each marking on the horizontal axis has one box plot. For each operative temperature, the red box plot represents “R E,” and the blue box plot represents “I V E.” The details for the box plot are as follows: 17 degrees Celsius to 19.9 degrees Celsius: R E: Minimum: negative 4. Lower Quartile: negative 2. Median: negative 1. Upper Quartile: 0.3. Maximum: 1. 18 degrees Celsius: I V E: Minimum: negative 3. Lower Quartile: negative 2. Median: negative 1.5. Upper Quartile: negative 1. Maximum: 0. 23 degrees Celsius to 25.9 degrees Celsius: R E: Minimum: negative 3. Lower Quartile: negative 1. Median: 0. Upper Quartile: 0.3. Maximum: 2. 24 degrees Celsius: I V E: Minimum: negative 1. Lower Quartile: 0. Median: 0.2. Upper Quartile: 1. Maximum: 2. 29 degrees Celsius to 31.9 degrees Celsius: R E: Minimum: 0. Lower Quartile: 1. Median: 1.1. Upper Quartile: 2. Maximum: NIL. 30 degrees Celsius: I V E: Minimum: 1. Lower Quartile: 2. Median: 2.2. Upper Quartile: 3. Maximum: NIL. The box plot on the top right is labeled “b,” and the details for the box plot are as follows. The horizontal axis is labeled “Operative temperature,” and the markings from left to right are: “17 degrees Celsius to 19.9 degrees Celsius,” “18 degrees Celsius,” “23 degrees Celsius to 25.9 degrees Celsius,” “24 degrees Celsius,” “29 degrees Celsius to 31.9 degrees Celsius,” and “30 degrees Celsius.” The vertical axis on the left is labeled “Thermal comfort” and ranges from negative 1.5 to 1.5 in increments of 1 unit. On the right side of the vertical axis, some markings are labeled from top to bottom as follows: “1.0” is “warm discomfort,” “0.0” is “comfortable,” and “negative 1.0” is “cold discomfort.” Each marking on the horizontal axis has one box plot. For each operative temperature, the red box plot represents “R E,” and the blue box plot represents “I V E.” The details for the box plot are as follows: 17 degrees Celsius to 19.9 degrees Celsius: R E: Minimum: NIL. Lower Quartile: negative 1.0. Median: negative 0.4. Upper Quartile: 0.0. Maximum: NIL. 18 degrees Celsius: I V E: Minimum: NIL. Lower Quartile: negative 1.0. Median: negative 0.4. Upper Quartile: 0.0. Maximum: NIL. 23 degrees Celsius to 25.9 degrees Celsius: R E: Minimum: negative 1.0. Lower Quartile: 0.0. Median: 0.0. Upper Quartile: 0.0. Maximum: 1.0. 24 degrees Celsius: I V E: Minimum: 0.0. Lower Quartile: 0.1. Median: 0.1. Upper Quartile: 0.1. Maximum: 1.0. 29 degrees Celsius to 31.9 degrees Celsius: R E: Minimum: 0.0. Lower Quartile: 0.1. Median: 0.1. Upper Quartile: 0.1. Maximum: 1.0. 30 degrees Celsius: I V E: Minimum: 0.0. Lower Quartile: 0.7. Median: 0.7. Upper Quartile: 0.7. Maximum: 1.0. Three outliers are present horizontally between the “Maximum” of “29 degrees Celsius to 31.9 degrees Celsius” and “30 degrees Celsius.” The box plot on the bottom center is labeled “c,” and the details for the box plot are as follows. The horizontal axis is labeled “Operative temperature,” and the markings from left to right are: “17 degrees Celsius to 19.9 degrees Celsius,” “18 degrees Celsius,” “23 degrees Celsius to 25.9 degrees Celsius,” “24 degrees Celsius,” “29 degrees Celsius to 31.9 degrees Celsius,” and “30 degrees Celsius.” The vertical axis on the left is labeled “Thermal preferences” and ranges from negative 1.5 to 1.5 in increments of 1 unit. On the right side of the vertical axis, some markings are labeled from top to bottom as follows: “1.0” is “warmer,” “0.0” is “no change,” and “negative 1.0” is “cooler.” Each marking on the horizontal axis has one box plot. For each operative temperature, the red box plot represents “R E,” and the blue box plot represents “I V E.” The details for the box plot are as follows: 17 degrees Celsius to 19.9 degrees Celsius: R E: Minimum: NIL. Lower Quartile: 0.0. Median: negative 0.5. Upper Quartile: 1.0. Maximum: NIL. 18 degrees Celsius: I V E: Minimum: NIL. Lower Quartile: 0.0. Median: negative 0.5. Upper Quartile: 1.0. Maximum: NIL. 23 degrees Celsius to 25.9 degrees Celsius: R E: Minimum: negative 1.0. Lower Quartile: 0.0. Median: 0.0. Upper Quartile: 0.0. Maximum: 1.0. 24 degrees Celsius: I V E: Minimum: NIL. Lower Quartile: negative 1.0. Median: negative 0.4. Upper Quartile: 0.0. Maximum: 1.0. One outlier is present between the “Maximum” of “23 degrees Celsius to 25.9 degrees Celsius” and “24 degrees Celsius.” 29 degrees Celsius to 31.9 degrees Celsius: R E: Minimum: NIL. Lower Quartile: negative 1.0. Median: negative 0.2. Upper Quartile: 0.0. Maximum: 1.0. 30 degrees Celsius: I V E: Minimum: negative 1.0. Lower Quartile: NIL. Median: NIL. Upper Quartile: NIL. Maximum: 0.0. Two outliers are present horizontally between the “Maximum” of “29 degrees Celsius to 31.9 degrees Celsius” and “30 degrees Celsius.” Note: All numerical data values are approximated.Mean value test for sedentary (a) TSV, (b) TCV and (c) TPV, ***p < 0.001, **p < 0.01, *p < 0.05, n.s. = no significant difference. Source: Authors’ own work
The mean of thermal comfort votes (TCV) showed no differences between Unreg. compared to Reg. environments, especially at 17–19 °C and 18 °C. The interquartile range for both environments indicates similar variability in their responses. A mean value test revealed no statistically significant differences between conditions at 18 and 24 °C (p > 0.05) as shown in Figure 4b. This suggests there were no pronounced deviations in responses. However, there was a highly statistically significant difference between the real and VE for 29–31.9 °C and 30 °C (p < 0.001).
A box plot was used to compare thermal preference votes (TPV) between Unreg. and Reg. environments across different thermal conditions (18 °C, 24 °C, and 30 °C), as shown in Figure 4c. Mean thermal preference was similar, particularly 17–19 °C and 18 °C. The interquartile range for the Unreg. and Reg. environments were similar. A mean value test revealed weak statistically significant differences between both environments at 24 °C (p < 0.05) and statistically significant differences at 30 °C (p < 0.01), as displayed in 4c.
Overall, there is a significant difference in thermal comfort (U = 2490.5, Z = −2.899 < −1.96; p = 0.004 < 0.05) and preferences (U = 2197.5, Z = −3.578 < −1.96; p = 0.001 < 0.05) between the RE and IVE during sedentary activity, except for thermal sensation (U = 2735.5, Z = −2.479 < −1.96; p = 0.161 > 0.05), as indicated in Table 4.
Mann–Whitney U-test between real and virtual environments of thermal perception for sedentary activity
| Parameters | Sum of ranks RE | Sum of ranks IVE | U-value | Z-score | p-value | |
|---|---|---|---|---|---|---|
| TP | TSV | 6259.50 | 6165.50 | 2735.50 | −2.479 | 0.161 |
| TCV | 6316.50 | 6401.50 | 2490.50 | −2.899 | 0.004** | |
| TPV | 7894.50 | 4825.50 | 2197.50 | −3.578 | <0.001*** |
Note(s): Significant at p-value <0.05
4.3.2 High-intensity activity
Figure 5a shows thermal sensation under Unreg. and Reg. environments for high-intensity activity at varying thermal conditions. The mean thermal sensation has high discrepancies between Unreg. and Reg. environments, especially at 17–19 °C and 18 °C. Although the mean test values revealed high statistically significant differences between these environments at 18 °C (p < 0.0001), and weak significant differences at 24 °C (p < 0.01), no significant differences were found at 30 °C (p > 0.05).
 The figure shows three box plots. The box plot on the top left is labeled “a,” and the details for the box plot are as follows. The horizontal axis is labeled “Operative temperature,” and the markings from left to right are: “17 degrees Celsius to 19.9 degrees Celsius,” “18 degrees Celsius,” “23 degrees Celsius to 25.9 degrees Celsius,” “24 degrees Celsius,” “29 degrees Celsius to 31.9 degrees Celsius,” and “30 degrees Celsius.” The vertical axis on the left is labeled “Thermal sensation” and ranges from negative 5 to 4 in increments of 1 unit. On the right side of the vertical axis, each marking is labeled from top to bottom as follows: “4” is “very hot,” “3” is “hot,” “2” is “warm,” “1” is “slightly warm,” “0” is “neutral,” “negative 1” is “slightly cool,” “negative 2” is “cool,” “negative 3” is “cold,” and “negative 4” is “very cold.” Each marking on the horizontal axis has one box plot. For each operative temperature, the red box plot represents “R E,” and the blue box plot represents “I V E.” The details for the box plot are as follows: 17 degrees Celsius to 19.9 degrees Celsius: R E: Minimum: NIL. Lower Quartile: 1. Median: 1.5. Upper Quartile: 2. Maximum: Nil. 18 degrees Celsius: I V E: Minimum: negative 2. Lower Quartile: negative 1. Median: negative 0.8. Upper Quartile: 0. Maximum: 1. Four outliers are present horizontally between the “Maximum” of “17 degrees Celsius to 19.9 degrees Celsius,” and “18 degrees Celsius.” 23 degrees Celsius to 25.9 degrees Celsius: R E: Minimum: 0. Lower Quartile: 1. Median: 1.5. Upper Quartile: 2. Maximum: 3. 24 degrees Celsius: I V E: Minimum: 0. Lower Quartile: 0.3. Median: 0.9. Upper Quartile: 1. Maximum: 2. 29 degrees Celsius to 31.9 degrees Celsius: R E: Minimum: 2. Lower Quartile: 2.3. Median: 2.3. Upper Quartile: 2.3. Maximum: 3. 30 degrees Celsius: I V E: Minimum: NIL. Lower Quartile: 2. Median: 2.5. Upper Quartile: 3. Maximum: 4. One outlier is present between the “Maximum” of “23 degrees Celsius to 25.9 degrees Celsius” and “24 degrees Celsius.” The box plot on the top right is labeled “b,” and the details for the box plot are as follows. The horizontal axis is labeled “Operative temperature,” and the markings from left to right are: “17 degrees Celsius to 19.9 degrees Celsius,” “18 degrees Celsius,” “23 degrees Celsius to 25.9 degrees Celsius,” “24 degrees Celsius,” “29 degrees Celsius to 31.9 degrees Celsius,” and “30 degrees Celsius.” The vertical axis on the left is labeled “Thermal comfort” and ranges from negative 1.0 to 1.5 in increments of 1 unit. On the right side of the vertical axis, some markings are labeled from top to bottom as follows: “1.0” is “warm discomfort,” “0.0” is “comfortable,” and “negative 1.0” is “cold discomfort.” Each marking on the horizontal axis has one box plot. For each operative temperature, the red box plot represents “R E,” and the blue box plot represents “I V E.” The details for the box plot are as follows: 17 degrees Celsius to 19.9 degrees Celsius: R E: Minimum: NIL. Lower Quartile: 0.0. Median: negative 0.25. Upper Quartile: 0.75. Maximum: 1.0. 18 degrees Celsius: I V E: Minimum: 0.0. Lower Quartile: 0.0. Median: negative 0.0. Upper Quartile: 0.0. Maximum: 0.0. 23 degrees Celsius to 25.9 degrees Celsius: R E: Minimum: NIL. Lower Quartile: 0.0. Median: 0.4. Upper Quartile: 1.0. Maximum: NIL. 24 degrees Celsius: I V E: Minimum: 0.0. Lower Quartile: 0.1. Median: 0.1. Upper Quartile: 0.1. Maximum: 1.0. 29 degrees Celsius to 31.9 degrees Celsius: R E: Minimum: 0.0. Lower Quartile: 0.75. Median: 0.75. Upper Quartile: 0.75. Maximum: 1.0. 30 degrees Celsius: I V E: Minimum: 0.0. Lower Quartile: 0.9. Median: 0.9. Upper Quartile: 0.9. Maximum: 1.0. The box plot on the bottom center is labeled “c,” and the details for the box plot are as follows. The horizontal axis is labeled “Operative temperature,” and the markings from left to right are: “17 degrees Celsius to 19.9 degrees Celsius,” “18 degrees Celsius,” “23 degrees Celsius to 25.9 degrees Celsius,” “24 degrees Celsius,” “29 degrees Celsius to 31.9 degrees Celsius,” and “30 degrees Celsius.” The vertical axis on the left is labeled “Thermal preferences” and ranges from negative 1.5 to 1.5 in increments of 1 unit. On the right side of the vertical axis, some markings are labeled from top to bottom as follows: “1.0” is “warmer,” “0.0” is “no change,” and “negative 1.0” is “cooler.” Each marking on the horizontal axis has one box plot. For each operative temperature, the red box plot represents “R E,” and the blue box plot represents “I V E.” The details for the box plot are as follows: 17 degrees Celsius to 19.9 degrees Celsius: R E: Minimum: NIL. Lower Quartile: negative 1.0. Median: negative 0.0. Upper Quartile: 0.4. Maximum: 1.0. 18 degrees Celsius: I V E: Minimum: negative 1.0. Lower Quartile: 0.0. Median: 0.0. Upper Quartile: 0.0. Maximum: 1.0. 23 degrees Celsius to 25.9 degrees Celsius: R E: Minimum: NIL. Lower Quartile: 1.0. Median: negative 0.75. Upper Quartile: 0.0. Maximum: NIL. 24 degrees Celsius: I V E: Minimum: NIL. Lower Quartile: 1.0. Median: negative 0.4. Upper Quartile: 0.0. Maximum: NIL. One outlier is present between the “Maximum” of “23 degrees Celsius to 25.9 degrees Celsius” and “24 degrees Celsius.” 29 degrees Celsius to 31.9 degrees Celsius: R E: Minimum: negative 1.0. Lower Quartile: negative 1.0. Median: negative 1.0. Upper Quartile: negative 1.0. Maximum: negative 1.0. 30 degrees Celsius: I V E: Minimum: negative 1.0. Lower Quartile: negative 1.0. Median: negative 1.0. Upper Quartile: negative 1.0. Maximum: negative 1.0. Note: All numerical data values are approximated.
Mean value test for fabrication/machine activity (a) TSV, (b) TCV and (c) TPV, ****p < 0.0001, ***p < 0.001, **p < 0.01, *p < 0.05, n.s. = no significant difference. Source: Authors’ own work
The figure shows three box plots. The box plot on the top left is labeled “a,” and the details for the box plot are as follows. The horizontal axis is labeled “Operative temperature,” and the markings from left to right are: “17 degrees Celsius to 19.9 degrees Celsius,” “18 degrees Celsius,” “23 degrees Celsius to 25.9 degrees Celsius,” “24 degrees Celsius,” “29 degrees Celsius to 31.9 degrees Celsius,” and “30 degrees Celsius.” The vertical axis on the left is labeled “Thermal sensation” and ranges from negative 5 to 4 in increments of 1 unit. On the right side of the vertical axis, each marking is labeled from top to bottom as follows: “4” is “very hot,” “3” is “hot,” “2” is “warm,” “1” is “slightly warm,” “0” is “neutral,” “negative 1” is “slightly cool,” “negative 2” is “cool,” “negative 3” is “cold,” and “negative 4” is “very cold.” Each marking on the horizontal axis has one box plot. For each operative temperature, the red box plot represents “R E,” and the blue box plot represents “I V E.” The details for the box plot are as follows: 17 degrees Celsius to 19.9 degrees Celsius: R E: Minimum: NIL. Lower Quartile: 1. Median: 1.5. Upper Quartile: 2. Maximum: Nil. 18 degrees Celsius: I V E: Minimum: negative 2. Lower Quartile: negative 1. Median: negative 0.8. Upper Quartile: 0. Maximum: 1. Four outliers are present horizontally between the “Maximum” of “17 degrees Celsius to 19.9 degrees Celsius,” and “18 degrees Celsius.” 23 degrees Celsius to 25.9 degrees Celsius: R E: Minimum: 0. Lower Quartile: 1. Median: 1.5. Upper Quartile: 2. Maximum: 3. 24 degrees Celsius: I V E: Minimum: 0. Lower Quartile: 0.3. Median: 0.9. Upper Quartile: 1. Maximum: 2. 29 degrees Celsius to 31.9 degrees Celsius: R E: Minimum: 2. Lower Quartile: 2.3. Median: 2.3. Upper Quartile: 2.3. Maximum: 3. 30 degrees Celsius: I V E: Minimum: NIL. Lower Quartile: 2. Median: 2.5. Upper Quartile: 3. Maximum: 4. One outlier is present between the “Maximum” of “23 degrees Celsius to 25.9 degrees Celsius” and “24 degrees Celsius.” The box plot on the top right is labeled “b,” and the details for the box plot are as follows. The horizontal axis is labeled “Operative temperature,” and the markings from left to right are: “17 degrees Celsius to 19.9 degrees Celsius,” “18 degrees Celsius,” “23 degrees Celsius to 25.9 degrees Celsius,” “24 degrees Celsius,” “29 degrees Celsius to 31.9 degrees Celsius,” and “30 degrees Celsius.” The vertical axis on the left is labeled “Thermal comfort” and ranges from negative 1.0 to 1.5 in increments of 1 unit. On the right side of the vertical axis, some markings are labeled from top to bottom as follows: “1.0” is “warm discomfort,” “0.0” is “comfortable,” and “negative 1.0” is “cold discomfort.” Each marking on the horizontal axis has one box plot. For each operative temperature, the red box plot represents “R E,” and the blue box plot represents “I V E.” The details for the box plot are as follows: 17 degrees Celsius to 19.9 degrees Celsius: R E: Minimum: NIL. Lower Quartile: 0.0. Median: negative 0.25. Upper Quartile: 0.75. Maximum: 1.0. 18 degrees Celsius: I V E: Minimum: 0.0. Lower Quartile: 0.0. Median: negative 0.0. Upper Quartile: 0.0. Maximum: 0.0. 23 degrees Celsius to 25.9 degrees Celsius: R E: Minimum: NIL. Lower Quartile: 0.0. Median: 0.4. Upper Quartile: 1.0. Maximum: NIL. 24 degrees Celsius: I V E: Minimum: 0.0. Lower Quartile: 0.1. Median: 0.1. Upper Quartile: 0.1. Maximum: 1.0. 29 degrees Celsius to 31.9 degrees Celsius: R E: Minimum: 0.0. Lower Quartile: 0.75. Median: 0.75. Upper Quartile: 0.75. Maximum: 1.0. 30 degrees Celsius: I V E: Minimum: 0.0. Lower Quartile: 0.9. Median: 0.9. Upper Quartile: 0.9. Maximum: 1.0. The box plot on the bottom center is labeled “c,” and the details for the box plot are as follows. The horizontal axis is labeled “Operative temperature,” and the markings from left to right are: “17 degrees Celsius to 19.9 degrees Celsius,” “18 degrees Celsius,” “23 degrees Celsius to 25.9 degrees Celsius,” “24 degrees Celsius,” “29 degrees Celsius to 31.9 degrees Celsius,” and “30 degrees Celsius.” The vertical axis on the left is labeled “Thermal preferences” and ranges from negative 1.5 to 1.5 in increments of 1 unit. On the right side of the vertical axis, some markings are labeled from top to bottom as follows: “1.0” is “warmer,” “0.0” is “no change,” and “negative 1.0” is “cooler.” Each marking on the horizontal axis has one box plot. For each operative temperature, the red box plot represents “R E,” and the blue box plot represents “I V E.” The details for the box plot are as follows: 17 degrees Celsius to 19.9 degrees Celsius: R E: Minimum: NIL. Lower Quartile: negative 1.0. Median: negative 0.0. Upper Quartile: 0.4. Maximum: 1.0. 18 degrees Celsius: I V E: Minimum: negative 1.0. Lower Quartile: 0.0. Median: 0.0. Upper Quartile: 0.0. Maximum: 1.0. 23 degrees Celsius to 25.9 degrees Celsius: R E: Minimum: NIL. Lower Quartile: 1.0. Median: negative 0.75. Upper Quartile: 0.0. Maximum: NIL. 24 degrees Celsius: I V E: Minimum: NIL. Lower Quartile: 1.0. Median: negative 0.4. Upper Quartile: 0.0. Maximum: NIL. One outlier is present between the “Maximum” of “23 degrees Celsius to 25.9 degrees Celsius” and “24 degrees Celsius.” 29 degrees Celsius to 31.9 degrees Celsius: R E: Minimum: negative 1.0. Lower Quartile: negative 1.0. Median: negative 1.0. Upper Quartile: negative 1.0. Maximum: negative 1.0. 30 degrees Celsius: I V E: Minimum: negative 1.0. Lower Quartile: negative 1.0. Median: negative 1.0. Upper Quartile: negative 1.0. Maximum: negative 1.0. Note: All numerical data values are approximated.Mean value test for fabrication/machine activity (a) TSV, (b) TCV and (c) TPV, ****p < 0.0001, ***p < 0.001, **p < 0.01, *p < 0.05, n.s. = no significant difference. Source: Authors’ own work
The mean level of thermal comfort showed no differences between Unreg. compared to Reg. environments, especially at 17–19 °C and 18 °C. The interquartile range for the RE indicates greater variability in their responses. A mean value test revealed no statistically significant differences between real and virtual settings at varying thermal conditions (p > 0.05), as shown in Figure 5b. This suggests there were no pronounced deviations in responses.
A box plot was used to compare thermal preference votes between Unreg. and Reg. environments across different thermal conditions, as shown in Figure 5c. Mean thermal preference was similar, particularly 17–19 °C and 18 °C, though the interquartile range for the Unreg. was wider compared to the Reg. A mean value test revealed weak statistically significant differences between both environments at 23–25 °C and 24 °C (p < 0.05) but not at 17–19 °C and 18 °C or 29–31.9 °C and 30 °C, as revealed in 5c.
Generally, there is a significant difference in thermal sensation (U = 2485.5, Z = −2.777 < −1.96; p = 0.005 < 0.05) and preferences (U = 2526.5, Z = −2.944 < −1.96; p = 0.003 < 0.05) between the RE and IVE, while there was no significant difference in thermal comfort (U = 3225.50, Z score within ±1.96; p = 0.839 > 0.05) between real and IVE during fabrication/machine activity, as revealed in Table 5.
Mann–Whitney U-test between real and virtual environments of thermal perception for fabrication/machine activity
| Parameters | Sum of ranks RE | Sum of ranks IVE | U-value | Z-score | p-value | |
|---|---|---|---|---|---|---|
| TP | TSV | 8252.50 | 5113.50 | 2485.50 | −2.777 | 0.005** |
| TCV | 7512.50 | 5853.50 | 3225.50 | −0.204 | 0.839 | |
| TPV | 6712.50 | 6653.50 | 2526.50 | −2.944 | 0.003** |
Note(s): Significant at p-value <0.05
4.4 Behaviors in Reg. and Unreg. environments
This part discusses types of behaviors observed across two environments. It compares the observed behaviors in the Unreg. environments (real) to the behavioral intentions in the Reg. environments of IVE for varied activity levels.
4.4.1 Sedentary activity
Figure 6 shows the comparison between IVE and REs based on the percentage of votes from users. Participants who chose no adaptive action had a high disparity between the real (66.3%) and IVE (16%). Also, clothing adaptations, including wearing and removing clothes, were more frequently observed in RE (16.9%) compared to IVE (12.3%), while removal of clothes was 5.6% in RE and 11.3% in IVE.
 The horizontal axis is labeled “Percentage of Votes” and ranges from 0 percent to 70 percent in increments of 10 percent. The vertical axis is labeled “Adaptive Behaviors.” The markings on the vertical axis from top to bottom are as follows: “Use heater,” “Thermostat Decrease,” “Thermostat Increase,” “Close window,” “Use of fans,” “No action or Intention,” “Wear Jacket or Cloth,” “Open window,” and “Remove Cloth or Jacket.” Each vertical axis marking has two horizontal bars, red and blue. The red bars are labeled “I V E,” and the blue bars are labeled “R E.” The data from the bars is as follows: Use heater: I V E: 4.7, R E: 0. Thermostat Decrease: I V E: 16.0, R E: 0. Thermostat Increase: I V E: 7.5, R E: 0. Close window: I V E: 0, R E: 0. Use of fans: I V E: 14.2, R E: 7.9. No action or Intention: I V E: 16.0, R E: 66.3. Wear Jacket or Cloth: I V E: 12.3, R E: 16.9. Open window: I V E: 17.9, R E: 2.2. Remove Cloth or Jacket: I V E: 11.3, R E: 5.6. Note: All numerical data values are approximated.
Adaptive behaviors of RE and IVE for sedentary. Source: Authors’ own work
The horizontal axis is labeled “Percentage of Votes” and ranges from 0 percent to 70 percent in increments of 10 percent. The vertical axis is labeled “Adaptive Behaviors.” The markings on the vertical axis from top to bottom are as follows: “Use heater,” “Thermostat Decrease,” “Thermostat Increase,” “Close window,” “Use of fans,” “No action or Intention,” “Wear Jacket or Cloth,” “Open window,” and “Remove Cloth or Jacket.” Each vertical axis marking has two horizontal bars, red and blue. The red bars are labeled “I V E,” and the blue bars are labeled “R E.” The data from the bars is as follows: Use heater: I V E: 4.7, R E: 0. Thermostat Decrease: I V E: 16.0, R E: 0. Thermostat Increase: I V E: 7.5, R E: 0. Close window: I V E: 0, R E: 0. Use of fans: I V E: 14.2, R E: 7.9. No action or Intention: I V E: 16.0, R E: 66.3. Wear Jacket or Cloth: I V E: 12.3, R E: 16.9. Open window: I V E: 17.9, R E: 2.2. Remove Cloth or Jacket: I V E: 11.3, R E: 5.6. Note: All numerical data values are approximated.Adaptive behaviors of RE and IVE for sedentary. Source: Authors’ own work
Opening of windows was common in IVE (17.9%) compared to RE (2.2%). Similarly, for thermostat adjustments, decreases and increases of the thermostat were prevalent in IVE as 16 and 7.5%, respectively, but were not applied in REs. Furthermore, the use of fans in IVE was 14.2%, while in RE it was 7.9%. Lastly, there was no closing of windows observed in either RE or VE.
4.4.2 High-intensity activity
Figure 7 shows the bar chart and comparative analysis of adaptive behaviors between IVE and REs. Users who selected no adaptive action had a high disparity between the real (72.5%) and IVE (25.3%). Also, clothing adaptations, including wearing of clothes, were more frequently observed in RE (6.6%) compared to IVE (2.4%), while removal of clothes was 5.5% in RE and 14.5% in IVE.
 The horizontal axis is labeled “Percentage of Votes” and ranges from 0 percent to 80 percent in increments of 10 percent. The vertical axis is labeled “Adaptive Behaviors.” The markings on the vertical axis from top to bottom are as follows: “Use heater,” “Thermostat Decrease,” “Thermostat Increase,” “Close window,” “Use of fans,” “No action or Intention,” “Wear Jacket or Cloth,” “Open window,” and “Remove Cloth or Jacket.” Each vertical axis marking has two horizontal bars, red and blue. The red bars are labeled “I V E,” and the blue bars are labeled “R E.” The data from the bars is as follows: Use heater: I V E: 4.8, R E: 0. Thermostat Decrease: I V E: 16.9, R E: 0. Thermostat Increase: I V E: 0, R E: 0. Close window: I V E: 0, R E: 0. Use of fans: I V E: 22.9, R E: 15.4. No action or Intention: I V E: 25.3, R E: 72.5. Wear Jacket or Cloth: I V E: 2.4, R E: 6.6. Open window: I V E: 12.0, R E: 0. Remove Cloth or Jacket: I V E: 14.5, R E: 5.5. Note: All numerical data values are approximated.
Adaptive behaviors of RE and IVE for fabrication/machine. Source: Authors’ own work
The horizontal axis is labeled “Percentage of Votes” and ranges from 0 percent to 80 percent in increments of 10 percent. The vertical axis is labeled “Adaptive Behaviors.” The markings on the vertical axis from top to bottom are as follows: “Use heater,” “Thermostat Decrease,” “Thermostat Increase,” “Close window,” “Use of fans,” “No action or Intention,” “Wear Jacket or Cloth,” “Open window,” and “Remove Cloth or Jacket.” Each vertical axis marking has two horizontal bars, red and blue. The red bars are labeled “I V E,” and the blue bars are labeled “R E.” The data from the bars is as follows: Use heater: I V E: 4.8, R E: 0. Thermostat Decrease: I V E: 16.9, R E: 0. Thermostat Increase: I V E: 0, R E: 0. Close window: I V E: 0, R E: 0. Use of fans: I V E: 22.9, R E: 15.4. No action or Intention: I V E: 25.3, R E: 72.5. Wear Jacket or Cloth: I V E: 2.4, R E: 6.6. Open window: I V E: 12.0, R E: 0. Remove Cloth or Jacket: I V E: 14.5, R E: 5.5. Note: All numerical data values are approximated.Adaptive behaviors of RE and IVE for fabrication/machine. Source: Authors’ own work
Another common behavior was the opening of windows, which was common in IVE with 12%, but did not exist in RE. In addition, for thermostat adjustments, decreases in thermostat were prevalent in IVE with 16.9% but not in existence for RE, while increases in thermostat were not applicable in either environment. Furthermore, the use of fans in IVE was 22.9%, while it was 15.4% in RE. Finally, the closing of windows was only exhibited in VE (1.2%).
Generally, there is no significant difference in adaptive behaviors between the RE and IVE for both sedentary (U = 4316, Z score within ±1.96; p = 0.290 > 0.05) and fabrication/machine activity (U = 3208, Z score within ±1.96; p = 0.066 > 0.05), as shown in Table 6.
Mann–Whitney U-test between real and virtual environments of behaviors for varied activity intensity levels
| Parameters | Sum of ranks RE | Sum of ranks IVE | U-value | Z-score | p-value | |
|---|---|---|---|---|---|---|
| Behaviors | Sedentary | 8321.00 | 10789.00 | 4316.00 | −1.057 | 0.290 |
| Fabrication/machine | 7394.00 | 7831.00 | 3208.00 | −1.840 | 0.066 |
Note(s): Significant at p-value <0.05
4.5 Post-experimental survey
A post-experimental survey was conducted to evaluate the luminous environment in VR compared to the RE, as indicated in Figure 8. Over 80% of users rated the following aspects as average, high, or very high, which include transparency of glaze for daylight penetration, similarity of luminous light quality to real, distribution of light like real, and general brightness correlation between VR and real. Concerning the CCT of VR, it was slightly less than 80% who rated it as average, high, or very high in terms of similarity to the real setting. However, more than 60% of users rated the contrast between the VR and real as ranging from average to very low.
 The horizontal axis is labeled and ranges from 0 percent to 100 percent in increments of 20 percent. The markings on the vertical axis from top to bottom are as follows: “Glaze is transparent to receive daylight,” “Luminous environment looks similar as physical,” “V R environment is in contrast with physical,” “Light is distributed well like the physical,” “C C T of V R environment replicates with the physical environment,” and “Brightness of V R environment correlates with the physical environment.” Each vertical axis marking has five stacked horizontal bars. The legend at the bottom shows red bars labeled “Very Low,” orange bars labeled “Low,” blue bars labeled “Average,” dark blue bars labeled “High,” and darkest blue bars labeled “Very High.” The data for the bars is as follows: Brightness of VR environs correlates with the physical environ: Very low: 4.2 percent, Low: 8.3 percent, Average: 16.7 percent, High: 62.5 percent, Very High: 8.3 percent. C C T of V R environ replicates with the physical environ: Very low: 0 percent, Low: 25 percent, Average: 25 percent, High: 45.8 percent, Very High: 4.2 percent. Lights are distributed well like the physical: Very low: 4.2 percent, Low: 16.7 percent, Average: 16.7 percent, High: 41.7 percent, Very High: 20.8 percent. V R environ is in contrast with physical: Very low: 8.3 percent, Low: 25 percent, Average: 16.7 percent, High: 33.3 percent, Very High: 16.7 percent. Luminous environ looks similar as physical: Very low: 0 percent, Low: 20.8 percent, Average: 33.3 percent, High: 41.7 percent, Very High: 4.2 percent. Glaze is transparent to receive daylight: Very low: 0 percent, Low: 12.5 percent, Average: 41.7 percent, High: 41.7 percent, Very High: 4.2 percent. Note: All numerical data values are approximated.
Luminous environment in VR compared with RE. Source: Authors’ own work
The horizontal axis is labeled and ranges from 0 percent to 100 percent in increments of 20 percent. The markings on the vertical axis from top to bottom are as follows: “Glaze is transparent to receive daylight,” “Luminous environment looks similar as physical,” “V R environment is in contrast with physical,” “Light is distributed well like the physical,” “C C T of V R environment replicates with the physical environment,” and “Brightness of V R environment correlates with the physical environment.” Each vertical axis marking has five stacked horizontal bars. The legend at the bottom shows red bars labeled “Very Low,” orange bars labeled “Low,” blue bars labeled “Average,” dark blue bars labeled “High,” and darkest blue bars labeled “Very High.” The data for the bars is as follows: Brightness of VR environs correlates with the physical environ: Very low: 4.2 percent, Low: 8.3 percent, Average: 16.7 percent, High: 62.5 percent, Very High: 8.3 percent. C C T of V R environ replicates with the physical environ: Very low: 0 percent, Low: 25 percent, Average: 25 percent, High: 45.8 percent, Very High: 4.2 percent. Lights are distributed well like the physical: Very low: 4.2 percent, Low: 16.7 percent, Average: 16.7 percent, High: 41.7 percent, Very High: 20.8 percent. V R environ is in contrast with physical: Very low: 8.3 percent, Low: 25 percent, Average: 16.7 percent, High: 33.3 percent, Very High: 16.7 percent. Luminous environ looks similar as physical: Very low: 0 percent, Low: 20.8 percent, Average: 33.3 percent, High: 41.7 percent, Very High: 4.2 percent. Glaze is transparent to receive daylight: Very low: 0 percent, Low: 12.5 percent, Average: 41.7 percent, High: 41.7 percent, Very High: 4.2 percent. Note: All numerical data values are approximated.Luminous environment in VR compared with RE. Source: Authors’ own work
Additionally, a direct comparison between the VR and RE was analysed as shown in Figure 9. All evaluated factors had a rating of 80% and above, ranging from average to very high, including VR being consistent with reality, looking like reality, being naturally scaled, visually satisfying, being as spacious as the real room, and general pleasantness. This implies that the VR environment closely aligns with the characteristics of the real-world environment under consideration. Other surveys collected were on user experience and simulation sickness. Simulation sickness was ranked as not at all, mild, moderate, and severe. Fatigue and discomfort were around 60% for not all, 25% for mild, and 15% for moderate for both activities (Arowoiya et al., 2025).
 The horizontal axis is labeled and ranges from 0 percent to 100 percent in increments of 20 percent. The vertical axis is labeled and from top to bottom the markings are: “The virtual space looks consistent with the reality,” “The virtual space looks like a reality,” “The objects in V R scale to be natural,” “There is satisfaction with the amount of view in the space,” “The room looks spacious like the physical environment,” and “The room has pleasantness.” Each vertical axis marking has five stacked horizontal bars. The legend at the bottom shows red bars labeled “Very Low,” orange bars labeled “Low,” blue bars labeled “Average,” dark blue bars labeled “High,” and darkest blue bars labeled “Very High.” The data for the bars is as follows: The virtual space looks consistent with the reality: Very Low: 0 percent, Low: 12.5 percent, Average: 20.8 percent, High: 50 percent, Very High: 16.7 percent The virtual space looks like a reality: Very Low: 0 percent, Low: 16.7 percent, Average: 25 percent, High: 41.7 percent, Very High: 16.7 percent The objects in V R scale to be natural: Very Low: 0 percent, Low: 12.5 percent, Average: 25 percent, High: 33.3 percent, Very High: 29.2 percent There is satisfaction with the amount of view in the space: Very Low: 4.2 percent, Low: 0 percent, Average: 25 percent, High: 41.7 percent, Very High: 29.2 percent The room looks spacious like the physical environment: Very Low: 0 percent, Low: 0 percent, Average: 12.5 percent, High: 58.3 percent, Very High: 29.2 percent The room has pleasantness: Very Low: 0 percent, Low: 4.2 percent, Average: 20.8 percent, High: 54.2 percent, Very High: 20.8 percent Note: All numerical data values are approximated.
Direct comparison VR environment with RE. Source: Authors’ own work
The horizontal axis is labeled and ranges from 0 percent to 100 percent in increments of 20 percent. The vertical axis is labeled and from top to bottom the markings are: “The virtual space looks consistent with the reality,” “The virtual space looks like a reality,” “The objects in V R scale to be natural,” “There is satisfaction with the amount of view in the space,” “The room looks spacious like the physical environment,” and “The room has pleasantness.” Each vertical axis marking has five stacked horizontal bars. The legend at the bottom shows red bars labeled “Very Low,” orange bars labeled “Low,” blue bars labeled “Average,” dark blue bars labeled “High,” and darkest blue bars labeled “Very High.” The data for the bars is as follows: The virtual space looks consistent with the reality: Very Low: 0 percent, Low: 12.5 percent, Average: 20.8 percent, High: 50 percent, Very High: 16.7 percent The virtual space looks like a reality: Very Low: 0 percent, Low: 16.7 percent, Average: 25 percent, High: 41.7 percent, Very High: 16.7 percent The objects in V R scale to be natural: Very Low: 0 percent, Low: 12.5 percent, Average: 25 percent, High: 33.3 percent, Very High: 29.2 percent There is satisfaction with the amount of view in the space: Very Low: 4.2 percent, Low: 0 percent, Average: 25 percent, High: 41.7 percent, Very High: 29.2 percent The room looks spacious like the physical environment: Very Low: 0 percent, Low: 0 percent, Average: 12.5 percent, High: 58.3 percent, Very High: 29.2 percent The room has pleasantness: Very Low: 0 percent, Low: 4.2 percent, Average: 20.8 percent, High: 54.2 percent, Very High: 20.8 percent Note: All numerical data values are approximated.Direct comparison VR environment with RE. Source: Authors’ own work
4.6 Discussion
4.6.1 Clothing insulation, thermal sensation, comfort, and preferences between Unreg. (real) and controlled (IVE) environments during sedentary activity
Clothing insulation had no significant differences under similar thermal conditions, i.e. 17.0–19.9 °C in RE and 18 °C in IVE. This led to non-significant differences in the thermal sensation, comfort, and preferences, indicating VR can simulate thermal perception properly under these cool conditions (Zhang et al., 2010).
Clothing values were significant between the real (23.0–25.9 °C) and virtual (24 °C) environment, which led to thermal sensation; comfort was non-significant, but thermal preference was significant. This implies that there were clothing adjustments between the RE and IVE, but they did not affect thermal sensation and comfort, except for user thermal preferences. Similarly, there was a desire to change the temperature to the ideal thermal state despite being comfortable due to cognitive cues in VR (Schweiker et al., 2020).
Clothing values were significant between the real (29.0–31.9 °C) and virtual (30 °C) environments, which resulted in thermal sensation being non-significant, but thermal comfort and preferences were significant. Based on these findings, clothing adjustments between the RE and IVE significantly influenced user thermal comfort and preferences but did not affect thermal sensation.
Generally, this study indicates that there is a significant difference in the TCV and TPV between real and IVEs during sedentary activity, whereas TSV showed no significant difference, as shown in Figure 10. These findings are partially in contrast with those of Latini et al. (2023b), who reported that TSV, TCV, and TPV show no statistically significant difference between real and IVE. This disparity implies that some factors, such as clothing level and cognitive dissonance, can influence the subjective evaluation of similar thermal conditions. Cognitive dissonance refers to users feeling similar thermal conditions in both environments but reacting to them differently in the VE.
 The flowchart shows a horizontal line spanning at the bottom, with three divisions representing three stages, arranged in a horizontal series. Labeled from left to right, these are as follows: “Independent” as the first stage, the second stage is not labeled, and the final stage is labeled “Dependent.” The flow begins from the “Independent” stage, with a text box titled “Thermal environment,” with the following labeled values: “17 to 19.9 degrees Celsius, 18 degrees Celsius,” “23 to 25.9 degrees Celsius, 24 degrees Celsius,” and “29 to 31.9 degrees Celsius, 30 degrees Celsius.” This text box is under the heading “Single-domain.” From this text box, a black solid and black dashed arrow extend rightward and point to a text box labeled “Cool White Light” in the Independent stage, also under the heading “Single-domain.” From “Cool White Light,” a set of two black arrows, one solid and one dashed, extends upward and downward and points to two text boxes. The upward arrow points to the text box labeled “Reading or Watching.” The downward arrow, also a set of two black arrows, one solid and one dashed, points to the text box labeled “Fabrication or Machine.” The text boxes “Reading or Watching” and “Fabrication or Machine” are in the Independent stage, under the heading “Behavioral.” From “Reading or Watching,” two blue solid arrows extend and point to two text boxes labeled “T S V” and “Behaviors or behavioral intentions” in the Dependent stage. From “Reading or Watching,” two red solid arrows extend and point to two text boxes labeled “T C V” and “T P V” in the Dependent stage. From “Fabrication or Machine,” two red solid arrows extend and point to two text boxes labeled “T S V” and “T P V.” From “Fabrication or Machine,” two blue solid arrows extend and point to two text boxes labeled “T C V” and “Behaviors or behavioral intentions.” At the bottom, a legend shows that a solid arrow represents “Observed environments (Makerspace)” and a dashed arrow represents “Chambers (I V E).” A blue arrow represents “Non-significant for both R E and I V E,” and a red arrow represents “Significant for both R E and I V E.”
Hypothesis testing for validating VR with the RE. Source: Authors’ own work
The flowchart shows a horizontal line spanning at the bottom, with three divisions representing three stages, arranged in a horizontal series. Labeled from left to right, these are as follows: “Independent” as the first stage, the second stage is not labeled, and the final stage is labeled “Dependent.” The flow begins from the “Independent” stage, with a text box titled “Thermal environment,” with the following labeled values: “17 to 19.9 degrees Celsius, 18 degrees Celsius,” “23 to 25.9 degrees Celsius, 24 degrees Celsius,” and “29 to 31.9 degrees Celsius, 30 degrees Celsius.” This text box is under the heading “Single-domain.” From this text box, a black solid and black dashed arrow extend rightward and point to a text box labeled “Cool White Light” in the Independent stage, also under the heading “Single-domain.” From “Cool White Light,” a set of two black arrows, one solid and one dashed, extends upward and downward and points to two text boxes. The upward arrow points to the text box labeled “Reading or Watching.” The downward arrow, also a set of two black arrows, one solid and one dashed, points to the text box labeled “Fabrication or Machine.” The text boxes “Reading or Watching” and “Fabrication or Machine” are in the Independent stage, under the heading “Behavioral.” From “Reading or Watching,” two blue solid arrows extend and point to two text boxes labeled “T S V” and “Behaviors or behavioral intentions” in the Dependent stage. From “Reading or Watching,” two red solid arrows extend and point to two text boxes labeled “T C V” and “T P V” in the Dependent stage. From “Fabrication or Machine,” two red solid arrows extend and point to two text boxes labeled “T S V” and “T P V.” From “Fabrication or Machine,” two blue solid arrows extend and point to two text boxes labeled “T C V” and “Behaviors or behavioral intentions.” At the bottom, a legend shows that a solid arrow represents “Observed environments (Makerspace)” and a dashed arrow represents “Chambers (I V E).” A blue arrow represents “Non-significant for both R E and I V E,” and a red arrow represents “Significant for both R E and I V E.”Hypothesis testing for validating VR with the RE. Source: Authors’ own work
Another study highlighted that occupants engaged in sedentary activities are more sensitive to thermal comfort than to thermal sensation in a controlled setting (Heydarian et al., 2015a). This emphasizes the importance of why designers should not rely solely on thermal sensation data in IVEs but also examine psychological comfort and preferences of users in IVEs. This would aid in addressing the accuracy and effectiveness of IVEs' collected data.
Overall, clothing insulation revealed a significant difference between real and IVE during sedentary activity. This implies that users' adjusted clothing insulation is different in both settings, and the adaptation was inadequate to maintain comfort despite similar thermal sensations felt. This results in users' decreased comfort and stronger preference for cooling in IVE compared to RE. Clothing is an important adaptive behavior that aids in decreasing the rate of heat emission to the outside, making the body warm, which is common in real settings because of low metabolic heat production (Wang et al., 2020).
4.6.2 Clothing insulation, thermal sensation, comfort, and preferences between Unreg. (real) and controlled (IVE) environments during high-intensity activity
The clothing insulation values had significant differences despite temperatures being relatively similar (i.e.17.0–19.9 °C in RE and 18.0 °C in IVE). This led to non-significant differences in the thermal comfort and preferences, except in thermal sensation. This indicates that differences in clothing insulation values led to different thermal sensations (i.e. users felt a bit cooler in an IVE setting than in RE). Although the comfort and preferences did not change, which implies users were able to accept the cooler without discomfort or desire to adjust the environment (Zhang et al., 2010). Furthermore, the significant difference in thermal sensation might be characterized by heat transfer mechanisms such as conduction and radiation, which are prominent in the RE compared to IVEs (American Society of Heating, Refrigerating and Air-Conditioning Engineers, 2021).
Clothing values were not significant between the real (23.0–25.9 °C) and VE (24 °C), leading to thermal comfort being non-significant, but thermal sensation and preferences were significant. This result is consistent with Yeom et al. (2019) on thermal sensation in users. This implies that although the clothing insulation was consistent, there are differences in how users feel and what they prefer between RE and IVE settings. Also, this can be a result of cognitive illusion, where users feel equally satisfied in both real and virtual environments despite perceiving thermal sensation and thermal preference differently. This suggests that thermal satisfaction in IVEs may be influenced by perceived control, task-related or environmental realism rather than physical stimuli.
The clothing values were not significant between the real (29.0–31.9 °C) and VE (30 °C), resulting in thermal sensation, comfort, and preferences being non-significant. This result during the hot condition is in support of the findings (Latini et al., 2023b) on thermal perception. This implies that virtual environments provide the same thermal experiences as the real settings, which supports the validity of VR for simulating warm thermal environments.
In general, clothing insulation showed no significant difference between real and IVEs during fabrication/machine activity. This indicates that the high metabolic heat generated ameliorates the clothing insulation level in a RE, making it similar to the controlled settings, i.e., IVE (Zhai et al., 2020). Users in REs decrease the clothing values due to high metabolism to suit their thermal comfort. Finally, thermal sensation and preference data had significant differences between real and IVEs, except for thermal comfort, as revealed in Figure 10.
4.6.3 User adaptive behaviors between Unreg. (real) and controlled (IVE) environments and across varied activity levels
There was a disparity in the percentage of votes of users who selected no action/intention between real and IVEs. This implies that users in REs feel more thermally comfortable or less inclined to make thermal adjustments. Conversely, users in the virtual environments are more responsive to perceived thermal discomfort during sedentary and fabrication/machine activities (Saeidi, 2016).
Interestingly, in the RE, users adjust clothing insulation level rather than using building systems. These personal adaptive strategies had a higher percentage in real compared to the virtual environments (Hou et al., 2021). This can be attributed to users' limited control over the thermostat compared to the VE, which was vice versa during sedentary and high-intensity activities. In general, users were more inclined to engage in adaptive strategies compared to the RE for sedentary activity.
Similarly, the use of fans was selected as users' adaptive behavior strategy in IVEs, which had a higher percentage of votes compared to the RE (Al-Absi and Abas, 2019). This means that air movement is preferred as a strategy for managing thermal conditions in virtual environments compared to RE. Although the study revealed that the behavioral differences between real and IVE were not significant during both sedentary and fabrication/machine activity. This implies that VR is an effective and promising tool for human–building interaction investigations and could depict or replicate real-world behaviors (Latini et al., 2023b).
4.6.4 Implications for practice and research
The findings from this study highlight the viability of IVEs for simulating thermal perception, comfort, and adaptive behaviour during various activity levels. The validation that IVEs can replicate a RE, most especially for thermal sensation and comfort during sedentary and high-intensity activity, respectively, under cool, moderate, and hot conditions. This has profound implications for early-stage design and decision-making in the architecture, engineering, and construction (AEC) industry. Designers, engineers, and environmental consultants can now employ validated VR simulations to test and refine heating, ventilation, and air conditioning (HVAC) strategies, occupant satisfaction thresholds, and passive thermal design interventions without the need for costly and time-intensive repeated field testing.
This study contributes to the evolving body of knowledge on virtual environmental validity and user-centric evaluation tools in building science across activity levels. Also, the role of clothing insulation and thermal preference divergence indicates the influence of cognitive-affective factors such as perceived control, thermal expectations, and cognitive dissonance in virtual comfort assessments. These results support adaptive comfort theory (de Dear & Brager) and PMV (Fanger), alongside constructs like perceived realism, behavioral intention, and embodied experience, in IVE studies.
This validation framework offers a cost-effective alternative to physical prototyping. It enables AEC professionals to visualize and assess thermal performance under various activity scenarios before construction starts. This can help to reduce energy inefficiencies and enhance post-occupancy satisfaction. Also, reduced physical prototyping and improved iteration cycles of VR enhance cost savings, which offer a commercial benefit in building projects.
VR-based thermal validation supports sustainability rating tools by demonstrating performance under user-centered comfort. Furthermore, integrating IVE-based assessments in early design stages can enhance stakeholder engagement, especially in education, healthcare, and workplaces where occupant comfort influences productivity and well-being. By simulating realistic building conditions, clients and end-users can provide informed input before physical construction, thereby making final design outcomes align with actual user needs.
5. Conclusion, limitations, and area of further studies
VR has emerged as a suitable tool that could replicate real-life scenarios across different activity intensity levels, which supports its application in the AEC sector and in the field of comfort and behavior. This study contributes to investigating thermal comfort perception and user-adaptive behaviors in both Unreg. and Reg. environments for varied activity intensity levels, emphasizing the need to validate IVEs.
A between-subjects and repeated measures design was adopted, comparing real and virtual environments under similar thermal conditions. Both sedentary and high-intensity activities carried out in REs were replicated in the virtual environments. After the end of the experiment for both sedentary and high-intensity activity, ecological validity surveys were collected and analysed for luminous environment in VR, replicating the RE, and a direct comparison of general IVE to the RE.
Findings revealed that thermal comfort and preferences during sedentary activities differed significantly between Unreg. (adaptive) and Reg. (rational) environments for sedentary activities, except thermal sensation. This disparity is characterized by users in Unreg. settings adopting behavioral coping strategies that alter their thermal perception. Significant differences in thermal sensation and preferences were observed between the two environments for high-intensity activity, except for thermal comfort. This implies that the perceived user comfort level aligns across rational and adaptive thermal comfort conditions despite differences in sensation and preferences.
One of the key limitations of the study is that the Unreg. is autonomously controlled by the building property at the university. Users devise means to maintain their thermal comfort during cold or hot conditions, such as adjusting their clothing level and using fans, which potentially limits the generalizability of these behaviors. These observed behaviors might not depict the holistic behavior of individuals if users had full control over the HVAC system, despite the results showing no significant difference between IVEs. Other limitations include asymmetry design due to practical constraints, temporal synchronization, hardware fidelity, and user fatigue (mild and moderate) during VR experiments.
Future research should explore the boundary conditions at which IVE simulations begin to differ from real-world experiences, particularly in extreme thermal conditions or prolonged exposures. Also, investigating the role of sensory feedback, avatar, and thermal realism could help refine VR tools for evaluating building comfort. It would be useful to compare how users behave in VR versus a RE over time. Exploring other physical activities such as cycling, running, and gymnastics across both real and virtual environments. Finally, incorporating how users perceive thermal conditions, visual, and behavioral conditions across Unreg. and Reg. environments with matched and balanced samples give comprehensive validation.
Ethical statement
This study was conducted in accordance with the ethical standards of the Monash Human Ethics Committee. Informed consent was obtained from all individual participants included in the study. All data were anonymized to ensure privacy and confidentiality. No vulnerable populations were involved, and participation was entirely voluntary with the right to withdraw at any time without penalty.
AI tools were used for grammatical corrections and conciseness.

