The purpose of this paper is to investigate whether management strategies implemented by non-commercial traders may be identified as a key factor in affecting oil price paths in the conventional pre- and post-financialization periods.
By using a vector autoregressive approach the dynamic analysis of the daily stock indexes for some of the most important world economies and the oil prices is conducted starting from 1992 to the end of 2020.
The findings do not support the idea that the financial markets act as a privileged conduit in transmitting the shocks to the oil spot quotations.
Such a direct assessment has not been previously proposed in literature wherein – under a financial perspective – the returns are generally taken into consideration.
Introduction
From the early 2000s, commodity future markets experienced remarkable changes in the number and the nature of active professional operators (Domanski and Heath, 2007). The traditional dominant presence is represented by specialists (commercial hedgers) who earn risk premiums by providing insurance to commodity producers and processors (Keynes, 1930; Hirshleifer, 1988). As of the 2000s, non-commercial traders, Hedge Funds (HF), Commodity Index Funds and (mainly) Commodity Index Traders (CITs; among the other pension funds and insurance companies) entered massively as institutional players. Prudential estimates assess that the number of CITs more than quadrupled from 2000 to 2010 (Cheng et al., 2015), while the number of HF more than tripled between 2004 and 2007 (Domanski and Heath, 2007). Considering the whole figures, this process led to vast inflows of capital growing from an initial value of about US$15bn to an amount of about US$250bn in 2009 (Irwin and Sanders, 2011). Updates at the end of December 2015 report a figure over US$300bn (Baffes and Haniotis, 2016).
The different nature of participants has gone hand in hand with changes in the nature of trades. New index investing promoted possibilities to take positions without having the costs and the constraints of storage. Proper trading departments have been established by some of the largest investment banks (labeled as “Wall Street Refiners” in the case of oil) to manage the expanded use of futures contracts and open interest positions (D’Ecclesia et al., 2014; Labban, 2010). In investing others’ money and seeking overall portfolio diversification or returns (Cheng et al., 2015; Büyükşahin and Robe, 2014; Domanski and Heath, 2007; Erb and Campbell, 2006; Gorton and Rouwenhorst, 2006), the newcomers have been oriented toward taking positions on commodities, commodity futures and options on futures also by making extensive use of leverage (Cheng and Xiong, 2014). Augmented integration among commodity futures markets and the other financial markets (Tang and Xiong, 2012), along with the diffusion within investors’ portfolio of commodity indexes managed like other asset classes (stocks and bonds) (Cheng and Xiong, 2014), has been the natural corollary of such a process widely labeled as “financialization” (Davis, 2017). The 2008 testimony to the US Senate by HF manager Michael Master sparked the debate about the possibility that the financialization process has exerted a dominant role in the 2007–2008 oil bubble. Following masters’ hypothesis, an additional and influential channel of a purely financial origin would be generated by massive buy-side pressure from index funds that would force commodity prices (oil quotations in our case) to far exceed their fundamental value. Such a viewpoint received more and more attention also in the international academic debate supporting the existence of a further and specific theoretical transmission mechanism by which the stock markets and the oil prices may interact (Gkanoutas-Leventis and Nesvetailova, 2015).
This study uses the stock exchange quotations (as a proxy of traditional financial assets) and the oil crude prices data to empirically investigate:
whether the new institutional investors may have induced stocks-to-oil spillover effects able to really affect the levels of oil spot quotation; and
whether such behaviors are detectable among the different international markets.
In pursuing such aims, the paper explores the mutual relationship between quotations in the pre- and post-financialization phase. Each period is characterized by very different financial participation and legislative frameworks. Considering that the supposed financial influence on prices would have been exercised starting from the 2000s, the main contribution of this paper consists in the dynamic analysis of the variables directly involved. The prices are considered here as the main economic signals instead of the returns. Through the reciprocal behavior in the main markets, it can be appreciated whether the hypothesis finds credible confirmation in the empirical behavior. To the best of our knowledge, this direct assessment has not been previously proposed in literature wherein under a financial perspective the returns are generally taken into consideration. Three key findings emerge from the present analysis of the phenomenon.
First, by adopting a vector autoregressive (VAR) approach the paper suggests that, in the dynamic interrelationships between stocks and oil quotations, the investment styles can hardly be considered as effective drivers in this supposed financial mechanism. A coordinated behavior involving the financial assets sharing common characteristics is usually labeled as an “investment style” (Barberis and Shleifer, 2003). Thus, the role of non-commercial investors’ trading strategies is questioned.
Second, through the findings of the VAR analysis, the paper contributes to the debate investigating the inherent transmission mechanism (hypothesized from the stocks to the commodities/oil) “adopting a Granger sense” causality test. Additionally, the paper extends the period of analysis well over the 2000 fiscal year with the aim to find the traces of the existence of this investment style in the institutional player’s behavior. Indeed, whether such transfer funds mechanism had only unfolded its effects just in the 2007–2008 oil price bubble, any conclusion evoking a systematic impact on crude prices should be taken with a grain of salt. Our results seem to support this last intuition. Only two cases in the post financialization periods evidence “in the Granger anticipatory sense” a relationship between the variables coherent with a potential impact on the crude quotation levels.
Ultimately, by comparing the pre- and post-financialization period outcomes, we do not share the idea that investment styles can be identified as a decisive factor in determining and influencing oil prices on a global scale.
The rest of the paper is structured as follows. Section 2 briefly reviews the main literature both on the stock market-oil price relationship and the supposed transmission mechanism spurred by financialization issues. Section 3 provides the data and the methodology descriptions. Section 4 presents and comments the empirical results. Finally, Section 5 concludes.
Literature review
Literature on commodity markets posits that the economic mechanism has a reduced ability to differentiating between futures price movements driven by merely financial speculation or by the changes in global economic fundamentals (Cheng and Xiong, 2014). This fact is because of a strong presence of informational frictions (Singleton, 2012), to the simultaneous action of the storage demand (Kilian and Murphy, 2014; Alquist and Kilian, 2010; Fama and French, 1988; Kaldor, 1939; Working, 1949) and to the increased noise introduced by non-commercial traders (Sockin and Xiong, 2015). Specific literature on commodity markets in its most complex approach has analyzed the impacts of oil prices on stock quotations and vice versa (Degiannakis et al., 2017). An overview of the literature contributions investigating oil prices and the main economic aspects is resumed within subsequent Table 1.
On the merely financial side, a specific analysis has been developed to investigate stock-commodity markets relationships. Literature findings are quite controversial and reported in Table 2. For the specific case of crude oil, a review can be found in Fattouh et al. (2013). The discussion about a potential influence of the financialization on commodity markets is addressed, usually, adopting this causal mechanism: increased futures trading (particularly on behalf of the merely financial investors, i.e. non-commercial investors as previously cited) drives changes in the future prices, which subsequently (and indirectly) affect the spot markets both in their volatility and in their quotations (Mayer et al., 2017). To describe such a sequence, three potential channels are identified (Cheng and Xiong, 2014). First, according to the theory of storage, the futures and the spot prices are interlinked through an arbitrage process of simultaneous buying and selling operations in the different markets leading to risk-free transactions wherein the interest rates, the inventory costs and the nature of storage determine both the speed and the intensity of the price path. Second, through a risk-sharing mechanism, the commodity producers – subject to strong hedging pressures (Keynes, 1923; Hicks, 1939) – are generally net short in the futures markets. A (balanced) risk premium linking the futures and the spot prices is present for those participants willing to take long positions. Third, due to the lower amount of transaction costs, the futures prices are considered to be faster transmitters (if compared to the spot prices) of the signals regarding both the global supply and the demand dispersed information.
Interestingly, Haase et al. (2016) reviewing 100 among the most cited papers on the subject find that the number of authors supporting the existence of a speculation effect and the very opposite are about the same. Albeit different analysis and explanations pointed out by literature, the real impact of the “speculation” on the price levels remains unsolved (Fantazzini, 2016; Henderson et al., 2015). As highlighted in the introduction, the core issue in the debate is based on the final impact exerted by the activity of newcomer institutional investors tending to follow a different rationale when compared to the traditional specialists. Such activities could affect the spot prices through a purely financial channel because of the massive portfolio investment strategies. As above-mentioned in the causal mechanics (increased futures tradings by non-commercials exerting an intensive pressure on the corresponding prices then transmitted to the spot markets) the main issue becomes that of the detection of the process dynamic to validate its effectiveness. To explain the sequence, some literature contributions identify the changes in the portfolio investment style as the very first link of this causal chain. Indeed, the initial provision of the incremental liquidity to the futures market would act as the driver of the whole sequence. As detailed in those analysis investigating the change in the correlation structure between the stocks and the commodity returns, the causal mechanism should be generally characterized by this common scheme:
to compensate for a decline in stock prices, investors may reduce their commodities position and invest the proceeds in stocks. A fall in stock prices therefore transmits to the commodity market by reducing commodity prices. Similarly, an increase in stock prices induces investors to sell part of their stock holdings to back their commodity position (Adams and Glück, 2015).
Hence, these inflows and outflows of the capitals associated with the non-commercial traders’ investment styles should exert the main role in the shocks transmission from the stock markets to the commodity markets. Consequently, a well-defined sequence of events would be ignited by the increased array of the market participants that sharply and intentionally would reduce the future commodity positions after a strong decline in the stock quotations. At this stage, the effects on the futures would be transmitted to the spot commodity quotations without any substantial and plausible relation to the underlying fundamentals. The very opposite would occur with high stock prices.
A relation to our paper can be found both in the literature attempting to clarify the role of speculation (or of the institutional investors more in general) in the oil price formation (Knittel and Pindyck, 2016) and in that strand of research addressing the potential transmission mechanism interlinking the oil (or the commodities) prices and the stock market quotations (Alquist and Gervais, 2013; Maghyereh and Al-Kandari, 2007). A quite similar research hypothesis is addressed in papers testing the investors’ “herd behavior” (Balcilar et al., 2017; Demirer et al., 2015; Chang et al., 2000; Christie and Huang, 1995). Nevertheless, our aim is totally different also on this aspect. In fact, the focus is neither on the ascertainment of a real “common unidirectional behavior” among the market participants nor on the price (and return) short-term induced volatility. We do not mean to suggest that such studies do not provide useful information about the financialization issue. On the contrary, we investigate whether the systematic alternate flow of capitals between stocks and oil – resulting from investment strategies implemented by the new institutional players and boosted by financialization context – may have exerted a detectable spillover effect. Ultimately, whether this financial “interference” can be considered a significant factor in the bi-directional relationship between the oil prices and the stock markets.
Data and methodology
Data description
To pursue the aim of the article, we built a data set consisting of stock exchange daily quotations encompassing three among core industrialized (and financially advanced) countries, namely, Germany (DAX30), UK (UKFTSE100) and US New York Stock Exchange Composite Index. Additionally, we include also three main developing countries as representatives of new growing economies, namely, Brazil (IBOVESPA), China Shangai Index A (CHISHA) and India-Bombay S&P Stock Exchange Index (INDBOMB). These samples cover the period between January 1, 1992 and December 31, 2020 with 7,567 total observations. The 1992 year starting point is selected merely for practical reasons; CHISHA series is available from this date onwards. Moreover, considering that an undisputable date that sanctions the “formal” beginning of financialization does not exist (also literature does not help in this sense), we assume the 2000 year as the conventional starting point following the most authoritative and recurring indications (Cheng et al., 2015; Büyükşahin and Robe, 2014; Cheng and Xiong, 2014; Silvennoinen and Thorp, 2013; Irwin and Sanders, 2011; Domanski and Heath, 2007; Erb and Campbell, 2006; Gorton and Rouwenhorst, 2006). The critics could dispute such a division to discern pre- and post-financialization periods. However, this appears as a marginal and innocuous point. First, because, as previously specified, the rationale of the choice is suggested by the relevant literature on the topic, considering the entry into force in 2000 of the Commodities Future Modernization Act (Gkanoutas-Leventis and Nesvetailova, 2015). Second, any other option should be subject to the opposite critics considering that literature proposes this time reference.
For what concerns the oil prices, we gathered traditional widespread spot/cash oil daily quotations for the Arabian Light-Oil Dubai (AL), the Brent and the West Texas Intermediate (WTI). Without pretension to be exhaustive, even though the futures markets are distinct from the spot (or physical) markets, we examine and process the spot prices because a stable equilibrium relationship existing between the oil spot and the futures prices is empirically supported (Hache and Lantz, 2013). In the same sense, the wavelet analysis in the frequency domain was proposed by Chang and Lee (2015). Such an assumption follows the studies on the efficiency of oil market, as, for example, Crowder and Hamed (1993), Schwartz and Szakmary (1994) and Moosa and Al-Loughani (1995). The oil data cover the same time span as stock exchanges previous cited (N = 7,567) and are retrieved from Datastream accessed in April 2021.
The full abovementioned sample is, hence, divided into two sub-samples to take into account the chronological division. The first part covers the pre-financialization phase (1992:01:01–1999:12:31; N = 2,088) and is labeled by the addition of the Suffix 1. The second one includes the conventional “financialized one” (2000:01:03–2020:12:31; N = 5,479) and is indicated by Suffix 2. The descriptive statistics are summarized for the stock indexes within Table 3 and for the oil prices in Table 4. A preliminary consideration is proposed about the data treatment. More in detail, as far as the possible outliers are concerned, no formal evaluation is conducted both to detect and model them. The main reason lies in the fact that whatsoever technique – even if correctly applied – could be evaluated by the skepticals as an artificial adjustment to emphasize or induce a specific result. For what concerns the technical treatment of the stock indexes data, we decided to take their natural log transformation (nat-log or Box-Cox transformation with λ = 0 of the values) to reduce variability increases (Montgomery et al., 2015). Truly speaking, prior to the log transformation, the Brazil IBOVESPA data are “adjusted” by adding a constant c (equal to 0.39) to all the figures included in the series to succeed in the mathematical calculation considering the presence of some negative values. As well-known, such a treatment does not alter the properties of the data set. With the aim to allowing homogeneous processing of the oil series with the stock indexes, the crude oil data are previously indexed by applying the following:
and assuming I0 = 100 as the starting value of the series to recurring calculations. Similarly to the stock indexes, a nat-log transformation is applied also to the oil prices. Moreover, as far as the oil data are specifically concerned, a cointegration analysis by the Johansen (1988) test is processed to investigate a possible shared similar stochastic trend. The Johansen procedure is preferred because all the variables are treated as endogenous ones. Furthermore, whether the time series are characterized by structural breaks, the Johansen test performs better than the Engle-Granger two-step procedure in the rejection of a false unit root null hypothesis (Kisswani, 2016).
The Johansen procedure results are summarized in Table 5. They support us in considering just only one oil series later, reducing the processing time. Even if the WTI price is the world benchmark (Chevallier and Ielpo, 2013), we select the AL series to represent the whole sector only to differentiate our analysis from that usually proposed in the literature. This is coherent with Kuck and Schweikert (2017), Ghassan and Alhajoj (2016) and with Kaufman and Ullman (2009). Within the oil prices cointegration calculation, the lag order is selected by adopting the Schwarz Bayesian Criterion (BIC) after first differencing the natural-logged values to achieve stationarity. This is appropriate for large samples (Lütkepohl, 2005).
As well-known, the BIC is equal to:
where:
– L (β,σ2) is the function for the fitted models evaluated at the maximum likelihood estimates of the unknown parameters β and σ2.
– p are parameters in the model.
– T is the amount of data available, i.e. number of observations.
At this point, we will process a total of 12 stock exchange series and just two oil price series for the conventional pre and post-financialization period. All the series are not stationary, as the application of three among the most widespread formal statistical tests show. Findings are resumed in the following Table 6.
Finally, it must be pointed out that processing daily data, instead of (for example) less frequent weekly data increases the likelihood of finding a causal relationship (Schwartz and Szakmary, 1994). This is not a drawback, rather it is a strength point.
Methodology
Given that our goal is to trace out (potential) transmission effects originated by capital movements in the transfer funds mechanisms resulting from investors’ coordinated portfolio strategies (exacerbated by the financialization context as depicted in Section 2), we follow a VAR approach. However, first, it must be considered that variables have unit roots in their log values as depicted within Table 6; i.e. they are not mean-reverting. This compels us to consider two further properties of the series, stationarity after a further differentiation step and their potential cointegration. If cointegration is present, the application of a vector error correction model is preferable (Fanchon and Wendel, 1992). The unit root findings for the first differenced series are resumed in the following Table 7, wherein the main concerns are for the Brazilian series. The first differenced log IBOVESPA_1 is not coherent in Augmented Dickey-Fuller Generalized Least Squares (ADF-GLS) and Kwiatkowsky-Phillips-Schmidt-Shin (KPSS) tests results; while the first differenced log IBOVESPA_2 is not coherent with the ADF-GLS test. Also, in this case, to apply the most appropriate model, the existence of a possible cointegration relationship is tested. The outcomes are summarized in Table 8.
When a relation of cointegration among the paired combinations does not exist, we can proceed by VAR models between the first differences-logged variables (alternately used as y and x within the system of the two equations). The discrete starting basic expression is:
where vΔ1ny,t and vΔlnx,t are errors.
Equivalently, corresponding vectors calculations implemented within a proper 2 × 2 system of equations can be introduced as:
where the p vectors and related 2 × 2 matrixes are:
and the corresponding matrix formal expression of the previous basic discrete model is:
Even if some literature on the topic argues that lag order (p) of the VAR system itself has typically scarce economic interest (Ivanov and Kilian, 2005), other contributions maintain that a proper selection can be a crucial factor in the dynamic properties of the models fitted to data (Hamilton and Herrera, 2004; Kilian, 2001). A small order may induce to ignoring interesting dynamics of the variables, while a very large order reduces inefficiency in estimation (Escanciano et al., 2013). Definitely, such a specification has implications for the subsequent modeling steps (Belke et al., 2012), and we opt for a more orthodox approach by following the selection with the aid of a criterion. Within Tables 9 and 10 the essential statistics are presented for the different models (also in this case, the lag selection is informed by the BIC criterion; the heteroskedasticity-robust standard errors are calculated).
Furthermore, under the assumption of applying one standard deviation shock in the current value of one of the variables with its subsequent return to zero in the following periods, the impulse functions are elaborated to show the response over time of each endogenous variable to a shock within each equation. Additionally, the variance decompositions are presented.
Empirical results
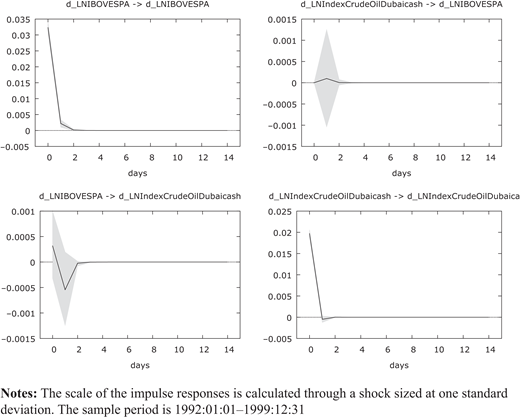
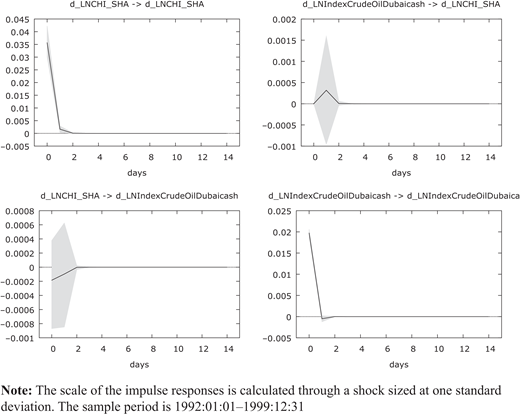
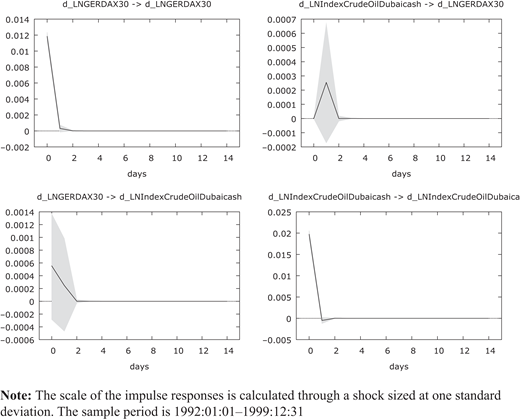
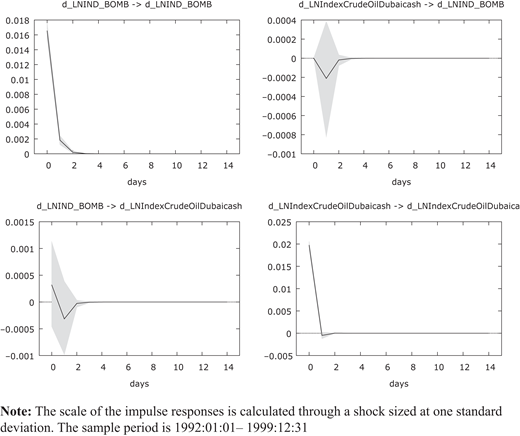
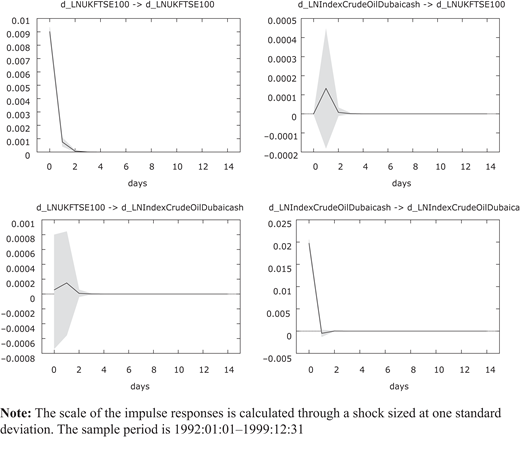
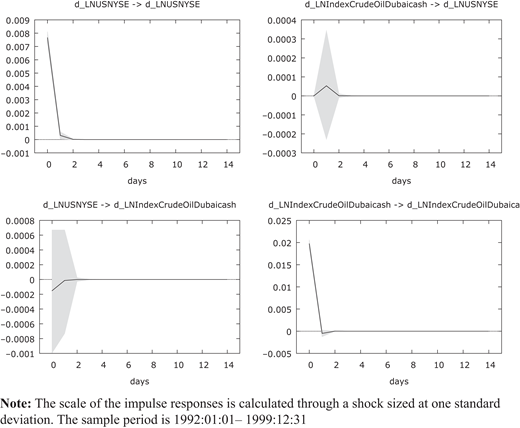
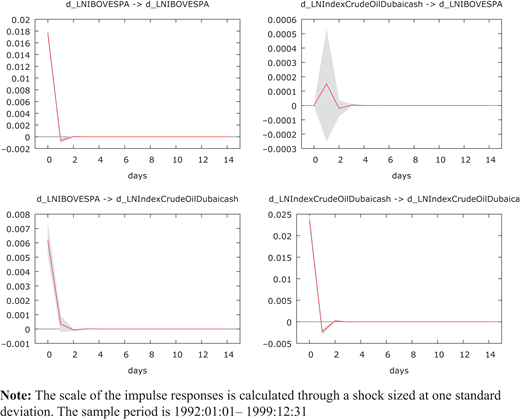
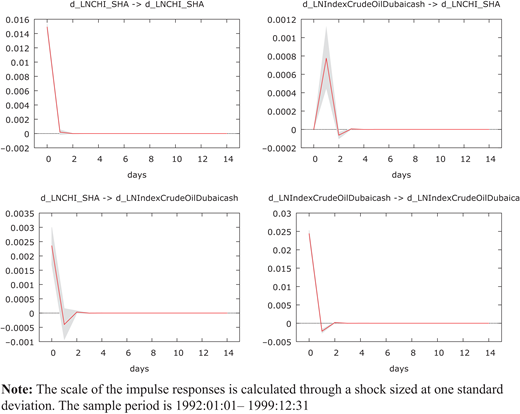
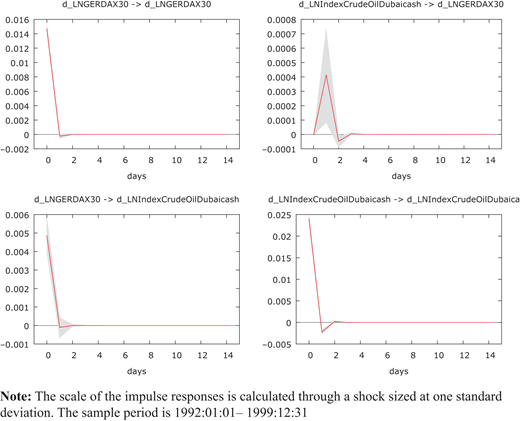
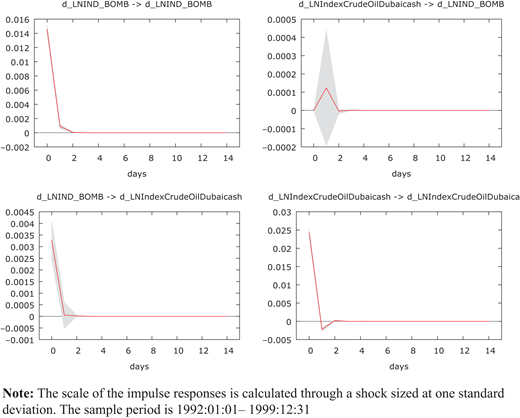
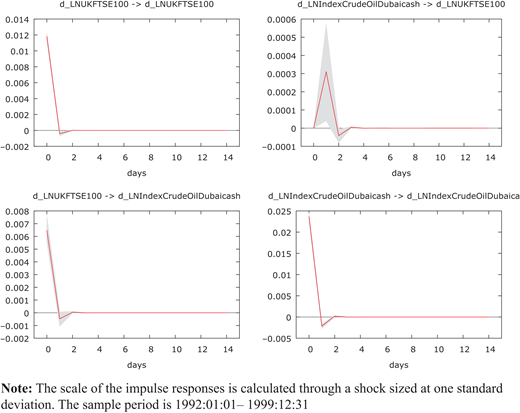
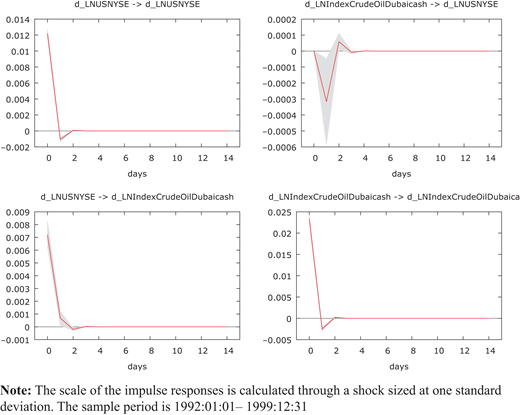
Hereunder all the different impulse-responses diagrams are reported for both periods (pre and post financialization) with the aim to compare the stochastic behaviors of the variables and their compatibility with the financial strategy. Considering each figure as a matrix-like form , it is easier to show the relevant relationships. The forecast horizon is defined for a period of 15 days. Such a time length is compatible with a reasonable reaction time on behalf of the investors using their funds with proper investment styles. Figures 1 to 6 encompass the series in the pre-financialization period (graphed in black lines). Instead, the subsequent diagrams (from Figures 7 to 12) depict the series in the post-financialization time-span (graphs in red lines). Conventionally, on the x-axis, labels start from 0 (the first day) ending to 14 (the 15th one) including the whole time period.
As can be appreciated, first, it is possible to notice that no remarkable differences exist between the two sub-periods in the various samples. In fact, in all cases except two (IBOVESPA_1 and CHISHA_1) the element in the diagrams (oil-to-oil shocks) shows a more relevant impact size than others. The influence of the oil shocks can be appreciated also by considering the forecast error variance decomposition values (Fevd). Such outcomes are resumed within Tables 11 to 22, wherein the time horizon is limited to 10 days considering the path of the curves evidenced by impulse-response graphs. Overall, the findings seem to support that the oil path is more “influenced” by “its own shocks” than otherwise. In the terms of our research aim, we can say that such outcomes are hardly consistent with a marked change in the quotations spurred by the investors’ different investment styles searching for improving portfolio diversification or positive returns. For both samples, our results are more compatible with the authoritative strand of literature, which believes that more traditional economic mechanisms are shaping crude prices than induced mechanisms of a strictly financial nature. Indeed, the two sub-samples evidence common dynamic relationships.
There are no significant impacts deriving from the use of funds by institutional investors who would have moved massively from stocks to oil.
As a corollary of previous analysis, to investigate the sequence of events (from stocks to oil, according to the investors’ fund transfer mechanism), we resume the elaboration of the F “in the Granger sense” causality tests in the following Table 23. These findings show no evidence for the pre-financialization series, as it is reasonable to expect. For the tests performed in the post-financialization period, no substantial differences are evidenced. Only for Brazil and the USA, a Granger causality is present from the stocks quotations to the oil prices. No statistically meaningful outcomes are detected in the remaining couples. The China outcomes show a reverse Granger causality, where the oil prices affect the stock exchange quotations coherently with some literature findings quoted in Table 1. In essence, it could be emphasized that in only two out of six cases there is evidence of the behavior of the series compatible with the idea of an existing and induced impact by a financial transmission mechanism that affects oil prices starting from shares.
Overall, the analysis of the international stocks markets do not support the view of a substantial difference in outcomes among the various cases (also taking into consideration that the two time periods are characterized by totally different legislative frameworks). The Granger “causality” in the USA post-financialization time-span is the only significant clue among financially advanced countries. Nevertheless, these results are opposite to impulse-response analysis deriving from all the other VAR models, and therefore, at best, an undisputable correspondence cannot be sustained. Considering that the USA are probably the most advanced financial country among industrialized ones, it could be evidenced a (weak) influence just in such a case. This was probably because of a higher sensitivity of the US market in the moment of the initial entrance and the subsequent impact of the institutional investors’ behavior. Such a specific fact may induce to suppose that if a financialization-related speculative mechanism can deploy its effects, the USA is the right place to expect to find reasonable clues. The results for Brazil are totally controversial. In more general terms, a homogeneous picture and sound support to the hypothesized merely financial action affecting the crude price path are hard to find. The literature has already advanced and proposed several competing mechanisms as potential drivers able to affect the formation of commodity prices. In detail: the strengthened role of organized markets such as commodity exchanges, the needs of new entrant institutional investors to use available capitals and the unconventional monetary policies deployed after the 2008–2009 crisis (Kang et al., 2016; Peersman and van Robays, 2014; De Gregorio, 2012). In this context also a short-run (daily?) induced volatility by a limited number of professionals or market manipulators might have exerted a specific role (Pirrong, 2017). Under this perspective, the financialization can surely be considered a “quantitative phenomenon” because of the huge (and increased) amount of trading activity recorded by the financial industry. Nonetheless, real effects on quotations are quite disputable.
As reported by the relevant literature cited in the previous section, the increased speculation activity (in this case it would be more appropriate to change the expression into, “the increased non-commercial financial activity”) can be considered the more influencing factor in the explanation of the increased return volatilities rather than in the explanation of the increase in the oil price quotations during the market instability phases.
Conclusions
The aim of this study is to contribute to the debate concerning the evaluation of a merely (supposed) financial influence on commodity prices promoted in its first step by portfolio management strategies within a financialization context. More in detail, we attempt to provide a further investigation to describe if the entry of non-commercial traders (and their augmented financial activity) exerted a determinant role in affecting (and distorting) the oil price levels. Focusing on the impact of financialization on the oil international market, we test if financial forces (having an exogenous nature to the crude oil demand-supply system) may be considered a significant driver of prices. We do not analyze the price volatility already object of previous literature (Demiralay et al., 2020; Fousekis, 2020), and under this perspective, our findings are important because they are directly derived from the dynamic analysis of the variables object of the debate. By comparing sub-sets of daily quotations concerning the conventional pre- and post-financialization periods, and applying a dynamical VAR analysis to the stock indexes-oil prices relationship both for three important industrialized countries and three important emerging economies, no statistically significant results emerge. Moreover, as a robustness check, we conduct also a traditional causality analysis “in the Granger sense” to investigate the sequence of events in the transmission mechanism. Also, this kind of procedure does not support the masters’ hypothesis. For what concerns the adopted methodology, the deliberate choice to process daily figures enhances the reliability of the outcomes. Indeed, the regression of high frequency data increases the odds of finding spurious correlations. Even “provoked” to find some correlations, the outcomes fail to support the existence of a financial transmission mechanism originated by the investment strategies able to influence the oil prices. Without any pretension of exhaustion and within the strand of the literature investigating financial interrelations between the stock markets and the crude quotations, our findings are in accordance to the authors that do not find that the financial markets act as a privileged conduit in transmitting the shocks to the oil spot quotations (Irwin and Sanders, 2012).
A further (and different) step could be implemented in a research work dedicated to the futures dynamic and their subsequent interrelation with the oil prices. The project may be to explore if a specific and more relevant effect is detectable in a well-defined (hence, limited) time-window. Thus, despite an evocative appeal, at the moment, our findings are more consistent with the position fostering the idea of a more secondary role of the financial mechanism in the overall oil price formation. Probably, the financial influence has been temporarily amplified, however, by irrational expectations and early hypertrophic development of a dedicated financial industry.
The author wish to thank the Editor and two anonymous reviewers for their useful comments.
Funding: No fund has been received to produce the manuscript.