


This study aims to examine how perceptions of corporate social responsibility (CSR) activities (i.e. environment, society and stakeholders) enhance perceived value, social media engagement to win customer loyalty in the hotel industry. In addition, it investigates the mediating effects of customer perceived value and social media engagement between CSR activities and customer loyalty.
A self-administered survey was conducted on customers in Malaysia. Based on the data collected from 389 customers, the analysis used the structural equation modelling (SEM) approach. The validity and reliability of the measurements were confirmed before the hypotheses of the study have been tested.
The results revealed that CSR related to the environment has significant direct and indirect impacts on customer loyalty. In addition, the effect of perceived value and social media engagement on customer loyalty has been supported. The results also demonstrated the mediating role of perceived value and social media engagement between CSR activities and customer loyalty.
This study advances the understanding of the impact of CSR activities, perceived value and social media engagement on customer loyalty in the hotel industry. Hoteliers can gain benefits by understanding how specific CSR activities can enhance customer perceived value and social media engagement value, thus leads to customer loyalty.
This study investigates the association between CSR activities, perceived value, social media engagement and customer loyalty, which has been lacking a full investigation in the hospitality literature.
El objetivo de este estudio es examinar cómo las percepciones de las distintas actividades de Responsabilidad Social Corporativa (RSC) (i.e., medio ambiente, sociedad y skateholders) mejoran el valor percibido por los clientes, su compromiso en medios sociales y su lealtad en la industria hotelera. También se investigan los efectos mediadores del valor percibido por el cliente y su compromiso en medios sociales sobre las relaciones entre las actividades de RSC y la lealtad.
Se realizó una encuesta autoadministrada a los clientes en Malasia. Tomando como referencia los datos recogidos de 389 clientes, se utilizó la metodología SEM. La validez y fiabilidad de las escalas de medida fueron confirmadas antes de contrastar las hipótesis del estudio.
Los resultados revelaron que sólo la RSC relacionada con el medio ambiente tiene un impacto, tanto directo como indirecto, sobre la lealtad de los clientes. Además, se han confirmado los efectos del valor percibido y el compromiso en medios sociales sobre la lealtad de los clientes. Los resultados también demostraron el papel mediador del valor percibido y el compromiso en medios sociales sobre la relación entre las actividades de RSC y la lealtad de los clientes.
Este estudio permite comprender mejor el impacto de las actividades de RSC, el valor percibido y el compromiso en medios sociales en la lealtad de los clientes en la industria hotelera. Los hoteleros pueden obtener beneficios al comprender cómo las actividades específicas de RSC pueden mejorar el valor percibido por los clientes y su compromiso en medios sociales y, por lo tanto, aumentar la lealtad de los clientes.
Este trabajo analiza la asociación entre las actividades de RSC, el valor percibido, el compromiso en medios sociales y la lealtad de los clientes, lo cual ha sido escasamente estudiado en la literatura sobre hospitalidad.
RSC, Medios sociales, Valor percibido, Compromiso, Lealtad de clientes, Industria hotelera
Trabajo de investigación
1. Introduction
As the competition continues among hotels for a larger market share, they require effective marketing strategies to attract customers and meeting their initial expectations and extending this to establishing customer loyalty and intention to revisit (Poon and Lock-Teng Low, 2005; Mohammed et al., 2017). In this case, customers in the hotel industry are becoming more aware and concerned of the inhabitants and resources of the planet (Ghosh et al., 2018), emphasising the significance of healthy environments, preserving natural resources, and understanding the effects of intellectual, emotional and spiritual well-being, which impacts their purchasing and consumption decisions (Ghaderi et al., 2019).
Such issues are an enormous challenge to hoteliers in attracting and maintaining the custom of socially and environmentally conscious customers who are concerned with corporate social responsibility (CSR) activities and business practices (Fu et al., 2014). Accordingly, hoteliers are paying more attention to practising different socially responsible activities to respond to customers’ demands (Mohammed and Rashid, 2018; Ghaderi et al., 2019). CSR can be referred to as those activities and the status of a firm that is linked to its obligations towards environment, stakeholders and the society it operates in (Tingchi Liu et al., 2014; Sen and Bhattacharya, 2001).
Several major categories of CSR have been considered and this study followed the previous studies (Dahlsrud, 2008; Singh et al., 2008; Tingchi Liu et al., 2014; Torres et al., 2012) that focussed on environmental, societal and stakeholder perspectives of CSR. Referring to environmental CSR, it includes activities that are concerned with preventing environmental pollution, conserving energy and offering green production/services (Tingchi Liu et al., 2014). It is concerned with better environmental management and business operations related to the environment (Dahlsrud, 2008). In considering the social perspective, Pinney (2001) contended that CSR is looked at as management practices by the organisation that reduces negative operational impacts on society and maximises the company’s positive impacts. Societal activities include cultural promotion, philanthropy, sustainable development and public welfare contributions (Tingchi Liu et al., 2014). Woodward-Clyde (1999) considered CSR from the stakeholder perspective, seeing it as a “contract” between organisations and society through which organisations operate business by accepting some obligations and behaving in an acceptable manner. Stakeholder activities include returns to investors, community development, treatment of employees, and control and monitoring of suppliers’ behaviour (Dahlsrud, 2008).
Studies examining the relationship between CSR and marketing results have recently emerged in the literature; however, some research gaps still need to be filled. First, the current research regarding the influence of CSR initiatives on customer loyalty is not fully investigated (Giménez García-Conde et al., 2016; Tingchi Liu et al., 2014; Su et al., 2017), and there is a lack of understanding of the mechanism that explains the relationship between CSR and customer loyalty (Kucukusta et al., 2013; Lee et al., 2018; Xie et al., 2015).
In this case, prior studies suggested that future studies should examine the influence of CSR dimensions on customer perceived value (Peloza and Shang, 2011; Servera-Francés and Piqueras-Tomás, 2019). As customer-perceived value is thought to be one of the main contributors towards consumer loyalty (Lai et al., 2009), and CSR’s success depends mainly on the customer’s value perception and it is crucial to understand the impact of perceived value on the relationship between CSR activities and customer loyalty (Arslanagic-Kalajdzic and Zabkar, 2017). Peloza and Shang (2011) also mentioned that the value of CSR activities to customers is assumed to exist, but has not been examined in an explicit way in previous research.
Second, social media has been realised as one of the most effective mechanisms that can contribute to customer loyalty (Filo et al., 2015; Saxena and Khanna, 2013). From the hotel industry perspective, customers who are more willing to use online communities also were more inclined to be positive in and recommend the company to others (Casaló et al., 2010). Zizka (2017) stated that firms could introduce and assimilate their CSR actions via social media to ensure their customers remain loyal. Moreover, it was suggested by Zizka (2017) that there is an urgent research need for further research to highlight and investigate the potential impact of social media on the relationship between CSR activities and customer loyalty in the hotel industry. Additionally, Loureiro and Lopes (2019) stated that there is still scare research regarding how CSR activities affect customers’ engagement in social media environment and how organisations should design and communicate them in such channels to achieve the best results. As a result of the limited research, the current study focusses on examining whether customers’ perception of hotels’ CSR activities influences perceived value, social media engagement and their loyalty.
2. Literature review and hypotheses development
2.1 Corporate social responsibility in hotel industry
Often the hotel industry is seen as a source of cultural, social, environmental, and economic benefits through supporting the creation of jobs, improving infrastructure and understanding culture (Bohdanowicz and Zientara, 2009). Nonetheless, because of the increasing demands of guests of hotels, there exists an increasingly negative impact, for example, biodiversity loss, waste generation, non-compliance with fundamental labour standards, air and noise pollution and the growth of prostitution (Chan, 2011). Hence, CSR is a method for hospitality firms to lower the negative impact of their activity on social, cultural and natural environments (Chan, 2011). Gligor-Cimpoieru et al. (2017) stated that CSR in the tourism sector, including the hotel industry is a crucial component for sustainable growth in the tourism sector. Therefore, over past decades, the hotel sector has been redesigned with consideration of the various CSR-related aspects, which relate to the hotel sector’s environmental impact. Hence, a green hotel, a friendly environmental hotel or similar concepts are given increasing attention in both theory and practice. As many authors (Kang et al., 2012; Timothy et al., 2009) have underlined, CSR activities, especially those related to environmental protection, are greatly valued CSR initiatives that drive visitors to pay more for a service that considers the environmental aspects. Additionally, Kucukusta et al. (2013) stated that CSR brings various benefits to hotel operations, therefore, it is strongly believed that that CSR strategy is not only needed by the business to satisfy the environment-conscious customers but also recommended as it helps in enhancing the business competitiveness (Luck and Bowcott, 2009).
2.2 Corporate social responsibility activities and customer loyalty
Customer loyalty is how attached or committed buyers are to products, services, brands or organisations (Oliver, 1999). It also provides a definition of the customer’s intention to remain with an organisation (Zeithaml et al., 1996). CSR activities (e.g. environmental, stakeholders and society) can build a stronger relationship between firms and customers (Peloza and Shang, 2011; Rivera et al., 2016; Tingchi Liu et al., 2014).
Studies have confirmed the effect of CSR activities on the attitudes and behaviour of customers; for example, Choi and La (2013) illustrated the significant effect of CSR on customer trust and loyalty, and the key mediating role of customer trust in service recovery. The perceptions of Hong Kong visitors towards CSR practices of four- and five-star hotels were examined by Kucukusta et al. (2013); their findings showed that CSR factors, namely, environment, mission and vision, significantly predicted these visitors’ stay preferences, inclination to pay, perception of quality of service and brand image. Further, the impact of environmental aspects of CSR on customer perception and their purchasing intention is widely recognised by past research. For example, Laroche et al. (2001) highlight the powerful purchasing intentions by customers who seek a more environmentally friendly lifestyle towards any brand linked to environmentally friendly practices.
Thus, customers who were familiar with a company’s CSR activities had a positive reaction to the company when purchasing their products; they rather had a more positive perception of the employment practices of the company and its investment behaviour (Creyer, 1997; Sen et al., 2006). Therefore, it follows that any perception of a CSR effort towards serving staff and customers raises customer expectations and their preferences for a specific provider, which results in higher levels of customer loyalty and enhances the repurchase intention (Tingchi Liu et al., 2014). Further, CSR activities, which are directed towards stakeholders also enhance consumer trust and lower scepticism about the company that results in higher levels of re-patronage and strengthen their intention to recommend the firm to relatives and friends (Vlachos et al., 2009). Chomvilailuk and Butcher (2010) similarly demonstrated that customers show greater loyalty and positive evaluation to firms that are socially responsible.
Recently, Sinthupundaja et al. (2018) mentioned that the practices and policies related to social and environmental responsibility are becoming necessary in the service industry such as hotel industry to face strong competition from new entries to the market. In the same vein, several studies indicated that there is a positive and significant relationship between CSR related to the environment and customers’ attraction to organisation (Marin and Ruiz, 2007; Tingchi Liu et al., 2014).
This discussion suggests that CSR activities influence customer loyalty towards a company. Therefore, the following hypotheses are proposed:
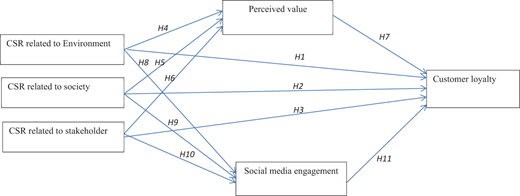
CSR related to the environment has a positive influence on customer loyalty.
CSR related to society has a positive influence on customer loyalty.
CSR related to the stakeholders has a positive influence on customer loyalty.
2.3 Corporate social responsibility activities and perceived value
Zeithaml (1988) defines customer value as customers’ overall assessment of a product’s use based on perceptions of what is given and received. Research into perceived value has considered it as a stable construct while predicting customer behaviour (Hu et al., 2009).
Subsequent to equity theory, which emphasises deservedness judgements, rightness or fairness made by an individual about what a person receives, perceived value is a method where the customer assesses how fair or equitable the treatment from a company is Oliver (1997). Maignan et al. (1999) stated that the delivery of quality products meeting consumer requirements is consistent with CSR, in particular relating to their economic responsibilities. The evidence indicates that ethical status has an impact on the consumers’ perception of a company’s equity (Maignan, 2001). When they show fairness and honesty, the customer feels equitably treated. Fairness, honesty and integrity are fundamentally linked to the ethics of a company’s social responsibility, and therefore, are demonstrative of CSR activities.
CSR activities help in the increase of advantages and the reduction of disadvantages perceived by the consumers (Hansen et al., 2008). In other words, when CSR is perceived as high in a company, the customers perceive the value of that company’s products and services are high. This is particularly evident in business services, for example, hotels, as the offer is obvious, and the customer does not usually possess the ability to make an objective assessment of quality and other intrinsic properties. They must be reliant on other cues and signals to build the perception and come to a decision. In line with this argument, previous studies found that CSR activities have significant and positive influences on customer perceived value (Arslanagic-Kalajdzic and Zabkar, 2017; Green and Peloza, 2011; Su et al., 2017; Servera-Francés and Piqueras-Tomás, 2019). It was, also, stated by Green and Peloza (2011) that CSR activities offer three types of values to the consumer as follows: functional, social and emotional.
In this case, Rowley and Moldoveanu (2003) stated that a CSR evaluation by a stakeholder must be interest-based, and thus, any evaluation of CSR initiatives is relative to their personal priorities, values and morals. Arslanagic-Kalajdzic and Zabkar (2017) also found that communication practices, which are concerned positively with CSR activities such as environmental, social and stakeholders, had a significant influence on the value perceived by clients. Therefore, scholars have indicated that the hotel industry has a huge opportunity to engage in many CSR-based activities to enhance its customer’s value and improve its market position (Fu et al., 2014; Ghaderi et al., 2019).
Based on the previous discussion, the following hypotheses are introduced for empirical examination:
CSR related to the environment has a positive significant influence on customer perceived value.
CSR related to society has a positive significant influence on customer perceived value.
CSR related to stakeholders has a positive significant influence on customer perceived value.
2.4 Perceived value and customer loyalty
Even though the customer-perceived value is comprised of multi-dimensional constructs (Roig et al., 2006), parts such as service cost are still vital in customer evaluation. As value is usually a compromise between cost and benefit, for the customer, a lower cost tends to lead to increases in customer perceived value (Zeithaml, 1988). It is, therefore, stated by Heskett et al. (1994) that customer-perceived value is a comparison of “give” attributes to “get” attributes.
Customers’ perceptions of value received from a company may persuade the customer to repurchase the products or services of the company. Thus, the customer-perceived value is positively linked to customer loyalty (Sirdeshmukh et al., 2002; Yang and Peterson, 2004). Further, past research, for example, conducted by Kwun and Oh (2004) and Tam (2004) discovered that perceived value has positive impacts on customer loyalty in restaurants. In relation to that Chen and Hu (2010) and Kuo et al. (2013) mentioned that customer perceived value could be a strong driver of customer loyalty. Based on these discussions, the following hypotheses are proposed:
Perceived value has a positive influence on customer loyalty.
2.5 Corporate social responsibility activities and social media engagement
The importance of social networks has grown tremendously in recent decades and has moved from focussing on very specific communities such as open-source software networks (Casaló et al., 2009) to generalise in very different areas of activity. Social media can be defined as an internet-based software, which is on the Web 2.0 platform and which allows internet users globally to communicate, interact and share their thoughts, ideas, experiences, relationships and information (Kaplan and Haenlein, 2010; Xiang and Gretzel, 2010).
This study built on the work of Van Asperen et al. (2018) to study consumer engagement from the online perspective (i.e. through social networking websites such as LinkedIn, Twitter and Facebook), which are amongst the most popular brands in social media tools (Heller Baird and Parasnis, 2011). Men and Tsai’s (2013) and Pagani et al. (2011) classifications argue that most customer engagement on these sites consists of two main elements as follows: contributions to social media content or actively using social media (e.g. conversing, reacting, recommending, sharing and adding) and consumption of social media content or passively using social media (e.g. reading, viewing and watching). In this study, the focus has been on the active social media engagement, which reflects the active use of social media with firms’ activities such as CSR. Therefore, if CSR activities messages are effectively communicated and targeted, the stakeholders might become an advocate; however, if not performed effectively, they may become opponents (Zizka, 2017). Using CSR actions is a choice a company has to make but cooperating with them is a different factor of strategic decision making (Zizka, 2017). Fotis et al. (2011) showed that social media is mainly used after taking a holiday to share the experience. To understand the background of tourist intention in using social media in organising holidays, Parra-López et al. (2011) discovered that a traveller’s contribution and participant in social media was accredited to what they expected from the functional, hedonic and social benefits.
In this case, previous studies have highlighted the fact that CSR activities involving the environment, society and stakeholders directly affects consumers’ choice, purchasing behaviour intentions and evaluation of a company and its products (e.g. through eWOM) (Romani et al., 2013; Sen and Bhattacharya, 2001). Furthermore, customers’ positive perception of a company’s CSR initiatives could influence them to active engagement in social media and spread positive word of mouth about that company (Jalilvand et al., 2017; Su et al., 2015).
Therefore, firms strategically use modern communication channels (e.g. LinkedIn, Facebook and Twitter) for the communication of CSR messages for increasing the engagement of customers, such channels give the possibility for a conversation between the company and the users (Kesavan et al., 2013; Etter, 2013; Schultz et al., 2013).
In this case, the social exchange theory (SET) can be used to explain the relationship between CSR activities and social media engagement. A basic principle of SET is the interchange where one party provides a benefit to another and the other party response (Cropanzano and Mitchell, 2005). More clearly, one party voluntarily provides a benefit to another and the other party is obliged to return that benefit (Whitener et al., 1998). In the hotel context, as hotels provide various benefits to their customers voluntarily beyond their obligations, customers, on the other side, translate their obligations towards these hotels in terms of social media engagement and positive electronic word of mouth (Jalilvand et al., 2017).
Based on the previous arguments, the study proposed the following hypotheses for further examination:
CSR related to the environment has a positive influence on active social media engagement.
CSR related to society has a positive influence on active social media engagement.
CSR related to stakeholders has a positive influence on active social media engagement.
2.6 Social media and customer loyalty
Social media may improve two-way communications between companies and the customer, and therefore, attach the customer increasingly to the organisation’s activities. This is in addition to social media’s ability to show the content visually, textually or verbally or using a mixture of verbal, visual and textual content (Okazaki and Taylor, 2013). Therefore, social media can establish new relationships between a company and the users (Senders et al., 2013) and it can improve customer satisfaction and then loyalty (Kasavana et al., 2010; Gamboa and Gonçalves, 2014; Serra-Cantallops et al., 2018).
Recent research has suggested that social media plays a vital role not only for the customers in a search for travel information but also added as a device for marketing tourism (Castañeda García et al., 2018; Chan and Guillet, 2011; Huang, 2012; Xiang and Gretzel, 2010). Further, this role of social media in enhancing customer loyalty has also been proved by previous studies. For example, Kim and Ko (2012) looked at the impacts of marketing activity social media has on customer loyalty. The results illustrated that social media marketing activity influences customer intentions to buy and customer loyalty through a mediating impact of brand and value equity.
Hudson et al. (2016) found that social media has an impact on a customer’s emotional relationship with a tourism brand, and therefore, on a customer’s willingness to speak positively about the company. Crofton and Parker (2012) also stated that engagement with social media as an effective marketing tool also has a positive influence on a company’s ability to increase loyalty and buying behaviour. Based on this discussion, the following hypotheses are proposed:
Social media engagement has a positive influence on customer loyalty.
All the above hypotheses in the proposed research framework are represented in Figure 1.
3. Methodology
3.1 Measurement and questioner development
All validated measurement items in this research were used in previous research. Items were measured using a seven-point Likert-type scale, which ranges from (1) “strongly disagree” to (7) “strongly agree”. Perceived CSR is measured in three dimensions (environment, social and stakeholder) adopted from previous studies (Tingchi Liu et al., 2014). This research adopted four active social media engagement items from Van Asperen et al. (2018) because it used in similar industry. Perception of customer perceived value used three items adapted from previous research studies (Ryu et al., 2012). This research measured customer loyalty using four items developed by relevant studies (Zeithaml et al., 1996; Sirdeshmukh et al., 2002; Martínez and del Bosque, 2013).
3.2 Population and sampling
The visitors to hotels in Malaysia comprise the population of this study. Because of time and budget constraints, visitors who stayed at three- to five-star hotels in two very popular tourist destinations in Malaysia, namely, Penang and Langkawi have been chosen. In each destination, we randomly select one hotel from a list obtained from the Malaysian Association of Hotels website. Then, we checked whether the chosen hotel had CSR programmes in place by browsing its website and inquiring by phone. If the hotel had formal CSR programmes indeed, it was retained; if not, we drew from the lot again until we found a qualified hotel. There are 78 hotels (three- to five-star) in the two destinations, the researchers visited 49 of them. Using the convenience sampling method, the respondents were selected based on their willingness to participate and qualified (familiar to the hotel activities). In other words, every adult tourist waiting for check-out in the hotel was approached and asked if their willing to participate in the survey. To ensure respondents’ awareness to the hotel activities, we also selected respondents who had stayed in that hotel more than one time. The survey was conducted during April and September 2017 because of facts that several holidays including school, university and public holiday were observed. A total of 450 questionnaires were distributed to the respondents. After removing some incomplete questionnaires, 389 were returned as complete and identified as eligible for further analysis.
4. Data analysis and results
4.1 Sampling profile
Table I exhibits the demographic distribution of the sample. There were 71 per cent male respondents and 29 per cent female respondents. The majority of the sample (63 per cent) were between 25 and 40 years of age; 79.4 per cent foreigners. The majority (60.9 per cent) also reported that they had jobs and about 79 per cent of them had college or undergraduate degrees.
Demographic profile of the sample (n = 389)
| Variable | Category | n | (%) |
|---|---|---|---|
| Gender | Male | 276 | 71 |
| Female | 113 | 29 | |
| Location | Penang | 161 | 41.4 |
| Langkawi | 228 | 58.6 | |
| Age | Less than 25 years | 42 | 10.8 |
| 25-30 years | 65 | 16.7 | |
| 31-35 years | 84 | 21.6 | |
| 36-40 years | 95 | 24.4 | |
| 41-45 years | 67 | 17.2 | |
| More than 45 years | 36 | 9.3 | |
| Nationality | Malaysian | 80 | 20.6 |
| Foreigners | 309 | 79.4 | |
| Occupation | Student | 19 | 4.9 |
| Self-employed | 44 | 11.3 | |
| Worker | 237 | 60.9 | |
| Retained | 77 | 19.8 | |
| Housework | 6 | 1.5 | |
| Unemployed | 6 | 1.5 | |
| Educational level | High school or below | 17 | 4.4 |
| College or undergraduate | 307 | 78.9 | |
| Postgraduate | 65 | 16.7 |
4.2 Data analysis
This study used structural equation modelling (SEM) to test the proposed model. The model encompasses the measurement model and the structural model. As suggested by Anderson and Gerbing (1988), this study examined first the confirmatory factor analysis (CFA) to check the appropriateness of the items in reflecting the concepts in their underlying constructs and to assess the extent to which the model fits the data. Some fit indices such as comparative fit index (CFI), good fit index (GFI), Tucker–Lewis index (TLI) and root mean square error approximation (RMSEA) were used. The next step was then to examine the path analysis to test the causal relationships among the latent variables, structural model and to determine the model fit to the data.
4.2.1 Results
4.2.1.1 Measurement model.
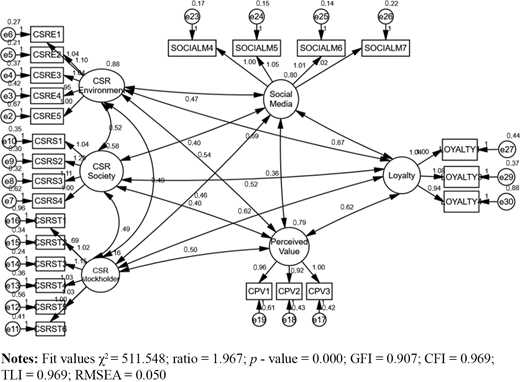
This study started first by confirming the construct validity of the measurement model by running the CFA. Once the model was proven of a good fit to the data, the study followed the SEM literature to establish the construct validity. The construct validity was determined using the factor loadings, composite reliability (CR) and the average variance extracted (AVE). Next, the study moved on to confirm the discriminant validity according to Fornell and Larcker’s (1981) criterion. Figure 2 shows the measurement model results.
4.2.1.2 Goodness of measurement model fit.
To assess the goodness of fit of the model, various indicators were used. The standardised χ2 of the measurement model was 1.967 that is less than 3.0 as recommended by Bagozzi and Yi (2011). In addition, the CFI was found to be 0.969 that exceeds the value of 0.95 as recommended by Bagozzi and Yi (2011). In addition, the non-normed fit index (NNFI or TLI) was found to be 0.969 exceeding the suggested value of 0.95 thus confirming goodness fit of the measurement model. Moreover, the value of the RMSEA was 0.050, which is lower than 0.08 as proposed by Browne and Cudeck (1993). Hence, these indicators confirmed the goodness of fit of the measurement model.
After the goodness of measurement model fit had been established, the study then moved to confirm the validity and the reliability of the constructs.
4.2.1.3 Construct validity.
Construct validity is defined in the literature as the degree to which a construct can be appropriately measured by a set of items (Hair et al., 2010). It can be confirmed by the establishment of the three types of validity, namely, the content validity, the convergent validity and the discriminant validity.
First, the study examined the content validity of the constructs by assessing the factor loadings. The results in Table II showed that all the variables displayed significant loadings on their respective constructs. This, therefore, support the content validity of the measurement model (Chin, 1998; Hair et al., 2010).
Convergence validity analysis
| Construct | Items | Statement | Loadings | SMC | 1 − SMC | CRa | AVEb |
|---|---|---|---|---|---|---|---|
| CSR to environment | CSRe5 | This hotel implements special programmes and uses relevant facilities to save and use energy efficiently, and uses renewable energy, such as solar and wind energy | 0.754 | 0.569 | 0.431 | 0.924 | 0.711 |
| CSRe4 | This hotel implements special programmes and uses relevant facilities to improve public security, fire control and food safety | 0.807 | 0.651 | 0.349 | |||
| CSRe3 | The hotel implements special programmes to reduce consumption, e.g. decrease usage of disposable goods | 0.849 | 0.721 | 0.279 | |||
| CSRe2 | This hotel has environmental-friendly design to protect natural landscapes, places of cultural and historical interest | 0.914 | 0.835 | 0.165 | |||
| CSRe1 | This hotel promotes environment protection and green consumption concepts to customers and participates in related activities | 0.882 | 0.778 | 0.222 | |||
| CSR to stakeholder | CSRst6 | Pornography, gambling and drug abuse are prohibited in this hotel | 0.860 | 0.740 | 0.260 | 0.933 | 0.702 |
| CSRst5 | This hotel complies with legal regulations completely and promptly | 0.828 | 0.686 | 0.314 | |||
| CSRst4 | This hotel provides a healthy and safe working environment for employees | 0.879 | 0.773 | 0.227 | |||
| CSRst3 | Customers’ satisfaction is highly important for this hotel | 0.930 | 0.865 | 0.135 | |||
| CSRst2 | This hotel provides full and accurate information about its products/services to customers | 0.884 | 0.781 | 0.219 | |||
| CSRst1 | This hotel respects consumer rights beyond the legal requirements | 0.605 | 0.366 | 0.634 | |||
| CSR to society | CSRs1 | This hotel supports nongovernmental organisations working in problematic areas | 0.801 | 0.642 | 0.358 | 0.875 | 0.637 |
| CSRs2 | This hotel contributes to campaigns and projects that promote the well-being of society | 0.856 | 0.733 | 0.267 | |||
| CSRs3 | This hotel makes investment to create a better life for future generations | 0.831 | 0.691 | 0.309 | |||
| CSRs4 | This hotel targets sustainable growth, which considers future generations | 0.696 | 0.484 | 0.516 | |||
| Customer perceived value | CPV3 | This hotel provides me great value as compared to others | 0.748 | 0.560 | 0.440 | 0.833 | 0.625 |
| CPV2 | The hotel experience was worth the money | 0.830 | 0.689 | 0.311 | |||
| CPV1 | This hotel offered good value for the price | 0.791 | 0.626 | 0.374 | |||
| Social media engagement | SOCIALM4 | Engaging in conversations on the Facebook page of the hotel | 0.909 | 0.826 | 0.174 | 0.951 | 0.830 |
| SOCIALM5 | Sharing hotels’ posts on my own Facebook page | 0.924 | 0.854 | 0.146 | |||
| SOCIALM6 | Recommending hotels’ Facebook page to my contacts | 0.922 | 0.850 | 0.150 | |||
| SOCIALM7 | Uploading product-related video, audio, pictures or images | 0.889 | 0.790 | 0.210 | |||
| Customer loyalty | LOYALTY1 | I usually use this hotel company as my first choice compared to other hotel brands | 0.838 | 0.702 | 0.298 | 0.851 | 0.658 |
| LOYALTY3 | I shall continue considering this one as my main hotel brand in the next few years | 0.873 | 0.762 | 0.238 | |||
| LOYALTY4 | I would recommend this hotel if somebody asked for my advice | 0.714 | 0.510 | 0.490 |
Notes:
aCR (composite reliability) = (Σ factor loading)2/{(Σ factor loading)2) + Σ (variance of error)}; bAVE (average variance extracted) = Σ (factor loading)2/{(Σ (factor loading)2 + Σ (variance of error)}. All the factor loadings are significant at the 0.001 level of significance
Second, convergent validity was investigated. It reflects the degree of convergence of a set of items in capturing the concept in the construct (Bagozzi and Yi, 2011; Hair et al., 2010). As the results in Table II show, the standardised factor loadings of all the items are larger than 0.7 as suggested by Chin et al. (1997) and statistically significant. Moreover, the CR values for all the constructs, as Table II exhibits, range between 0.851 and 0.951 thus higher than 0.7 as suggested by Fornell and Larcker (1981) and Hair et al. (2010). These results revealed a good internal consistency among the items of each construct. Furthermore, to assess the shared variance among the sets of items designed to measure the constructs, and hence, to confirm the convergent validity, the values of the AVE were assessed against the threshold value of 0.5 as suggested by Barclay et al. (1995). As reported in Table II, all the values of (AVE) ranged between 0.625 and 0.830. These results, therefore, support the convergent validity of the measurement model.
As the third measure to confirm the construct validity, the discriminant validity of the constructs was assessed. The discriminant validity of the measures is defined as the degree to which each set of items measuring a specific construct is unique as the ability to differentiate that construct from other constructs in the model. In other words, if the discriminant validity is confirmed, the items meant to measure a construct do not overlap with other items meant to measure other constructs in the model. Simply put, if the discriminant validity is assumed, the shared variance among items within the same construct is larger than that shared with other constructs in the model (Compeau et al., 1999). Following the method suggested by Fornell and Larcker (1981) and Hair et al. (2010), if all the intercorrelations among all variables are less than the square root of the AVE value of each construct. This, therefore, provides support for discriminant validity and reduces the potential of common method variance. The findings, as illustrated in Table III, showed that the square root of AVE values were higher than the intercorrelation among all the variables of the study supporting the discriminant validity of the measurement model.
Discriminant validity analysis
| Construct | (1) | (2) | (3) | (4) | (5) | (6) | Mean | SD | Minimum | Maximum |
|---|---|---|---|---|---|---|---|---|---|---|
| (1) Customer loyalty | 0.811a | 5.33 | 1.11 | 1.3 | 7.0 | |||||
| (2) Social media engagement | 0.740 | 0.911 | 5.00 | 0.94 | 2.0 | 7.0 | ||||
| (3) Customer perceived value | 0.692 | 0.454 | 0.790 | 5.33 | 0.94 | 3.0 | 7.0 | |||
| (4) CSR to stakeholder | 0.569 | 0.478 | 0.522 | 0.838 | 5.00 | 1.10 | 1.2 | 7.0 | ||
| (5) CSR to society | 0.673 | 0.591 | 0.593 | 0.597 | 0.798 | 5.25 | 0.88 | 2.8 | 7.0 | |
| (6) CSR to environment | 0.721 | 0.556 | 0.649 | 0.485 | 0.728 | 0.843 | 5.20 | 1.00 | 2.0 | 7.0 |
Note:
aThe diagonal numbers (italic) are the AVE values of each variable
4.3 Hypothesis testing
Once the measurement model was confirmed to be valid and reliable, the study proceeded to test the articulated hypotheses of the study as depicted in Figure 3. By assessing much goodness of fit measures of the structural model, all the indicators showed a good fit when compared to the threshold values as suggested by the SEM literature. For example, the scaled χ2 was 1.961, which is less than 3.0; the GFI was 0.907, higher than the threshold value of 0.90; the TLI was 0.969 and CFI was 0.969, higher than the 0.95; and RMSEA was 0.050, which is lower than 0.08. Hence, the model has adequate goodness of fit to the data (Bagozzi and Yi, 2011; Browne and Cudeck, 1993; Kline, 2011).
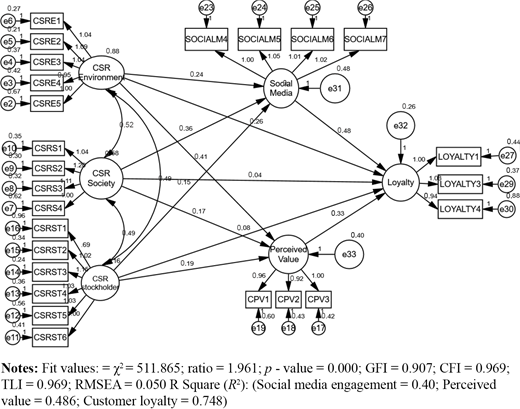
The statistical results revealed that the CSR related to environment, CSR related to society and CSR related to stakeholders are positively related to the social media engagement with standardised path coefficients of (β = 0.250, t = 3.584, p < 0.001), (β = 0.305, t = 3.804, p < 0.001) and (β = 0.175, t = 3.139, p < 0.01), respectively. Thus, H8, H9 and H10 are supported. Similarly, the results confirmed that CSR related to environment and CSR related to stakeholders have positive effects on customer perceived value, with standardised path coefficients of (β = 0.437, t = 5.69, p < 0.001) and (β = 0.225, t = 3.785, p < 0.001), respectively, hence, supporting H4 and H6. On the other hand, the results demonstrated that CSR related to society is not positively related to customer perceived value (β = 0.142, t = 1.697, p = 0.09), which does not support H5. More importantly, social media engagement and customer perceived value are positively related to customer loyalty with standardised path coefficients of (β = 0.421, t = 8.745, p < 0.001) and (β = 0.284, t = 4.858, p < 0.001), respectively. These results strongly support H11 and H7. In testing the direct effects of CSR dimensions on customer loyalty, only CSR related to environment was found to have a positive effect with a standardised path coefficient of (β = 0.239, t = 3.766, p < 0.001), whereas CSR related to society and CSR related to stakeholders, were not (β = 0.032, t = 0.486, p = 0.627), (β = 0.085, t = 1.798, p = 0.072). Therefore, these results support H1 and do not support H2 and H3 (Table IV).
Structural relationship results
| Hyp. | Hypothesis | β | Std. error | t-value | p-value | Decision |
|---|---|---|---|---|---|---|
| H1 | CSR related to environment → customer loyalty | 0.239*** | 0.069 | 3.766 | *** | Supported |
| H2 | CSR related to society → customer loyalty | 0.032 | 0.088 | 0.486 | 0.627 | Not supported |
| H3 | CSR related to stakeholders → customer loyalty | 0.085 | 0.045 | 1.798 | 0.072 | Not supported |
| H4 | CSR related to environment → customer perceived value | 0.437*** | 0.072 | 5.69 | *** | Supported |
| H5 | CSR related to society → customer perceived value | 0.142 | 0.097 | 1.697 | 0.09 | Not supported |
| H6 | CSR related to stakeholders → customer perceived value | 0.225*** | 0.049 | 3.785 | *** | Supported |
| H7 | customer perceived value → customer loyalty | 0.284*** | 0.067 | 4.858 | *** | Supported |
| H8 | CSR related to environment → social media engagement | 0.250*** | 0.067 | 3.584 | *** | Supported |
| H9 | CSR related to society → social media engagement | 0.305*** | 0.094 | 3.804 | *** | Supported |
| H10 | CSR related to stakeholders → social media engagement | 0.175** | 0.046 | 3.139 | 0.002 | Supported |
| H11 | Social media engagement → customer loyalty | 0.421*** | 0.055 | 8.745 | *** | Supported |
Notes:
*p < 0.05; **p < 0.01; ***p < 0.001
4.4 Indirect effect of social media engagement and customer perceived value
The research model implies some indirect effects that will be analysed in this section. To investigate the indirect effect of independent variables through the mediating variables, the bootstrapping and bias-corrected bootstrapping methodology as suggested by Hayes and Preacher (2014) was used where the results were generated based on 5,000 samples. As Table V illustrated, the confidence interval of the lower and higher bounds was calculated to test whether the indirect effects were significant. Moreover, the partial and full mediation effects were assessed according to the methodology suggested by Nitzl et al. (2016).
The mediation analysis results
| Indirect path hypothesis | CI; indirect effect | ||||||
|---|---|---|---|---|---|---|---|
| Indirect path coefficient | Lower bound | Upper bound | p-value | Direct path coefficient | VAF (%) | Decision | |
| CSR related to environment → social media engagement → customer loyalty | 0.114** | 0.042 | 0.207 | 0.003 | 0.239** | 32 | Partial mediation supported |
| CSR related to environment → customer perceived value → customer loyalty | 0.134*** | 0.065 | 0.263 | 0.000 | 0.239*** | 36 | Partial mediation supported |
| CSR related to society → social media engagement → customer loyalty | 0.172** | 0.078 | 0.299 | 0.001 | 0.032 | 84 | Full mediation supported |
| CSR related to society → customer perceived value → customer loyalty | 0.054 | −0.006 | 0.132 | 0.082 | 0.032 | – | No mediation |
| CSR related to stakeholders → social media engagement → customer loyalty | 0.069** | 0.019 | 0.127 | 0.007 | 0.085 | 49 | Full mediation supported |
| CSR related to stakeholders → customer perceived value → customer loyalty | 0.060** | 0.019 | 0.119 | 0.008 | 0.085 | 41 | Full mediation supported |
Notes:
*p < 0.05; **p < 0.01; *** p < 0.001. VAF: Variance accounted for
According to the results in Table V, CSR related to environment has positive indirect effects on customer loyalty through social media engagement (a × b = 0.114, lower bound = 0.042, upper bound = 0.207) and customer perceived value (a × b = 0.134, lower bound = 0.065, upper bound = 0.263). These results confirmed the partial mediating effect of social media engagement and customer perceived value. Similarly, the CSR related to society has a significant indirect effect on customer loyalty through social media engagement (a × b = 0.134, lower bound = 0.065, upper bound = 0.263), which supports the full mediation effect. On the other hand, customer perceived value has no mediating effect between CSR related to society and customer loyalty. Additionally, CSR related to stakeholders has positive and significant indirect effects on customer loyalty through social media engagement (a × b = 0.069**, lower bound = 0.019, upper bound = 0.127) and customer perceived value (a × b = 0.069**, lower bound = 0.019, upper bound = 0.119). These results, therefore, confirmed the full mediating effect of social media engagement and customer perceived value.
As the results imply, the model of the study explains 75 per cent of the variance in customer loyalty. Therefore, it suggests the importance of social media engagement and customer perceived value in explaining the mechanism of influence of CSR dimensions on the loyalty of the customers. This can enhance our understanding of the phenomenon and provide great insights to both researchers and practitioners.
5. Discussion and conclusion
5.1 Theoretical implication
From the theoretical perspective, this research makes a significant contribution to marketing literature regarding to how CSR activities influence perceived value, social media and loyalty in the hotel industry by filling the gaps that highlighted by previous researchers, including Arslanagic-Kalajdzic and Zabkar (2017), Su et al. (2017), Lee et al. (2018), Servera-Francés and Piqueras-Tomás (2019) and Loureiro and Lopes (2019).
Firstly, it is crucial to realise that limited amounts of research have been conducted in examining the influence of CSR activities on customer loyalty in the hotel industry and the previous research deals with CSR as a unidimensional construct. Thus, the current study contributes to the literature by finding that not all CSR activities are equally effective in customer loyalty. Previous research, such as Martínez and del Bosque (2013) and Su et al. (2015) recommend further research that should be conducted to investigate this research area. The results of the study confirmed that CSR activities related to environment are a driver of customer loyalty (Chomvilailuk and Butcher, 2010; Tingchi Liu et al., 2014). The results reveal that CSR activities were also found to be a significant predictor of customer perceived value and social media engagement.
Secondly, an interesting theoretical contribution in this research is found in the influences of mediation of perceived value and social media. This research expands upon Martínez and del Bosque’s (2013) research by suggesting, developing and affirming the mediating role of social media engagement and customer perceived value on relationships between CSR activities and customer loyalty. Further, as suggested by previous research in examining the mechanism variables that explain how CSR activities influence customer loyalty (Kucukusta et al., 2013; Crespo and Del Bosque, 2005), particularly customer perceived value (Arslanagic-Kalajdzic and Zabkar, 2017; Crespo and Del Bosque, 2005; Martínez and del Bosque, 2013) and social media engagement (Zizka, 2017; Loureiro and Lopes, 2019). In regard to the mediation influence of customer perceived value, the findings support the idea that customers rely highly on their perceived value in evaluating their loyalty, whilst customer perceived value is influenced significantly by CSR activity. Therefore, CSR activity determines customer perceived value that then affects loyalty.
The findings also supported the proposed mediating influence of social media engagement on the relationship between customer loyalty and CSR. These findings imply that active social media engagement is affected by the CSR activities of hotels, which then affect customer loyalty. Further, this research contributes to the hospitality literature by affirming social media engagement influence customer loyalty in the context of hotels. There is a crucial requirement to scrutinise social media influence on customer loyalty in the hospitality industry (Kandampully et al., 2015; Zeng and Gerritsen, 2014).
5.2 Managerial contribution
Generally, the results suggest that hotel managers must place more investment in socially responsible initiatives, especially environment activities, as consumers have a tendency to reward and support a company, which is perceived as socially responsible through the development of loyalty towards them. Regarding the existing evidence and that increasing focus will be placed upon sustaining and protecting the global environment, this research confirmed the crucial role of environmental CSR activities to keep and maintain long-term relationship with customers. CSR activities related to the environment includes categories such as pollution prevention, green production/service and energy conservation.
Across all three types, CSR core values act not only for profit but also in what is right, just and fair. Every element matters to customer perceived value and social media engagement in the Malaysian hotel sector, the hotel manager must be aware of the relative importance of all elements concerning customer loyalty to understand better the particular roles on the individual components. The study results also reveal that out of all the three components, the environment is the only one that has a direct significant impact towards customer loyalty. Environmental activities issues are usually seen as a vital part of attracting customers and repeated patronage decisions in the hotel industry (Gligor-Cimpoieru et al., 2017; Kucukusta et al., 2013).
Firstly, the study results reinforce the environmental dimension in being the most important factor that affects customer perceived value, social media engagement then affects customer loyalty. This research suggests priority appointed to the environmental issue and the activities that assist in protecting and maintaining the environment to establish customer perceived value and enhancing active social media engagement with the Malaysian hotels that put them ahead of competitors. The study’s discoveries reinforce that both stockholders and social CSR activity positively indirect influences customer loyalty. Secondly, the results suggest that the managers must pay more attention to CSR activity, particularly the environmental dimension as it is the important component of CSR that affects customer perceived value, and therefore, customer loyalty.
Thirdly, as CSR activities (especially CSR related to society) have a more powerful effect on active social media engagement, hospitality firms must provide resources for improvement in such areas. Hospitality firms need to place more investment in CSR initiatives as it has been shown that one of the reasons why consumers actively engage with hotels through social media is the perception and knowledge of their social responsibility. Thus, any communications that make CSR programmes more distinct, authentic and credible from a competitor will dramatically improve customer engagement. Social media provides hospitality and tourism marketers with instant methods of communication to communicate the value of the brand, corporate activity (e.g. CSR), product updates and other news into customers’ minds (Schmallegger and Carson, 2008). This concurs with Zizka (2017), who said that for the customer, CSR communications need to be available through company websites, Instagram, YouTube, Twitter and Facebook. If consumers feel a strong connection with the hotel CSR activity via social media, they will have a favourable attitude towards the organisation, which manifests in repeated buying behaviour. The findings show that hotels, which use social media activities, optimising online effectiveness and engaging with the customer, is crucial for gaining and maintaining customer loyalty. These findings also concur with previous research that shows that social media activity and consumer involvement has a positive effect on customer loyalty (Senders et al., 2013; Stephen and Galak, 2012). Thus, hoteliers must expand upon their social media efforts; they need to continue providing the opportunity for social media interaction for the consumer to share their comments and ideas. Therefore, through customer communication via various social media applications, a company might gain insight that relates to a competitive advantage and customer preference (Huang et al., 2011). This conversation may offer clues for hotel marketers to customise CSR activity for satisfying customer needs and increases in customer loyalty. For the hotelier, the results relating to the mediating role of social media engagement and customer perceived value suggests that the achievement of customer loyalty not only depends on a hotel’s capability in providing customer perceived value but also establishes favourable CSR. Therefore, the relationship between perceived value, CSR and active social media engagement should be paid attention to by hoteliers eager to increase consumer loyalty. Particularly, hoteliers must manage and market three CSR components (i.e. environment, stockholders and social) to contribute to customer perceived value in hotels and make improvement to active social media engagement with the customer, which, in turn, affects customer loyalty.
6. Limitation and future studies
Even though the majority of the hypotheses were supported, some limitations were present and paved the way for future research work. Firstly, this research tests the hypothesis with hotel customers based on suitable samples from Langkawi and Penang islands, Malaysia. Further study needs to test the model with a wider random sample or in a different context, for example, in diverse sectors of the tourism industries to generalise the obtained results. Secondly, there exist other aspects of customer loyalty, such as complaint handling and perceived quality (Martínez and del Bosque, 2013), which might be included as the explanatory power of our model requires improvement. Thirdly, using mixed methods in future research might offer greater insights into this study’s concepts and their relationships, and could offer solutions to additional questions, as to why customers actively engage with a hotel on social media and why they have concerns with specific CSR activities such as environmental activities. Finally, extended research on CSR from the perspective of different stakeholders (e.g. employees, local communities and government, etc.) might offer a better understanding of the determinants of customer loyalty in the hotel industry.

