Skip to Main Content
Purpose

This research paper aim at providing a new approach of calculating the destinations competitiveness index. How can these variables been aggregated in other to reflect the realities of very distinct productive environments? We assume that: The weighting of variables provides a better measure of destinations competitiveness. Base on the Neo-Technological theory, after a life cycle differentiation, we used a panel data approach to calculate the weight of each variable as the spearman correlation coefficient of its contribution to tourism inflows growth. After integrating these weights, we came to the point that by applying an appropriate weight to its components, we end up having a competitiveness index that significantly improve the correlation between competitiveness and tourism inflows growth.

The competition between tourist destinations that has grown over the past two decades has led to a growing need for knowledge not only about the competitive capacity of a destination but also about the strengths and weaknesses of its competitors (Pulido-Fernández and Rodríguez-Díaz, 2016). This need for knowledge acquisition has led to the emergence of a large body of economic literature based primarily on the competitiveness of tourist destinations, with an emphasis on the analysis of its determining factors. For the proponents of this orientation, the interest of their work consisted in identifying, measuring and systematising the variables which determine the competitive position of host countries. Indeed, destination competitiveness allows public authorities, destination managers as well as different tourism entrepreneurs to measure the performance of a destination in relation to its competitors (Croes and Kubickova, 2013) but also to explain and predict a country’s tourism behaviour to facilitate management decision-making (Pulido-Fernández and Rodríguez-Díaz, 2016).

While several other tools for measuring the competitiveness of tourism destinations have also been proposed by researchers over the past decade (Croes, 2011; Croes and Kubickova, 2013; Gooroochurn and Sugiyarto, 2005; Leung and Baloglu, 2013; Pulido-Fernández and Rodríguez-Díaz, 2016), it was under the impetus of the World Economic Forum (WEF) that the first annual report on the competitiveness of tourism in 124 countries around the world was published in the late 2007s. Indeed, known as the Travel and Tourism Competitiveness Report, it aims to provide a comprehensive policy tool to measure the factors and policies that make tourism development attractive; which would allow all stakeholders to work together to improve tourism competitiveness in their national economies.

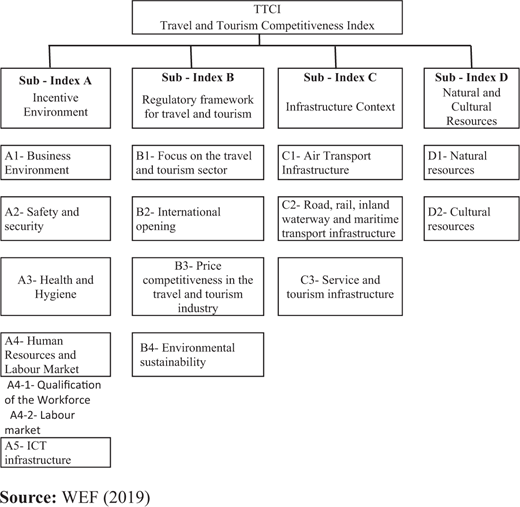
To achieve this, the WEF proposes a synthetic destination competitiveness index called the Travel and Tourism Competitiveness Index (TTCI) and four competitiveness sub-indices. The first sub-index is related to the enabling environment. The second takes into account travel and tourism policy and enabling conditions. The third is infrastructure, and the fourth is natural and cultural resources. These indices were derived from the available information, organised into 14 pillars of tourism competitiveness, which, in turn, are divided into 90 variables or indicators of competitiveness.

Although the TTCI is the most widely used instrument in international comparisons for valuing the offers of tourist destinations, two main criticisms of this index concern the nature and arbitrary weighting of the variables within each pillar. Indeed, as regards the nature of the variables, the TTCI does not take into account the market size effect as a variable which can impact on the search for competitiveness. Similarly, the weighting of the variables does not follow the logic of the growth of flows that a competitiveness indicator should reflect. In fact, in the calculation of the TTCI, all the variables have the same weight, even though their contributions to tourism demand are different; this does not make it possible to highlight the growth in flows which, implicitly, reflects the level of competitiveness of destinations. The question that arises is how to obtain a weighting of the variables that can reflect the level of competitiveness of each tourist destination as well as their sometimes very distinct productive environments? To answer this question, we formulate the hypothesis that the weighting of the variables makes it possible to obtain a measure of the competitiveness of the destinations by translating the growth of the flows generated.

To do so, considering all the variables as significant and the data collection process as efficient, and based on the neo-technological theory (Posner, 1961; Vernon, 1966) which states that it is innovation that is the source of competitiveness, and therefore only the most competitive destinations can see their flows grow and be maintained, we propose a two-step approach to calculate the weight of each of the variables. Unlike the one proposed by Pulido-Fernández and Rodríguez-Díaz, (2016), which uses a multi-objective method with a double reference point and results in a new indicator, we proceed to an improvement of the TTCI by conducting a correlation analysis. We use the information provided in the reports published by the WEF, and compare the results of the new index with those presented by the WEF, to draw some conclusions. This methodology opens up the possibility of obtaining weights for the different pillars that are not the result of an arbitrary will.

The rest of this paper is organised as follows: Section 2 presents the theoretical framework of our work. Section 3 describes the methodology used. Finally, Section 4 presents the results and implications of the study.

Competitiveness is a broad and multidimensional concept which has led to multiple definitions and models of analysis since the 17th century (Cho and Moon, 2013). In the case of tourism destinations, competitiveness is understood as the role played by stakeholders in creating and integrating value-added products to sustain resources while maintaining their market position relative to their competitors (Hassan, 2000, p. 239). However, this definition seems to be linked exclusively to the relative position of destinations in tourism markets. For example, Dwyer and Kim (2003) defineed competitiveness as the relative ability of a destination to meet the needs of visitors in different aspects of the tourism experience or to offer products and services that outperform other destinations in those aspects of the tourism experience considered important by tourists. Other authors examine competitiveness by analysing temporary fluctuations in tourist flows (Li et al., 2010), demand satisfaction (Caber et al., 2012), economic globalisation (Namhyun, 2012), tourism prices (Craigwell and Worrell, 2008; Song and Witt, 2000), sustainability and efficiency (Cracolici et al., 2008; Pulido-Fernández et al., 2015), which they consider to be variables that positively influence tourism demand decisions.

These analyses show that the degree of competitiveness of a destination may not be a significant indicator of the efficiency of its economy or the level of well-being of its population. Indeed, a tourist destination may base its competitiveness not only on low wages and few benefits but also on the availability of natural resources that are unique in the world (Juan Ignacio and Rodriguez-Díaz, 2016). This competitiveness can also be based on the existence of high productivity, which allows higher wages and excellent benefits or on an improvement in the quality of services but also of the tourist experience. This conceptual debate has given rise to various attempts to identify and systematise the factors determining the competitiveness of tourist destinations. In fact, there are several approaches in the literature that explain the competitiveness of tourist destinations. But it was under the impetus of Crouch and Ritchie (1999) that the theory was developed at the end of the 1990s. Their model forms the basis of the debate on the competitiveness of tourist destinations by integrating all the relevant explanatory factors that can influence this competitiveness.

Numerous empirical studies have used this analytical framework to explain the competitiveness of destinations (Dwyer and Kim, 2003; Dwyer et al., 2003, 2014) but also to measure the competitiveness of tourist destinations in several countries (Bahar and Kozak, 2007; Lee and King, 2009; Crouch, 2011; Dwyer et al., 2012). The main criticism of these analyses is that they could lead to less accurate results on the one hand and, on the other, do not take into account other factors and attributes that can also affect the competitiveness of destinations (Crouch, 2011). For example, Enright and Newton (2005) determine the relative importance of the attributes of tourism destination competitiveness by surveying tourism industry professionals. Based on island destinations, Croes (2011) proposes a more precise competitiveness index for tourist destinations, demonstrating that current measures of competitiveness do not meet the needs of all destinations and that there are regions with heterogeneous characteristics. Based on the aforementioned work, Croes and Kubickova (2013) propose an alternative tourism competitiveness index (TCI), which they apply to the Central American region. The same is true of Dwyer et al. (2014), who apply the integrated destination competitiveness model to data available for a set of 139 countries over the period 2007–2011. Their research involved testing the 83 competitiveness attributes of this model and the results validated the appropriateness of the model’s structure, the validity of the groups of destination competitiveness attributes and the appropriateness of the different indicators used to measure destination attributes.

Of all the indicators and measures developed, the WEF's TTCI is widely used due to its methodological superiority and comprehensiveness in terms of the range of issues considered and geographical coverage (Hanafiah and Zulkifly, 2019; Martins et al., 2017). However, like most synthetic indices, the TTCI has been criticised, particularly on methodological grounds. These criticisms focus mainly on the following points:

  • the composition of the index, in particular, the combination of raw data and survey data;

  • the use of non-weak theoretical data;

  • the comparability of countries with different levels of development;

  • the arbitrary weighting of variables; and

  • the reliability and validity of the index and of the statistical methods used to demonstrate the usefulness of the index.

To address these issues, new approaches are being used to calculate the TTCI. The first approach is based on a different standardisation and aggregation of the pillars, which makes it possible, on the one hand, to adjust the weighting and, on the other, to assess the state of all the other countries in relation to each pillar (Luque et al., 2009, 2016; Salinas Fernándeza et al., 2020). The second approach constructs the indicator by calculating the weight of its component on the basis of two reference points, using a piecewise linear realisation function for each pillar; this makes it possible to normalise the value of each country by means of reference values (Pulido-Fernández and Rodríguez-Díaz, 2016). Incidentally, although these approaches solve the main problem related to the weighting of variables in the TTCI, they still do not meet the objective of competitiveness analysis, which is to explain the growth in tourist flows. This aspect of the problem is one of our concerns in the present study.

The TTCI is constructed as the result of four sub-indicators, themselves composed of 14 pillars grouping 75 (90) variables, 47 of which are quantitative and 28 qualitative. Its basic model, inspired by Porter’s (1985) general model, Figure 1 below shows the basic TTCI model.

All the pillars that make up the sub-indicators of the TTCI are calculated on the basis of primary data drawn from the “Executive Opinion Survey” [1] conducted by the WEF on the tourism sectors of 124 countries at the outset and 140 countries in 2021, and secondary data collected from various sources [2]. The data from the survey have a varying weighting between 1 and 7, while the indicators from the secondary data are standardised to a scale of 1–7. The standard formula for converting each quantitative variable obtained from the secondary data to the 1–7 scale is as follows:

where i represents the country and j the index variables;

Xj max the maximum observed score of the variable j;

Xj min the minimum observed score of the destination competitiveness variables;

Xij the observed value of country i’s score for variable j;

Xij the estimated value of country i’s score for variable j; and

N the number of variables.

By taking into account the grouping of certain variables, it can be seen that all the criteria will ultimately have the weight of 1 in the calculation of the value of the variable. The Defense Trade Cooperation Treaties is then presented as a simple arithmetic average of the pillars and therefore of the variables that make them up. Hence, the following general formula:

where Xij represents the standardised values of the quantitative variables and the read value for the qualitative variables.

The construction of an indicator of tourism competitiveness must respect three basic principles, which we have identified as being: national and international comparability, productivity (growth at the best price) and dynamics (taking into account the time effect and sustainability). An improved critique of the TTCI and the taking into account of these basic principles will allow us to propose an indicator capable of improving the correlation between tourism competitiveness and the growth of flows.

The reconfiguration of the index that we propose is in the wake of the neo-technological theory developed by Posner (1961) and Vernon (1966). It is based on the idea that the greater the demand, the greater the need for innovation and the more the product offered will incorporate the best of the available technology as well as reflecting the current and future needs of consumers. These two theories explain how, over the course of a product's life cycle, the places where the goods are produced shift geographically, stimulating international trade. Similarly, Porter (1990) drew on the theory of comparative advantage and the notion of economies of scale to propose the concept of competitiveness clusters, which bring together, in a single geographical area and in a specific branch of activity, a critical mass of resources and skills giving this area (cluster) a key position in global economic competition. The concept of economies of scale also plays a key role in the development of clusters.

This section first presents the data used in the article before presenting the updated methodology for calculating the TCI.

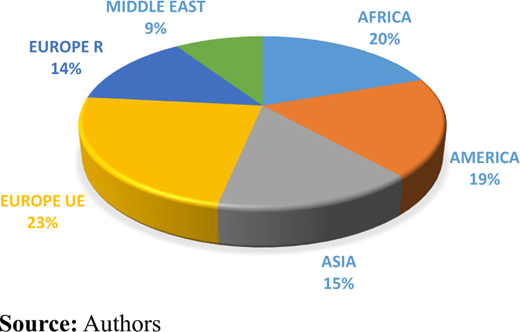
The choice of the components of our panel is based on two basic principles all linked to the notion of market size. Indeed, production and innovation are intimately linked to the size of the market and to the prospects it offers. In this work, we take into account the effects of economies of scale in relation to Parkinson’s law and the threshold effects with the principle of critical size (Lehu, 2012). This allows us to eliminate not only island destinations of less than 1,000 km in diameter but also destinations that have not been able to welcome at least 100,000 tourists per year over the past three years. In addition, for greater significance, certain countries whose political instability may lead to a poor assessment of their tourism value were also excluded from our panel; this led us to a panel of 107 countries. The data used are essentially secondary data from the databases of the WEF, the World Tourism Organisation, the Central Intelligence Agency, the World Travel and Tourism Council, the International Union for Conservation of Nature, the IMF and the World Bank. All the data sources are available in  Appendix 1 of the document. The global sample, summarised in Figure 2, thus includes: 21 African countries south of the Sahara, 20 American countries, 16 Asia-Pacific countries, 10 Middle Eastern countries including the 4 North African countries and 40 European countries including 25 members of the European Union.

The calculation of the TCI is done in three steps: the classification of destinations in the life cycle, the calculation of the correlation coefficients between the factors, and the levels of international tourist inflows, and finally the calculation of the TCI itself.

3.2.1 Destination classification.

The destinations are grouped into five phases according to their classification obtained from the theory of the life cycle of tourist destinations developed by Butler (1980). The author shows that a tourist area, i.e. a given space quantified by tourist numbers, undergoes a life cycle. He specifies that any tourist destination undergoes a phase of exploration or discovery, involvement and local training, development, consolidation and stagnation. In this study, the classification of tourist destinations is made over the whole period on the basis of the calculation of quintiles of growth rates of tourist arrivals. These quintiles thus make it possible to group the countries into five phases: exploration (EXP), involvement (INV), development (DEV), consolidation (CON) and stagnation (STA).

3.2.2 Calculation of correlation coefficients.

We calculate two types of correlation coefficients: the correlation coefficients of the factors by categories k Pk, and the correlation coefficients of variables j for country i αij. The variables are grouped into four categories called sub-indices: k = 1, 2, 3 and 4. Subsequently, the coefficients Pk and αij are calculated as correlation coefficients ρ of Spearman rank denoted:

(1)

With n representing the number of destinations in the relevant “s” phase (n = 43 for the exploration phase (EXP), 16 for the involvement phase (INV), 27 for the development phase (DEV), 03 for the consolidation phase (CON) and 18 for the stagnation phase (STA); R(DDETi) the ranking of destination i for tourism demand and R(Xij) the rank of the destination for the variable or factor Xij.

Because the correlation coefficient has a value between −1 and 1, this would lead to a competitiveness index between −7 and 7. In order to allow the value of the index to remain within the range of 0 to 7, we use the

(Y=(X+7)/2)
transformation. We will then proceed with the following transformation to obtain the corrected correlation coefficient between 0 and 1:

(2)

With ρ′ = Pk for the correlation coefficients of the factors and ρ′ = αij for the correlation coefficients of the variables.

3.2.3 Calculation of the improved tourism competitiveness index.

The fundamental difference that this index introduces is in the extremes. The minimum and maximum become those of the class to which the country belongs. This is justified by the fact that, according to the neo-technological theory, innovations will be more integrated the more significant the demand and the market growth prospects are. The formula for calculating the scores of the different pillars (variables) of the index is thus formulated as follows: If we assume: i = the country (107); j = the pillars of the index (15); s = the phases of the life cycle (5) and t = the years (2005–2019).

For each year, we have:

(3)

With, respectively, Xjsmin and Xjsmax the observed minimum and maximum of the score of variable j in phase s; Xij and Xij the observed and calculated value of the score of country i for variable j.

If we now consider Sikt as the scores of the countries i for the criterion Global (sub-index) k (with k = 1, 2, 3, 4) at date t, we will have the following formulation for the first aggregation of the variables:

(4)

where mk represents the variables of sub-indicator k. mk is the number of variables included in the overall criterion k (mk = 5 for the basic factors, mk = 5 for the development factors and mk = 4 for the expansion factors). We then ranked the destinations according to the volume of demand. On this basis, we identified three strata: destinations with less than 5 million tourist arrivals, those with between 5 and 10 million and those with more than 10 million.

This reorganisation according to the volume of demand makes it possible to give weights to the various factors (Sik) of the competitiveness of destinations. These factors represent a number of homogeneous variables in terms of their impact on the development of the destination. If we consider that Pk represents the correlation coefficient of the factor k at the level of tourist flows, we arrive at the following formulation of the calculation of the TCI:

(5)

The combination of equations (1)–(5) allows us to arrive at the following formulation of the TCI:

(6)

This formulation of the TCI allows us, in the end, to obtain an index which integrates both cycle and size effects and then, as a consequence, the real contribution of the variables and factors to the growth of tourist flows.

Our results are grouped into two subsets. Firstly, we present the calculations of the correlation coefficients of the factors and variables. Secondly, we calculate the values of the TCI.

4.1.1 Correlation coefficients of variables.

Table 1 presents the correlation coefficients of the variables at different stages of the life cycle of tourist destinations.

It can be seen from this table that the contribution of the factors to the value of a tourist offer varies greatly according to the phase of the life cycle in which the destination is located.

4.1.2 The coefficients of the competitiveness factors.

To calculate the contribution of the competitiveness factors of destinations, we have considered access to the internet as an indicator of innovation. Indeed, the greater the number of internet users, the greater the possibilities of choice of destinations for consumers and the greater the constraints of differentiation for destinations. Thus, demand is all the stronger when the tourist destination presents the latest innovations in the sector. Subsequently, considering that the basic factors for tourism development are essentially linked to the availability of infrastructure, we have chosen hotel capacity as an indicator of the maturity of infrastructure in a destination. To this end, for all the destinations in our panel, we calculated the total accommodation available. Then for each of the groups thus identified, we estimated the average bed requirement necessary to cover a substantial increase in their market share. The bed requirement rate allows us to obtain an estimate of the infrastructure requirement needed to meet the current demand from international tourism.

Finally, to obtain the weighting of the development factors, we have taken the complement to one of the two previous components. This allows us to obtain all the weights of the different factors of the competitiveness of the destinations; this leads us to Table 2 below, which presents the contribution of the three factors thus identified to the competitiveness of international tourism destinations.

Table 2 shows that priorities vary according to the volume of arrivals. While for destinations with less than 5 million tourists, infrastructure is the priority; for destinations with between 5 and 10 million tourists, it is the development of natural resources that is the priority for making their offer more competitive; and for destinations with an established reputation, it is the implementation of an appropriate regulatory framework and an incentive environment that are their priorities.

In presenting the results here, we will limit ourselves to the top and bottom ten destinations in our ranking. For more details, see the complete ranking in  Appendix 2. The TCI represents the TCI calculated over the years 2005 (05) to 2019 (19). Table 3 below gives a ranking of the ten best and worst destinations by information communication technology, while Table 4 below shows the WEF’s ranking compared with that of the authors. The full list of authors is available in  Appendix 3 of the paper.

From the ranking that results from this reformulation of the index, it is clear that young destinations such as Israel, the Republic of Korea and Ireland hold the top spot, which they share with countries such as Switzerland, Denmark, Canada and some Central European countries. These results show not only the loss of competitiveness of established destinations such as Spain, France, Germany, the USA and Japan, whose offer, although still competitive, is tending to become more popular, but also, and above all, the growing importance of young destinations in the international tourism market. Furthermore, it can be seen that the least competitive destinations are more concentrated in sub-Saharan Africa. This could be justified by the fact that generally, these countries have an important infrastructure deficit in the tourism sector and a very low visibility on the international market.

As for the index values, the results obtained show that the value of the index is no longer very high. Indeed, out of the 107 countries in our panel, the number of destinations that have reached a score of at least 3.5 (i.e. 50% of the maximum expected score of 7) hardly exceeds 10. This can be explained by the nature of the tourist activity, which mixes both the qualitative and the quantitative, the emotional and the real. The other observation that can be made is that the differences between the values of the indicators of the different destinations are not high enough for a destination to really stand out and benefit from a significant comparative advantage. Under these conditions, the behaviour of agents, the availability of an attraction or a service can impact the competitiveness of a destination. Furthermore, for the period 2005–2019, the value of the index has been eroded significantly. The maximum value has fallen from 5.4756 in 2005 to 4.0194 in 2019. This could be the consequence of a reorientation of flows due to the crisis experienced by the main sources and destinations of international tourism.

To highlight the relevance of the results thus obtained, we proceeded to compare the average growth rates for the first 30 destinations to see if they confirm the expected growth effects. This gave us Table 5 below:

Overall, Table 5 shows that the TCI of destinations significantly explains the growth of international tourism flows. Indeed, the average growth rate of the top ten destinations is significantly better than that of the second ten destinations, which is also better than that of the bottom ten destinations (4.83, 2.78 and 1.61, respectively). The same analysis based on the results of the Approche Par Compétences yields Table 6 below:

The comparison of Tables 5 and 6 shows that the TIC explains the evolution of international tourism flows better than the TTCI; this confirms the option taken with regard to the methodology for calculating the TCI. The comparison can also be extended to the correlation with the volume of arrivals. Table 7 comparing the correlations is as follows:

This table allows us to confirm that the application of an appropriate weighting makes it possible to significantly improve the correlation of the index with the volume of arrivals. However, it can be noted that for destinations in a stagnation phase, this improvement is rather mixed. This result could be explained by the volatility of the flows and above all by the threshold effects which may arise for destinations in a stagnation phase. In any case, it confirms the overall vision of this indicator.

Competitiveness is a concept that has taken on a central position in today’s globalised economy. The search for competitiveness has become a survival issue for both economies and products. In this case, it is very important that the process of assessing competitiveness is as coherent and explicit as possible. Throughout this production, we have shown that a coherent process for measuring the competitiveness of destinations in tourism must take into account at least two concerns. The first is the expected volume of tourists and its spatial concentration, as this has an influence on output and factor productivity. The second concern that needs to be incorporated into the measurement of competitiveness is the evolution of demand that we have captured through the phases of Butler’s destination life cycle. Indeed, if the volume reflects the capacity of the infrastructure, its growth reflects the updating of the offer in relation to the state of demand on the market and vice versa. These concerns, which originate in the theories of international trade, particularly the neo-technological theory developed by Posner (1961) and Vernon (1966), make the level of demand and its evolution perfect indicators of product value. This has enabled us to propose a synthetic index, the “TCI”, which is able to give a value to the destinations’ offer by relying on the real criteria revealed by the evolution of demand.

The calculation of the index and the resulting ranking thus enabled us to show that the best perception of the offer is towards Asia. Israel and Korea have emerged as the leading destinations in our ranking. On the other hand, it can be noted that Northern Europe is taking the lead over Central Europe with the offer of countries new to international tourism, such as Denmark, Sweden and Finland. But Central Europe remains the region of the world where the best-rated offers are concentrated. This is mainly the case for Ireland and Switzerland. In America, the Canadian offer is by far the best, followed by Colombia and the USA. In Asia, other new destinations, such as Thailand and Malaysia, stood out. In the Middle East, however, Israel is almost the only competitive destination in the ranking, followed by Saudi Arabia and Jordan. In Africa, the ranking is dominated by the SADEC countries (South Africa, Zambia, Namibia and Botswana).

This ranking reflects an undeniable reality, that of the obsolescence or standardisation of the offer of traditional destinations in Central Europe and America. This leads to their stagnation or even their decline in the ranking to the benefit of new destinations such as Korea, Canada, China, Sweden and Thailand. Only the African destinations do not seem to succeed in positioning themselves in this new redistribution of international tourism flows. Taking into account this ranking, policy orientations have been set out to make the market approach of the main destinations more effective. If, on the whole, destinations in a growth phase must act on infrastructures by improving their quality and territorial coverage, destinations in a discovery phase, as is the case in sub-Saharan Africa, must focus their development actions on the coverage of the sector by TIC and, above all, highlight their resources.

1.

The executive opinion survey is a perception survey conducted among 15,000 executives and business leaders in 139 countries, with an average of about 100 respondents per country. It is a comprehensive annual survey conducted by the WEF in collaboration with its network of partner institutes located in the countries surveyed.

2.

The data used comes mainly from the following sources: WEF, United Nations World Tourism Organization, World Trade Organization, Organisation de l’aviation civile internationale, International Air Transport Association, International Union for Conservation of Nature, World Bank, International Finance Corporation Doing Business, World Health Organization, World Travel and Tourism Council, Booz and Company, Virtual Instrument Software Architecture, International Telecommunication Union, Center for International Earth Science Information Network Yale University, United Nations Conference on Trade and Development and the International Congress and Convention Association.

The authors gratefully acknowledge the constructive comments of the anonymous reviewers.

Bahar
,
O.
and
Kozak
,
M.
(
2007
), “
Advancing destination competitiveness research: comparison between tourists and service providers
”,
Journal of Travel and Tourism Marketing
, Vol.
22
No.
2
, pp.
61
-
71
.
Butler
,
R.W.
(
1980
), “
The concept of a tourist area cycle of evolution: implications for management of resources
”,
The Canadian Geographer/Le Géographe Canadien
, Vol.
24
No.
1
.
Caber
,
M.
,
Albayrak
,
T.
and
Matzler
,
K.
(
2012
), “
Classification of the destination attributes in the content of competitiveness
”,
Journal of Vacation Marketing
, Vol.
18
No.
1
, pp.
43
-
56
.
Cho
,
D.
and
Moon
,
H.
(
2013
),
D'Adam Smith à Michael Porter: évolution De Théorie De la Compétitivité
,
World Scientific Publishing Co. Pte. Ltd
,
Singapour
.
Cracolici
,
M.F.
,
Nijkamp
,
P.
and
Rietveld
,
P.
(
2008
), “
Assessment of tourism competitiveness by analysing destination efficiency
”,
Tourism Economics
, Vol.
14
No.
2
, pp.
325
-
342
.
Craigwell
,
R.
and
Worrell
,
D.
(
2008
), “
The competitiveness of selected Caribbean tourism markets
”,
Social and Economic Studies
, Vol.
57
No.
1
, pp.
72
-
107
.
Croes
,
R.
(
2011
), “
Measuring and explaining competitiveness in the context of small island destinations
”,
Journal of Travel Research
, Vol.
50
No.
4
, pp.
431
-
442
.
Croes
,
R.
and
Kubickova
,
M.
(
2013
), “
From potential to ability to compete: towards a performance-based tourism competitiveness index
”,
Journal of Destination Marketing and Management
, Vol.
2
No.
3
, pp.
146
-
154
.
Crouch
,
G.I.
and
Ritchie
,
J.B.
(
1999
), “
Tourism, competitiveness, and societal prosperity
”,
Journal of Business Research
, Vol.
44
No.
3
, pp.
137
-
152
.
Crouch
,
G.I.
(
2011
), “
Destination competitiveness: an analysis of determinant attributes
”,
Journal of Travel Research
, Vol.
50
No.
1
, pp.
27
-
45
.
Dwyer
,
L.
and
Kim
,
C.
(
2003
), “
Destination competitiveness: determinants and indicators
”,
Current Issues in Tourism
, Vol.
6
No.
5
, pp.
369
-
414
.
Dwyer
,
L.
,
Livaic
,
Z.
and
Mellor
,
R.
(
2003
), “
Competitiveness of Australia as a tourist destination
”,
Journal of Hospitality and Tourism Management
, Vol.
10
No.
1
, pp.
60
-
78
.
Dwyer
,
L.
,
Cvelbar
,
L.K.
,
Edwards
,
D.
and
Mihalič
,
T.
(
2012
), “
Fashioning a destination tourism future: the case of Slovenia
”,
Tourism Management
, Vol.
33
No.
2
, pp.
305
-
316
.
Dwyer
,
L.
,
Cvelbar
,
L.K.
,
Mihalič
,
T.
and
Koman
,
M.
(
2014
), “
Integrated destination competitiveness model: testing its validity and data accessibility
”,
Tourism Analysis
, Vol.
19
No.
1
, pp.
1
-
17
.
Enright
,
M.J.
and
Newton
,
J.
(
2005
), “
Determinants of tourism destination competitiveness in Asia Pacific: comprehensiveness and universality
”,
Journal of Travel Research
, Vol.
43
No.
4
, pp.
339
-
350
.
Fernándeza
,
J.A.S.
,
Azevedob
,
P.S.
,
Martínc
,
J.M.M.
and
Martín
,
J.R.
(
2020
), “
Determinants of tourism destination competitiveness in the countries most visited by international tourists: proposal of a synthetic index
”,
Tourism Management Perspectives
, Vol.
33
, pp.
1
-
13
.
Gooroochurn
,
N.
and
Sugiyarto
,
G.
(
2005
), “
Competitiveness indicators in the travel and tourism industry
”,
Tourism Economics
, Vol.
11
No.
1
, pp.
25
-
43
.
Hanafiah
,
M.H.
and
Zulkifly
,
M.I.
(
2019
), “
Tourism destination competitiveness and tourism performance: a secondary data approach
”,
Competitiveness Review: An International Business Journal
, Vol.
29
No.
5
, pp.
592
-
621
.
Hassan
,
S.S.
(
2000
), “
Determinants of market competitiveness in an environmentally sustainable tourism industry
”,
Journal of Travel Research
, Vol.
38
No.
3
, pp.
239
-
245
.
Lee
,
C.F.
and
King
,
B.
(
2009
), “
A determination of destination competitiveness for Taiwan’s hot springs tourism sector using the Delphi technique
”,
Journal of Vacation Marketing
, Vol.
15
No.
3
, pp.
243
-
257
.
Lehu
,
J.M.
(
2012
), “
L’encyclopédie du marketing: Commenté et illustrée
”,
Editions Eyrolles
.
Leung
,
X.Y.
and
Baloglu
,
S.
(
2013
), “
Tourism competitiveness of asia pacific destinations
”,
Tourism Analysis
, Vol.
18
No.
4
, pp.
371
-
384
.
Li
,
M.
,
Cai
,
L.A.
,
Lehto
,
X.Y.
and
Huang
,
J.
(
2010
), “
A missing link in understanding revisit intention–the role of motivation and image
”,
Journal of Travel and Tourism Marketing
, Vol.
27
No.
4
, pp.
335
-
348
.
Luque
,
M.
,
Pérez-Moreno
,
S.
and
Rodríguez
,
B.
(
2016
), “
Measuring human development: a multi-criteria approach
”,
Social Indicators Research
, Vol.
125
No.
3
, pp.
713
-
733
.
Luque
,
M.
,
Miettinen
,
K.
,
Eskelinen
,
P.
and
Ruiz
,
F.
(
2009
), “
Incorporating preference information in interactive reference point methods for multiobjective optimization
”,
OMEGA – International Journal of Management Science
, Vol.
37
No.
2
, pp.
450
-
462
.
Martins
,
L.F.
,
Gan
,
Y.
and
Ferreira-Lopes
,
A.
(
2017
), “
An empirical analysis of the influence of macroeconomic determinants on world tourism demand
”,
Tourism Management
, Vol.
61
, pp.
248
-
260
.
Namhyun
,
K.
(
2012
), “
Tourism destination competitiveness, globalization, and strategic development from a development economics perspective
”, PhD dissertation Illinois:
University of at Urbana-Champaign
.
Porter
,
M.
(
1985
), “
Technology and competitive advantage
”,
Journal of Business Strategy
, Vol.
5
No.
3
, pp.
60
-
78
.
Porter
,
M.
(
1990
),
The Competitive Advantage of Nations
,
Harvard Business Review, The Free Press
,
New York, NY
.
Posner
,
M.V.
(
1961
), “
International trade and technological change
”,
Oxford Economic Papers
, Vol.
13
No.
3
, pp.
323
-
341
.
Pulido-Fernández
,
J.I.
and
Rodríguez-Díaz
,
B.
(
2016
), “
Reinterpreting the World Economic Forum’s global tourism competitiveness index
”,
Tourism Management Perspectives
, Vol.
20
, pp.
131
-
140
.
Pulido-Fernández
,
J.I.
,
Andrades-Caldito
,
L.
and
Sánchez-Rivero
,
M.
(
2015
), “
Is sustainable tourism an obstacle to the economic performance of the tourism industry? Evidence from an international empirical study
”,
Journal of Sustainable Tourism
, Vol.
23
No.
1
, pp.
47
-
64
.
Song
,
H.
and
Witt
,
S.F.
(
2000
),
Tourism Demand Modelling and Forecasting, Modern Economic Approaches
:
Pergamon
,
Amsterdam
.
Vernon
,
R.
(
1966
), “
International investment and international trade in the product cycle
”,
Quarterly Journal of Economics
, Vol.
80
No.
2
, pp.
190
-
207
.
WEF
(
2019
),
Global Competitiveness Report 2019
.
Botti
,
L.
,
Peypoch
,
N.
,
Robinot
,
E.
and
Solonadrasana
,
B.
(
2009
), “
Tourism destination competitiveness: the French regions case
”,
European Journal of Tourism Research
, Vol.
2
No.
1
, pp.
5
-
24
.
Priestley Commission
(
1955
),
Report of The Royal Commission on The Civil Service
,
1953–55
.
Dias
,
J.G.
(
2017
), “
Environmental sustainability measurement in the travel and tourism competitiveness index: an empirical analysis of its reliability
”,
Ecological Indicators
, Vol.
73
, pp.
589
-
596
.
Dupont
,
L.
(
2007
),
Evaluation De la Compétitivité Touristique Des Destinations Guadeloupe Et Martinique Par Analyse De Leur Productivité Et Efficacité Une Comparaison Inter-Caraïbe
,
The George Washington, DC University
, availabel at: ledupont2@wanadoo.fr
Dwyer
,
L.
,
Mellor
,
R.
,
Livaic
,
Z.
,
Edwards
,
D.
and
Kim
,
C.
(
2004
), “
Attributes of destination competitiveness: a factor analysis
”,
Tourism Analysis
, Vol.
9
No.
1
, pp.
91
-
101
.
Gomezelj
,
D.O.
and
Mihalic
,
T.
(
2008
), “
Destination competitiveness – applying different models, the case of Slovenia
”,
Tourism Management
, Vol.
29
No.
2
, pp.
294
-
307
.
Hall
,
C.M.
(
2007
), “
Tourism and regional competitiveness
”, in
Tribe
,
J.
and
Airey
,
D.
(Eds),
Developments in Tourism Research
,
Elsevier
,
Amsterdam
, pp.
217
-
230
.
Mazanec
,
J.A.
and
Ring
,
A.
(
2011
), “
Tourism destination competitiveness: second thoughts on the World Economic Forum reports
”,
Tourism Economics
, Vol.
17
No.
4
, pp.
725
-
751
.
OCDE
(
2013
), “
Indicateurs de la compétitivité du tourisme: Document d'orientation
”,
Éditions OCDE
,
Organisation Mondiale du Tourisme
(
2016
), “
Faits saillants du tourisme – Édition 2016
”,
UNWTO
,
Madrid
, doi: .
The Phocus wright
(
2011
), “
Destination unknown: how U.S. and European travelers decide where to go 2011
”,
Report
,
Ritchie
,
B.J.R.
and
Crouch
,
G.I.
(
1993
), “
Competitiveness in international tourism—a framework for understanding and analysis
”,
Reports on 43rd Congress
, Vol.
35
, pp.
23
-
71
.
Ritchie
,
J.R.B.
and
Crouch
,
G.I.
(
2000
), “
The competitive destination, a sustainable perspective
”,
Tourism Management
, Vol.
21
, pp.
1
-
7
.
Ritchie
,
J.R.B.
and
Crouch
,
G.I.
(
2002
), “
Country and city state destinations
”,
Tedqual
, Vol.
5
, pp.
13
-
16
.
Ritchie
,
J.R.B.
and
Crouch
,
G.I.
(
2003
),
The Competitive Destination, a Sustainable Tourism Perspective
,
Cabi Publishing
,
Cambridge
.
Ritchie
,
J.R.B.
and
Crouch
,
G.I.
(
2005
),
The Competitive Destination: A Sustainable Tourism Perspective
,
Oxford University Press
,
Oxford
.
Seddighi
,
H.R.
and
Theocharous
,
A.L.
(
2002
), “
A model of tourism destination choice: a theoretical and empirical analysis
”,
Tourism Management
, Vol.
23
No.
5
, pp.
475
-
487
.
Song
,
H.
and
Li
,
G.
(
2008
), “
Tourism demand modelling and forecasting: a review of recent research
”,
Tourism Management
, Vol.
29
No.
2
, pp.
203
-
220
.
Stiger
,
J.H.
(
1980
), “
Test for comparing elements of a correlation
”,
Psychological Bulletin
, Vol.
87
No.
2
, pp.
245
-
251
.
Tabarly
,
S.
(
2011
), “
Évaluer et comparer l'attractivité touristique: des outils Géoconfluences, février
”,
WTTC
(
2014
), “
Economic impact of Travel and Tourism 2014, rapport annuel
”.
  • World Bank

  • CIA World Facts Book

  • Economic Intelligence Unit

  • International Monetary Fund

  • IATA; International Airline Transport Association

  • IUCN and UNEP-WCMC (2011) The World Database on Protected Areas

  • OCDE, Organisation for Economic Co-operation and Development

  • World Tourism Organisation

  • UNEP United Nation Environment Programme

  • WDPA World Data Base on Protected Area

  • World Travel and Tourism Council

Published in Tourism Critiques: Practice and Theory. Published by Emerald Publishing Limited. This article is published under the Creative Commons Attribution (CC BY 4.0) licence. Anyone may reproduce, distribute, translate and create derivative works of this article (for both commercial and non-commercial purposes), subject to full attribution to the original publication and authors. The full terms of this licence may be seen at http://creativecommons.org/licences/by/4.0/legalcode

Data & Figures

Figure 1.

Basic model structure

Figure 1.

Basic model structure

Close modal
Figure 2.

Distribution of the sample by area

Figure 2.

Distribution of the sample by area

Close modal
Table 1.

Coefficient values of the variables

PhaseA1A2A3A4A5B1B2B3
Global0.73250.67450.71900.62750.75850.68800.51750.3575
DEV0.66400.58150.65400.69100.72800.70250.47450.4480
CON0.85800.70000.80950.82650.86050.82800.45650.6895
EXP0.73500.71950.78150.78450.81700.70550.59250.2630
INV0.79300.73850.82450.84200.91300.74550.88050.0800
STA0.58750.59950.70100.72300.69350.65250.46450.2630
 B4C1C2C3D1D2 
Global0.69150.70050.71200.71150.63800.6535 
DEV0.58850.79100.70800.76150.66300.7265 
CON0.72000.92900.78150.83650.72650.6745 
EXP0.71200.82350.83700.83800.65300.7930 
INV0.86550.87100.87100.86750.64650.5475 
STA0.63050.72000.68700.73200.59650.8320 
Source: Authors’ own work
Table 2.

Coefficients of the factors (sub-indices) of competitiveness

Tourist arrivalsTravel and tourism regulatory frameworkInfrastructure contextNatural and cultural resourcesIncentive environment
0–5 million0.090.600.040.16
5–10 million0.270.320.620.26
More than 10 million0.640.080.340.58
Total100100100100
Source: Authors’ own work
Table 3.

Ranking of the ten best and worst destinations by TIC

RankCountryTIC 05CountryICT 07CountryICT 09CountryICT 11CountryICT 13CountryICT 15CountryICT 17CountryICT 19
Ranking of the ten most competitive destination offers
1Israel5.4756Israel5.3371Israel5.3371Israel4.6658Israel4.7092Israel4.3048Korea (Rep)4.2858Korea, Rep)4.0194
2Korea (Rep)4.2072Korea (Rep)4.1899Korea (Rep)4.1273Korea (Rep)4.3192Korea (Rep)4.0632Korea (Rep)4.1741Israel4.1821Ireland3.9490
3Sweden4.1212Thailand4.0255Thailand3.9975Sweden4.2408Denmark3.8980Denmark3.8756Sweden4.0636Sweden3.8750
4Latvia4.0844Sweden4.0229Latvia3.9655Denmark4.1774Colombia3.8219Sweden3.8575Denmark3.8361Denmark3.8649
5Thailand4.0324Latvia3.9693Denmark3.8821Canada4.0813Switzerland3.8154Ireland3.7988Ireland3.8341Switzerland3.8456
6Denmark3.9817Denmark3.9364Canada3.7620Ireland3.9827Sweden3.7909Switzerland3.7744Switzerland3.7195Israel3.7784
7Canada3.7281Canada3.7669Sweden3.7203Spain3.8810Ireland3.7399Canada3.6355Colombia3.6483Latvia3.6939
8Switzerland3.6589Ireland3.6671Ireland3.6559UK3.8771Finland3.6738Finland3.6282Canada3.6207Portugal3.6563
9Ireland3.6529Switzerland3.6431Switzerland3.6425Finland3.8719Canada3.6273Colombia3.5916Portugal3.5764Canada3.6363
10Jordan3.6358UK3.6198UK3.6111France3.8517Spain3.4847Spain3.5149Latvia3.5739Spain3.6345
Ranking of the ten least competitive destination offers
1Malawi0.430606Malawi0.401284Mozambique0.416815Burundi0.451207Guyana0.437745Bosnia-H.0.455413Malawi0.500162Nigeria0.480194
2Zimbabwe0.392344Zimbabwe0.358658Malawi0.403765Arabia S0.410973Albania0.434615Algeria0.453976Algeria0.493279Malawi0.465138
3Burkina F0.383329Burkina F0.347913Zimbabwe0.358597Lesotho0.407133Malawi0.43068Mozambique0.453692Burundi0.464195Bangladesh0.45578
4Paraguay0.374072Paraguay0.327912Burkina F0.347504Zimbabwe0.385204Burkina F0.428223Malawi0.449066Bangladesh0.459544Burundi0.453967
5Kazakhstan0.338943Kazakhstan0.305264Paraguay0.327912Kazakhstan0.3308Mozambique0.422707Bangladesh0.427774Lesotho0.459376Lesotho0.450702
6Arabia S0.140927Arabia S0.140816Arabia S0.07719Montenegro0.316654Bangladesh0.421469Lesotho0.426752Madagascar0.453979Madagascar0.435322
7Oman0.007216Oman0.007262Oman0.007308Oman0.316548Lesotho0.413322Burkina F0.399835Zimbabwe0.403288Algeria0.424317
8Montenegro0.006215Montenegro0.006221Montenegro0.006226Paraguay0.308587Zimbabwe0.385239Zimbabwe0.387016Kazakhstan0.391195Burkina F0.396805
9Ghana0.004755Ghana0.004804Ghana0.004854Senegal0.287634Kazakhstan0.359802Kazakhstan0.367371Burkina F0.377852Paraguay0.374895
10Senegal0.004017Senegal0.003986Senegal0.00397Ghana0.23092Paraguay0.310292Paraguay0.307228Paraguay0.374966Tunisia0.274377
Source: Authors’ own work
Table 4.

Comparative table of WEF and authors’ rankings

20052007200920112013201520172019
RankAuthorsFEMAuthorsFEMAuthorsFEMAuthorsFEMAuthorsFEMAuthorsFEMAuthorsFEMAuthorsFEM
Ranking of the ten most competitive destination offers
1IsraelSwitzerlandIsraelSwitzerlandIsraelSwitzerlandIsraelSwitzerlandIsraelSwitzerlandIsraelSpainKorea (Rep)SpainKorea (Rep)Spain
2Korea (Rep)AustriaKorea (Rep)AustriaKorea (Rep)AustriaKorea (Rep)GermanyKorea (Rep)GermanyKorea (Rep)FranceIsraelFranceIrelandFrance
3SwedenGermanyThailandGermanyThailandGermanySwedenAustriaDenmarkAustriaDenmarkGermanySwedenGermanySwedenGermany
4LatviaIcelandSwedenIcelandLatviaFranceDenmarkFranceColombiaSpainSwedenUSADenmarkJapanDenmarkJapan
5ThailandUSALatviaUSADenmarkCanadaCanadaSuedeSwitzerlandUKIrelandUKIrelandUKSwitzerlandUK
6DenmarkCanadaDenmarkCanadaCanadaSpainIrelandUSASwedenUSASwitzerlandSwitzerlandSwitzerlandUSAIsraelUSA
7CanadaLuxemburgCanadaLuxemburgSwedenSwedenSpainUKIrelandFranceCanadaAustraliaColombiaAustraliaLatviaAustralia
8SwitzerlandUKIrelandUKIrelandUSAUKCanadaFinlandCanadaFinlandItaliaCanadaItaliaPortugalItalia
9IrelandDenmarkSwitzerlandDenmarkSwitzerlandAustraliaFinlandSpainCanadaSuedeColombiaJapanPortugalCanadaCanadaCanada
10GermanyFranceUKFranceUKSlovaquieFranceIcelandSpainAustraliaSpainCanadaLatviaSwitzerlandSpainSwitzerland
Ranking of the ten least competitive destination offers
1MalawiBurundiMalawiGuyanaMozambiqueLesothoBurundiBurundiGuyanaBurundiBosnia-H.Burkina FMalawiBurundiNigeriaBurundi
2ZimbabweLesothoZimbabweBurundiMalawiBurundiArabia SLesothoAlbaniaLesothoAlgeriaBurundiAlgeriaMaliMalawiBurkina F
3Burkina FBangladeshBurkina FLesothoZimbabweNigeriaLesothoMaliMalawiAlgeriaMozambiqueNigeriaBurundiNigeriaBangladeshMali
4ParaguayCameroonParaguayBangladeshBurkina FBangladeshZimbabweBurkina FBurkina FBeninMalawiMozambiqueBangladeshLesothoBurundiNigeria
5KazakhstanEthiopiaKazakhstanMozambiqueParaguayBurkina FKazakhstanNigeriaMozambiqueMadagascarBangladeshLesothoLesothoBeninLesothoCameroon
6Arabia SBeninArabia SCameroonArabia SCameroonMontenegroBangladeshBangladeshMaliLesothoMaliMadagascarCameroonMadagascarMozambique
7OmanNigeriaOmanEthiopiaOmanMozambiqueOmanCameroonLesothoBurkina FBurkina FBangladeshZimbabweBangladeshAlgeriaMalawi
8MontenegroMalawiMontenegroBeninMontenegroEthiopiaParaguayMadagascarZimbabweNigeriaZimbabweMalawiKazakhstanPakistanBurkina FLesotho
9GhanaBurkina FGhanaNigeriaGhanaParaguaySenegalMozambiqueKazakhstanMozambiqueKazakhstanPakistanBurkina FMalawiParaguayBenin
10SenegalMadagascarSenegalMalawiSenegalZimbabweGhanaPakistanParaguayMalawiParaguayAlgeriaParaguayMozambiqueTunisiaEthiopia

Note:

FEM = forum economique mondiale

Source: Authors’ own work
Table 5.

Average growth rates of the TIC ranking destinations

Range20052007200920112013201520172019Means
1–105.397.865.857.53−2.93.884.566.954.83
11–204.617.785.7−0.85−5.693.114.493.112.78
21–303.792.311.223.23−10.983.953.575.751.61
Source: Authors’ own work
Table 6.

Average growth rate of destinations in the TTCI ranking

Rang20052007200920112013201520172019Mean
1–104.085.943.180.56−5.98−1.9120.725.183.97
10–204.086.070.14−3.70−1.836.9212.9310.154.35
20–3013.999.323.406.99−6.182.76−0.646.334.50
Source: Authors’ own work
Table 7.

Comparison of the correlation coefficients of the two indices with international tourism flows

StepNo.Correlations with TTCICorrelations with TIC
Global1070.279**0.750**
DEV430.553**0.663**
CON270.469**0.838**
EXP160.651**0.707**
INV30.590**0.719**
STA180.740**0.524**

Note:

**p < 1%

Source: Authors’ own work
Table A1.

Summary of factor contributions to flow growth

Arrivals (millions)A1A2A3A4A5B1B2B3B4C1C2C3D1D2
DEV0–50.5030.5980.8930.7310.8040.6700.2980.7810.5600.6190.6030.5090.811−0.111
5–100.4170.7430.410.7560.7340.8060.1910.5510.6230.6500.6680.1990.661−0.771
>100.3100.3340.4040.8420.3270.7610.4670.8370.7810.1880.8520.3440.6330.030
EXP0–50.6400.6100.8820.4700.6710.7680.0380.7030.5430.6700.4210.5360.8280.197
5–100.2590.1270.259A0.1110.039−0.612−0.0370.6310.541−0.036−0.334A0.259
>10−0.7030.050−0.8480.865−0.8650.8480.0250.6610.8950.9150.898−0.134−0.3670.610
CON0–50.4860.8150.7100.7190.8700.9000.2410.6840.5870.8150.6120.2950.922−0.128
5–10−0.0300.6750.7050.7580.5330.922−0.1410.7420.9410.4390.8450.1710.924−0.701
>100.7980.6560.8580.8400.5220.8110.3440.8040.6860.1980.7920.6170.785−0.307
STA0–50.5970.6120.6840.7620.7850.6540.2440.7740.8380.3770.8920.6980.871−0.150
5–100.1420.6800.5790.7730.7730.8860.6140.8910.9250.8310.8980.3140.821−0.556
>100.1990.4740.4470.7050.5280.6210.6760.4610.9260.4810.8760.4220.6570.028
INV0.7160.8180.9640.8830.950.9010.8660.8680.4180.9110.90.5480.936−0.869
ASS0.6560.4780.5820.5400.4950.4390.5180.5350.3860.5600.5650.5180.6770.565
Source: Authors’ own work
Table A2.

Ranking of destinations by TIC

2005200720092011
CountryICTRANKRATEMeanCountryTICRANKRATEMeanCountryTICRANKRATEMeanCountryTICRANKRATEMean
Israel1.825199116.9 Israel1.7790391−5.3 Israel1.77903914.4 Israel1.555264114.5 
Korea (Rep)1.402395210.5 Korea (Rep)1.3966352−4.2 Korea (Rep)1.37576123.9 Korea (Rep)1.439749266.8 
Sweden1.37372238.2 Thailand1.341842322.6 Thailand1.332502312 Sweden1.4136013−1 
Latvia1.361466423.6 Sweden1.34096417.7 Latvia1.32183947.5 Denmark1.3924794−4.2 
Thailand1.3441275−11.2 Latvia1.3231524.2 Denmark1.2940215−2.8 Canada1.3604245−4.6 
Denmark1.3272386−7.5 Denmark1.31213162.9 Canada1.2540076−3.4 Ireland1.32756963.4 
Canada1.24277−5.9 Canada1.2556427−4.7 Sweden1.240103716.7 Spain1.2936727−1.4 
Switzerland1.21962684.5 Ireland1.22236888.3 Ireland1.218634810.2 UK1.29235181.1 
Ireland1.2176398.3 Switzerland1.21437396 Switzerland1.21416397.1 Finland1.29064992.8 
Jordan1.211948106.55.39UK1.20659106.17.36UK1.203711102.95.85France1.28390810−2.17.53
Serbia1.1913451113.6 Finland1.1831971113 Finland1.195757118.9 Portugal1.277888110 
UK1.191202124.1 Jordan1.173663127.3 Malaysia1.1729461210.8 Thailand1.277615127.3 
Finland1.187799132.4 Malaysia1.169769139.7 Jordan1.172129139.5 R. Czech1.2668513−5.5 
Malaysia1.172259147.6 Spain1.15372143.1 France1.155095144.5 Switzerland1.257063144.8 
Cyprus1.16464915−0.3 Serbia1.1530311510.2 Serbia1.1520451517.1 Greece1.2451415−3.8 
Spain1.144611161.9 Portugal1.1505381611.9 Spain1.150686160.2 Latvia1.239578166.6 
Portugal1.1408617−0.7 France1.150329172.1 Portugal1.150411174.7 Germany1.226435171.5 
Austria1.14005184.9 Austria1.13650618−0.6 Germany1.14111418−1.7 Malaysia1.21528918−9.4 
Germany1.1384171913.5 Germany1.1353171912.5 Austria1.136325190.2 Colombia1.1850919−2.7 
Iceland1.13519420−0.94.61R. Czech1.133699208.67.78Cyprus1.133744202.85.7Cyprus1.17143220−7.3−0.85
France1.12940421−2.3 Cyprus1.13154821−2.7 R. Czech1.127065210.4 USA1.1653712112.4 
R. Czech1.127743229.5 USA1.112105221.5 USA1.119191228.9 Austria1.147849225.6 
USA1.115161236.7 Iceland1.1083262312.9 Iceland1.113296234.8 Bulgaria1.11713423−0.1 
Greece1.096494246.8 Greece1.102767244.1 Greece1.101663244 Belgium1.10539224−3.3 
Norway1.083702250 Belgium1.062526253.3 Luxemburg1.071728250 Croatia1.101947255.5 
N. Zealand1.07015226−2.4 Norway1.05234726−3.3 Belgium1.071226−3.9 Jordan1.082141268 
Luxemburg1.061261270 Luxemburg1.050686270 N. Zealand1.05963927−2.3 Poland1.0775427−7.1 
Belgium1.058895285 N. Zealand1.048082282.3 Norway1.053139286.4 Norway1.07607528−0.5 
Slovakia1.037162915 Australia1.03549629−0.8 Australia1.03779329−11.5 Iceland1.072597297.5 
Australia1.03656230−0.43.79Tunisia1.029916305.82.31Tunisia1.029881305.41.22Tunisia1.065935304.33.23
Tunisia1.0349923115.8 Croatia1.018006312.5 Croatia1.018107312.1 South A.1.06150131−2.9 
Croatia1.022629324.7 Slovakia1.0020453225 Slovakia1.0017943229.2 Luxemburg1.052831320 
Japan0.9907543311.4 Japan0.98753433−22.1 Japan0.989146338.5 Australia1.04346233−10.2 
The Netherlands0.95442334−2.7 The Netherlands0.951972342.5 The Netherlands0.952787342.2 Egypt1.035381340.9 
Morocco0.9453833517.9 Bulgaria0.948655350.3 Morocco0.948647357.9 Morocco1.01211435−4.3 
Bulgaria0.938842362.1 Morocco0.9412983624.4 Bulgaria0.936777365.2 Ukraine1.004303362.9 
Colombia0.91339637−3.8 South A.0.915375376.7 Egypt0.9260473711.1 Slovakia1.0008513714.8 
Ecuador0.90954338−1.7 Egypt0.897601384.4 South A.0.905303387.1 The Netherlands0.99661938−5.8 
Egypt0.902525390.4 Poland0.888533397.5 Poland0.8835753923.7 Japan0.98734839−0.2 
South A.0.902208406.8 Ecuador0.87125640−6.4 Ecuador0.870884018.9 N. Zealand0.98495140−3.5 
Philippines0.896274417.3 Colombia0.8670864122.7 Colombia0.86702541−5.6 Turkey0.968735417.5 
Nicaragua0.891248422.7 Philippines0.8584714229.7 Turkey0.86015742−4.4 China0.95456942−9.3 
Chile0.88911843−7 Chile0.85775143−4.6 Chile0.858475439.7 Ecuador0.901924437.1 
Poland0.88146144−5.1 Turkey0.85565644−7.4 Philippines0.8584674420.1 Serbia0.89639144−4.9 
Turkey0.857864452.1 Nicaragua0.849167459 Nicaragua0.844526455.9 Costa Rica0.881524453.2 
Costa Rica0.857014613 Costa Rica0.82573746−0.5 Costa Rica0.8262614610.2 Russia0.87269464.2 
Zambia0.84592447−5.9 China0.808486479.6 Indonesia0.820686476.7 Qatar0.87101847−23.6 
Qatar0.8364724835.3 Zambia0.80767848−22 China0.81722648−1.5 Philippines0.86612348−50.9 
Lithuania0.835831499.5 Qatar0.8051134915.2 Zambia0.806894919.2 Romania0.853058499.6 
Indonesia0.82374950−7.4 Lithuania0.80444502.4 Qatar0.80555950−24 Chile0.8492645011.6 
China0.810657519.6 Ukraine0.78159151−2.8 Lithuania0.80514151−7 Uruguay0.840116516.4 
Argentina0.7951525210.4 Argentina0.7637795212.6 Ukraine0.776886527.8 Venezuela0.83977452−13 
Ukraine0.77986353−3.6 Italia0.757024535.7 Argentina0.7642645313.7 Argentina0.83117253−9 
Venezuela0.7750675410.6 Mexico0.74396154−2.3 Italia0.75696654−0.2 Lithuania0.81782154−6.7 
Hungary0.7650945513.4 Venezuela0.737101551.3 Mexico0.744134550.2 Zambia0.80946255−9.7 
Italia0.76044456−1.4 Hungary0.731507565.2 Venezuela0.73464456−0.3 Italia0.79426856−3.9 
Mexico0.74715571.7 Brazil0.7264757−7.5 Hungary0.73154657−6.7 Nicaragua0.782983577.9 
Romania0.7441515872.7 Russia0.721604584.2 Russia0.727579588 Mexico0.768474580.2 
Uruguay0.74346590.2 Uruguay0.70821259−6.1 Brazil0.72683559−2.4 Honduras0.767885595.4 
Slovénie0.736002607.6 Roumania0.7072716010.1 Uruguay0.7077766016.2 Kenya0.76672160−16.2 
Brazil0.73114761−4.5 Slovénie0.70233561−3.6 Romania0.70671761−4.7 Brazil0.763413610.5 
Russia0.72504962−11.5 Jamaica0.6900336213.8 Slovénie0.7022946213.5 Indonesia0.7583776225.7 
Jamaica0.71966963−6 Namibia0.6816366310.9 Jamaica0.69192763−3.3 Pakistan0.750625639.6 
Namibia0.712947648.1 Botswana0.6620846419.3 India0.690444648.7 Slovénie0.745059647.7 
Botswana0.693463650.6 Panama0.657996525.9 Namibia0.681832657.9 Jamaica0.73938865−4.7 
Panama0.6916046620.5 Kuwait0.651081665.9 Botswana0.662408666.6 Peru0.7392536610.3 
Nepal0.68441367−43.7 Guatemala0.649157679.7 Panama0.6580026723 Namibia0.73858567−7.5 
Kuwait0.68208668−14.3 Nepal0.64614768−7.2 Kuwait0.65233768−1.1 Hungary0.7370216812.9 
Guatemala0.6784426914.2 India0.619876913 Guatemala0.651887695.7 Guatemala0.73373769−10.4 
Mali0.656024700.9 Mali0.6178227010.6 Nepal0.6462817026.6 Botswana0.7191970−12.2 
India0.6534977113.4 Peru0.6151957114.7 Mali0.6170087116.1 Panama0.7030937115.8 
Peru0.6483729.1 Mongolia0.608981722.2 Peru0.614222725.6 Kuwait0.69415172−6.4 
Mongolia0.64715173−17 Benin0.58267738.5 Mongolia0.6083857320.6 India0.686667737 
Benin0.62092474−14.9 Pakistan0.565374741.5 Kazakhstan0.60657746.7 Madagascar0.653759742.4 
Pakistan0.601481754.5 Kenya0.556251757.8 Benin0.5820157552 Nepal0.6480487550 
Kenya0.5913677610.4 Honduras0.546558765.6 Pakistan0.564676−6.5 Vietnam0.62772876−6.4 
Honduras0.582591776.9 Algeria0.54579777−28.1 Kenya0.5553727713.2 Azerbaijan0.62319577−14.7 
Algeria0.5771278−6.8 Georgia0.5272417814.2 Algeria0.5467178−25.3 Bolivia0.62134978−22.6 
Georgia0.5586387920.5 Indonesia0.51950679−20.6 Honduras0.54575779−0.6 Uganda0.61087917.6 
Azerbaijan0.544769803.8 Azerbaijan0.5133878078.2 Georgia0.527318804.5 Mongolia0.60895580−37.1 
Armenia0.543878817.5 Armenia0.5124638110.8 Azerbaijan0.5139678128.8 Benin0.60537181−0.4 
Cambodge0.5259638232.4 Viet Nam0.4927648260 Armenia0.51291382−12.3 Georgia0.6041682−6.3 
Vietnam0.524114832.9 Cambodge0.4910668311.4 Vietnam0.49326983−0.1 Mali0.603057837.7 
Uganda0.5193438438.8 Uganda0.48795784−15.9 Cambodge0.4885698410.3 Gambia0.59412484−21.2 
Ethiopia0.510343856.3 Ethiopia0.478949857.7 Uganda0.488153854.3 Algeria0.5905278516.6 
Cameroon0.505382865.1 Madagascar0.4686838627.7 Ethiopia0.479675868.8 Cambodge0.58995386−3 
Madagascar0.504297879.9 Bolivia0.46781287−16.2 Bolivia0.46869387−9.8 Burkina F0.583328716.1 
Bolivia0.4991668816.8 Cameroon0.46716888−3.4 Madagascar0.467906884.6 Ethiopia0.5822768823 
Gambia0.494356899.3 Gambia0.4630378915.2 Cameroon0.46659989−0.5 Armenia0.57045789−7.4 
Lesotho0.48407490−2.5 Lesotho0.445739907.3 Gambia0.463397906.5 Bosnia-H.0.55512190−0.6 
Bosnie-H0.469191914.8 Bosnie-H0.4377829110.5 Lesotho0.44515991−0.4 Guyana0.55099918.2 
Guyana0.4616359219.5 Guyana0.430221922.6 Bosnie-H0.438581925.8 Nigeria0.54871192140.7 
Burundi0.45925193−5.4 Albania0.4236189314.8 Guyana0.4308029324.2 Cameroon0.54209893−41.1 
Albania0.4549169410.3 Burundi0.42085194−15.6 Albania0.4238279424.4 Mozambique0.535628940.8 
Bangladesh0.449965957 Bangladesh0.418624950.9 Burundi0.42042795−2.8 Albania0.5348499511 
Nigeria0.44964296137.9 Nigeria0.4183219622.5 Bangladesh0.41956796−8.9 Malawi0.52927296−3 
Mozambique0.4482549734.7 Mozambique0.416629975.6 Nigeria0.4191989749.8 Bangladesh0.51828897−12.4 
Malawi0.4306069814.5 Malawi0.40128498−5.7 Mozambique0.4168159820 Burundi0.45120798−11.7 
Zimbabwe0.39234499−32.8 Zimbabwe0.3586589913.9 Malawi0.40376599−12.8 Arabia S0.41097399−10 
Burkina F0.383329100−13.8 Burkina F0.34791310020.9 Zimbabwe0.358597100−9.6 Lesotho0.407133100−0.1 
Paraguay0.3740721015.9 Paraguay0.327912101−1.8 Burkina F0.347504101−0.3 Zimbabwe0.38520410111.4 
Kazakhstan0.338943102−16.7 Kazakhstan0.305264102−5.2 Paraguay0.327912102−12.5 Kazakhstan0.3308102−18.5 
Arabia S0.140927103−28 Arabia S0.140816103−7.2 Arabia S0.0771910322.9 Montenegro0.3166541031.3 
Oman0.007216104−13.3 Oman0.0072621045.8 Oman0.00730810413.3 Oman0.316548104−4.7 
Montenegro0.00621510524.5 Montenegro0.00622110511.1 Montenegro0.00622610541.8 Paraguay0.308587105−18.5 
Ghana0.00475510653.6 Ghana0.004804106−5.9 Ghana0.004854106−4.7 Senegal0.287634106−10.5 
Senegal0.00401710713.9 Senegal0.003986107−6.2 Senegal0.0039710764.8 Ghana0.23092107−7.8 
Table A3.

Ranking of destinations by TIC (follow)

2013201520172019
CountryICTRANKRATET moyCountryICTRANKRATET moyCountryICTRANKRATET moyCountryICTRANKRATET moyMoy Moy
Israel1.5697191−10 Israel1.43494120.4 Korea (Rep)1.428611112.7 Korea (Rep)1.339791121.4  
Korea (Rep)1.354396210.9 Korea (Rep)1.39136625.4 Israel1.3940462−5.1 Ireland1.31634225.9  
Denmark1.2993193−6.9 Denmark1.29187331.9 Sweden1.35452339.3 Sweden1.291674312.2  
Colombia1.273958413.3 Sweden1.28583542.5 Denmark1.27871242.7 Denmark1.28830840.8  
Switzerland1.2717845−4.4 Ireland1.26625553.5 Ireland1.278022513.4 Switzerland1.2818555−0.2  
Sweden1.26362268.5 Switzerland1.25814962.1 Switzerland1.23983860.2 Israel1.259465613.7  
Ireland1.2466447−6.7 Canada1.21181872.1 Colombia1.21610370.3 Latvia1.23130672.3  
Finland1.22468−12.2 Finland1.20940289.1 Canada1.20690282 Portugal1.21876586.8  
Canada1.2091059−10.6 Colombia1.1971959−11 Portugal1.19212198.6 Canada1.21211294.6  
Spain1.16155910−10.9−2.9Spain1.171622102.83.88Latvia1.191297101.54.56Spain1.2114921026.954.8275
R. Czech1.15366711−2.3 Latvia1.17034111.7 France1.1803771112.1 UK1.201448111.7  
Latvia1.1515712−5 France1.16490812−1.7 UK1.172684127.3 Austria1.190823121.2  
France1.14677413−9.8 Portugal1.143988139.4 Spain1.164917137.9 Belgium1.175722132.3  
Austria1.13767314−9.9 UK1.139436140.8 Thailand1.1644511418 France1.174447142.6  
Portugal1.13607515−8.3 R. Czech1.132963152.2 Germany1.13728152.2 Thailand1.158428158.6  
Belgium1.13418316−8.5 Germany1.132115166.8 Austria1.12141516−0.7 Australia1.154861160.6  
Malaysia1.13161174.5 Austria1.125165171.4 R. Czech1.103726170.3 Germany1.150222173.8  
The Netherlands1.13132318−8.8 Thailand1.111326187 Malaysia1.06885118−11.6 The Netherlands1.143694186.1  
Germany1.13086719−7.2 Malaysia1.1026919−0.2 Belgium1.062779192.4 R. Czech1.130434196.5  
UK1.1096920−1.6−5.69Belgium1.096095203.73.11Cyprus1.0450782074.49Colombia1.12176520−2.33.112.7825
Greece1.09016921−23 Tunisia1.057795210.4 Australia1.04488421−6.6 Japan1.1118422131.6  
Tunisia1.08957822−3.1 Greece1.049415229.4 USA1.0337762210.9 Malaysia1.09373226.9  
Thailand1.07425723−10.2 Cyprus1.04387923−1 Luxemburg1.031927230 USA1.067952237.5  
Cyprus1.03215924−19.2 USA1.018502249.7 Iceland1.0254492416.6 Cyprus1.056999244.5  
Australia1.030284253.7 The Netherlands1.008695258.3 Finland1.0119662513.7 Hungary1.03765325−2.7  
Croatia1.01724326−17.1 Croatia0.9932452611.2 Norway1.00826526−2.5 N. Zealand1.0353426−1.6  
USA1.01276927−15.6 Luxemburg0.983725270 Slovakia1.001097270.8 Finland1.03049927−0.7  
Jordan0.98632128−4.1 Bulgaria0.97993128−3.3 The Netherlands0.994312286.1 Slovakia1.018907281.1  
Norway0.97779629−10.5 Australia0.978862293.6 Greece0.99126129−5.1 Iceland1.018622910.9  
Egypt0.97473630−10.7−10.98Norway0.978499301.23.95Bulgaria0.982869301.83.57Luxemburg1.0117593005.751.605
Bulgaria0.97416631−11.8 Iceland0.9746231−5.9 Arabia S0.97405931−0.3 Ecuador1.006047315.5  
Japan0.97356132−17.3 Jordan0.9659583217 Croatia0.968516320 Bulgaria1.000446320.3  
Iceland0.9450223311.3 Japan0.9434013317.2 Romania0.96709633−5.3 Arabia S0.99880433−2.2  
Luxemburg0.943908340 Egypt0.937443346.8 Ecuador0.95471534−1.2 Greece0.996686346.9  
N. Zealand0.90436935−2.5 N. Zealand0.91275935−13 Jordan0.95419135−15.7 Norway0.99658352.2  
South A.0.88864936−10.5 Ecuador0.91003368.3 Poland0.9469453610.8 Jordan0.9888053612  
Morocco0.88433837−8 Arabia S0.903411370 N. Zealand0.926218370 Poland0.987173710.1  
Ecuador0.88112238−5.3 Poland0.90204738−4 Japan0.92534238−24.6 Mexico0.970014386.9  
China0.87234539−4.4 Argentina0.8955223914.2 Argentina0.91465239−3.1 Croatia0.954635397.8  
Poland0.86451540−4.5 South A.0.88792240−3.7 China0.91189940−5.8 Italia0.95246540−0.1  
Brazil0.86287641−6.1 China0.887335419.2 Hungary0.891415412.3 Romania0.9406964119.2  
Kuwait0.8410284234.5 Morocco0.881566426.2 South A.0.88406942−2.8 Slovénie0.92175442−0.6  
Arabia S0.8403684317.1 Turkey0.84203343−7.4 Morocco0.880343435.7 Brazil0.9187314317.1  
Turkey0.8373314411.1 Kuwait0.83401444−28.9 Costa Rica0.869544−0.2 Argentina0.91545944−3.8  
Italia0.83307245−11.1 Slovakia0.83178345−5.3 Turkey0.8506934517.7 Morocco0.91189945−2.8  
Zambia0.82940946−8 Costa Rica0.81976946−7.7 Nicaragua0.8485574618.7 China0.90819446−3.8  
Philippines0.81742347−1.8 Qatar0.8091174732.6 Qatar0.84821147102.3 South A.0.8981054713.6  
R.slovaque0.80734648−11.1 Philippines0.805873482.7 Egypt0.84229148−27.5 Egypt0.892796481.8  
Costa Rica0.80458449−21.4 Slovénie0.803706496.3 Slovénie0.825557490.4 Philippines0.8805564910.6  
Qatar0.79007350−24 Zambia0.7989865013.1 Montenegro0.8244325011.3 Panama0.879262506.7  
Slovénie0.78793451−5.4 Nicaragua0.79163951−9.2 Vietnam0.817895126.6 Turkey0.87021451−0.3  
Mexico0.78793152−0.6 Viet Nam0.784626524 Philippines0.809482528.4 Indonesia0.863281529.2  
Ukraine0.7817253−15.8 Italia0.78224853−0.1 Serbia0.800041532.1 Nicaragua0.849981535.1  
Russia0.74971554−3.4 Russia0.76654−8.8 Russia0.797009547.3 Costa Rica0.846201546.5  
Nicaragua0.7496485512.2 Serbia0.763952553.6 Zambia0.7883895516 Qatar0.8453155536.6  
Hungary0.738815567.5 Brazil0.75920256−10.7 Peru0.786855610.5 Vietnam0.828125611.5  
Serbia0.738223571.7 Mexico0.75819357−9.3 Oman0.783065578.6 Serbia0.809159570.6  
Argentina0.71733158−9.4 Ukraine0.75386558−4 Mexico0.77458158−10 Montenegro0.8038565812.8  
Panama0.715407592.4 Hungary0.74823859−6 Italia0.774396596.3 Russia0.7972775913.8  
Chile0.71178460−4.4 Chile0.72988760−12.5 Chile0.772387603.2 Lithuania0.78495601.9  
Indonesia0.70449161−26.4 Lithuania0.722446611.8 Lithuania0.7539746116.5 Ukraine0.779153617.4  
Lithuania0.70389462−9.3 Panama0.718971628.5 Brazil0.749223621.4 Oman0.777581625.9  
Roumania0.68874363−25.8 Oman0.71799763−3 Namibia0.733253637.6 Zambia0.77696763−10.4  
Venezuela0.6850464−11.7 Montenegro0.717633643 Ukraine0.73204640 Chile0.767496414.4  
Oman0.6746246532.2 Roumania0.706852651.6 Panama0.728424658.4 India0.7569666510.3  
Nepal0.6685596619.3 Peru0.698617660.7 Uruguay0.7049746628.3 Peru0.752785665.2  
India0.66716567−1.5 Indonesia0.690671671.3 Tunisia0.70081467−36.3 Kenya0.71630967−6.2  
Kenya0.6647868−17.6 Venezuela0.67827683.5 Benin0.6951366818.9 Namibia0.7060946810  
Honduras0.65475269−4.7 Uruguay0.67357769−4.1 Jamaica0.69501869−4.6 Jamaica0.705258694  
Montenegro0.648511701.4 Namibia0.673364709.3 Guatemala0.69122170−10.3 Cameroon0.702141708.8  
Peru0.647654713.3 Kenya0.6733477137 Indonesia0.689561715.3 Uruguay0.69438371−1.3  
Uruguay0.643467223.7 Honduras0.668239720.1 Nepal0.684729720.3 Nepal0.685074729.6  
Jamaica0.640628731.5 Nepal0.66594373−29.4 Honduras0.68211573−1 Mongolia0.67813473−0.9  
Namibia0.63651474−9.9 Jamaica0.66130974−8.9 Kenya0.678927417.2 Honduras0.6751957411.7  
Guatemala0.6351477515 Benin0.6558527516.9 Venezuela0.67163175−16.1 Venezuela0.6520517523.4  
Benin0.63471576−42.3 Guatemala0.646045769.8 Botswana0.66839776−1.1 Benin0.6341337610.5  
Mongolia0.6225367712.2 Botswana0.62790277−8.9 Cameroon0.66391771.8 Botswana0.631672774.6  
Botswana0.618105780 Cameroon0.62365678−35 Mongolia0.64111678−23.6 Guatemala0.61456878−2.9  
Senegal0.60974879−20.5 Mongolia0.62035579−10 Senegal0.6047737917.2 Senegal0.59952795.3  
Cameroon0.6040058063.4 India0.61318010.3 Kuwait0.60186180−13.9 Mali0.593952805.1  
Mali0.59082881−37.4 Senegal0.60634811.3 Azerbaijan0.5921928161.7 Georgia0.581802813.8  
Vietnam0.56188682−14.3 Mali0.5576768210.8 Bolivia0.5918898226.8 Azerbaijan0.5785428256.3  
Pakistan0.53856983−8.3 Azerbaijan0.5511978326 Albania0.58100983−3.9 Bolivia0.575685837.4  
Uganda0.5384278438.1 Gambia0.54194684−41.3 Gambia0.58090384173.2 Kuwait0.574733846.7  
Azerbaijan0.5335648566.2 Bolivia0.540743851.6 Georgia0.5738088524 Albania0.571066854.1  
Burundi0.53021486−6.6 Pakistan0.52733186−2.8 Ethiopia0.5693738628.3 Gambia0.56588866.3  
Bolivia0.529747870.7 Uganda0.5221298719.9 India0.565578716 Kazakhstan0.5360598715.3  
Gambia0.52567688−11.1 Georgia0.5211548834.9 Ghana0.560814880 Armenia0.529605887.6  
Georgia0.4965568921.9 Ethiopia0.5105638954.4 Guyana0.56076889−14 Ethiopia0.526526890.6  
Madagascar0.49289890−11.8 Ghana0.50933390−27.5 Mali0.5458219022 Zimbabwe0.518954906.3  
Ghana0.49231910.2 Albania0.49063191−7.2 Uganda0.5421429118.9 Ghana0.5188529114.3  
Ethiopia0.48709592−6.6 Cambodge0.487082925.6 Armenia0.528681921.1 Pakistan0.51730592−9  
Cambodge0.4828993−6.5 Burundi0.486129930.5 Cambodge0.5257879324 Uganda0.5131993−3.2  
Algeria0.450828942.8 Guyana0.48126294101.3 Pakistan0.52383494−5.5 Cambodge0.503892943.5  
Nigeria0.443818958.3 Madagascar0.4727449520.2 Mozambique0.52337995−4.3 Guyana0.501378952.3  
Armenia0.4407929615 Armenia0.4674369616.2 Bosnia-H.0.51442696−1.5 Bosnia-H.0.499973961.7  
Bosnia-H.0.43879297−13.4 Nigeria0.45778297−13.3 Nigeria0.5123297−13.1 Mozambique0.480614975.1  
Guyana0.43774598−38.9 Bosnia-H.0.45541398−9.4 Malawi0.50016298−4.4 Nigeria0.480194981.3  
Albania0.4346159920.9 Algeria0.45397699−26.9 Algeria0.4932799915.4 Malawi0.465138996.4  
Malawi0.43068100−5.8 Mozambique0.45369210019 Burundi0.464195100142 Bangladesh0.4557810013.4  
Burkina F0.42822310125.5 Malawi0.449066101−2.7 Bangladesh0.459544101−5.3 Burundi0.453967101−3.1  
Mozambique0.42270710210.4 Bangladesh0.42777410231.4 Lesotho0.459376102−14.2 Lesotho0.450702102−2.3  
Bangladesh0.421469103−12.5 Lesotho0.426752103−6 Madagascar0.453979103−1.2 Madagascar0.43532210311.5  
Lesotho0.413322104−4.1 Burkina F0.3998351048.9 Zimbabwe0.403288104−1.4 Algeria0.4243171045.6  
Zimbabwe0.385239105−0.2 Zimbabwe0.387016105−9.5 Kazakhstan0.3911951052.3 Burkina F0.396805105−1.6  
Kazakhstan0.35980210616 Kazakhstan0.367371106−11.7 Burkina F0.3778521061.7 Paraguay0.3748951066.5  
Paraguay0.31029210710.5 Paraguay0.307228107−3.2 Paraguay0.374966107−7.3 Tunisia0.27437710722.9  
Source: Authors’ own work

Supplements

References

Bahar
,
O.
and
Kozak
,
M.
(
2007
), “
Advancing destination competitiveness research: comparison between tourists and service providers
”,
Journal of Travel and Tourism Marketing
, Vol.
22
No.
2
, pp.
61
-
71
.
Butler
,
R.W.
(
1980
), “
The concept of a tourist area cycle of evolution: implications for management of resources
”,
The Canadian Geographer/Le Géographe Canadien
, Vol.
24
No.
1
.
Caber
,
M.
,
Albayrak
,
T.
and
Matzler
,
K.
(
2012
), “
Classification of the destination attributes in the content of competitiveness
”,
Journal of Vacation Marketing
, Vol.
18
No.
1
, pp.
43
-
56
.
Cho
,
D.
and
Moon
,
H.
(
2013
),
D'Adam Smith à Michael Porter: évolution De Théorie De la Compétitivité
,
World Scientific Publishing Co. Pte. Ltd
,
Singapour
.
Cracolici
,
M.F.
,
Nijkamp
,
P.
and
Rietveld
,
P.
(
2008
), “
Assessment of tourism competitiveness by analysing destination efficiency
”,
Tourism Economics
, Vol.
14
No.
2
, pp.
325
-
342
.
Craigwell
,
R.
and
Worrell
,
D.
(
2008
), “
The competitiveness of selected Caribbean tourism markets
”,
Social and Economic Studies
, Vol.
57
No.
1
, pp.
72
-
107
.
Croes
,
R.
(
2011
), “
Measuring and explaining competitiveness in the context of small island destinations
”,
Journal of Travel Research
, Vol.
50
No.
4
, pp.
431
-
442
.
Croes
,
R.
and
Kubickova
,
M.
(
2013
), “
From potential to ability to compete: towards a performance-based tourism competitiveness index
”,
Journal of Destination Marketing and Management
, Vol.
2
No.
3
, pp.
146
-
154
.
Crouch
,
G.I.
and
Ritchie
,
J.B.
(
1999
), “
Tourism, competitiveness, and societal prosperity
”,
Journal of Business Research
, Vol.
44
No.
3
, pp.
137
-
152
.
Crouch
,
G.I.
(
2011
), “
Destination competitiveness: an analysis of determinant attributes
”,
Journal of Travel Research
, Vol.
50
No.
1
, pp.
27
-
45
.
Dwyer
,
L.
and
Kim
,
C.
(
2003
), “
Destination competitiveness: determinants and indicators
”,
Current Issues in Tourism
, Vol.
6
No.
5
, pp.
369
-
414
.
Dwyer
,
L.
,
Livaic
,
Z.
and
Mellor
,
R.
(
2003
), “
Competitiveness of Australia as a tourist destination
”,
Journal of Hospitality and Tourism Management
, Vol.
10
No.
1
, pp.
60
-
78
.
Dwyer
,
L.
,
Cvelbar
,
L.K.
,
Edwards
,
D.
and
Mihalič
,
T.
(
2012
), “
Fashioning a destination tourism future: the case of Slovenia
”,
Tourism Management
, Vol.
33
No.
2
, pp.
305
-
316
.
Dwyer
,
L.
,
Cvelbar
,
L.K.
,
Mihalič
,
T.
and
Koman
,
M.
(
2014
), “
Integrated destination competitiveness model: testing its validity and data accessibility
”,
Tourism Analysis
, Vol.
19
No.
1
, pp.
1
-
17
.
Enright
,
M.J.
and
Newton
,
J.
(
2005
), “
Determinants of tourism destination competitiveness in Asia Pacific: comprehensiveness and universality
”,
Journal of Travel Research
, Vol.
43
No.
4
, pp.
339
-
350
.
Fernándeza
,
J.A.S.
,
Azevedob
,
P.S.
,
Martínc
,
J.M.M.
and
Martín
,
J.R.
(
2020
), “
Determinants of tourism destination competitiveness in the countries most visited by international tourists: proposal of a synthetic index
”,
Tourism Management Perspectives
, Vol.
33
, pp.
1
-
13
.
Gooroochurn
,
N.
and
Sugiyarto
,
G.
(
2005
), “
Competitiveness indicators in the travel and tourism industry
”,
Tourism Economics
, Vol.
11
No.
1
, pp.
25
-
43
.
Hanafiah
,
M.H.
and
Zulkifly
,
M.I.
(
2019
), “
Tourism destination competitiveness and tourism performance: a secondary data approach
”,
Competitiveness Review: An International Business Journal
, Vol.
29
No.
5
, pp.
592
-
621
.
Hassan
,
S.S.
(
2000
), “
Determinants of market competitiveness in an environmentally sustainable tourism industry
”,
Journal of Travel Research
, Vol.
38
No.
3
, pp.
239
-
245
.
Lee
,
C.F.
and
King
,
B.
(
2009
), “
A determination of destination competitiveness for Taiwan’s hot springs tourism sector using the Delphi technique
”,
Journal of Vacation Marketing
, Vol.
15
No.
3
, pp.
243
-
257
.
Lehu
,
J.M.
(
2012
), “
L’encyclopédie du marketing: Commenté et illustrée
”,
Editions Eyrolles
.
Leung
,
X.Y.
and
Baloglu
,
S.
(
2013
), “
Tourism competitiveness of asia pacific destinations
”,
Tourism Analysis
, Vol.
18
No.
4
, pp.
371
-
384
.
Li
,
M.
,
Cai
,
L.A.
,
Lehto
,
X.Y.
and
Huang
,
J.
(
2010
), “
A missing link in understanding revisit intention–the role of motivation and image
”,
Journal of Travel and Tourism Marketing
, Vol.
27
No.
4
, pp.
335
-
348
.
Luque
,
M.
,
Pérez-Moreno
,
S.
and
Rodríguez
,
B.
(
2016
), “
Measuring human development: a multi-criteria approach
”,
Social Indicators Research
, Vol.
125
No.
3
, pp.
713
-
733
.
Luque
,
M.
,
Miettinen
,
K.
,
Eskelinen
,
P.
and
Ruiz
,
F.
(
2009
), “
Incorporating preference information in interactive reference point methods for multiobjective optimization
”,
OMEGA – International Journal of Management Science
, Vol.
37
No.
2
, pp.
450
-
462
.
Martins
,
L.F.
,
Gan
,
Y.
and
Ferreira-Lopes
,
A.
(
2017
), “
An empirical analysis of the influence of macroeconomic determinants on world tourism demand
”,
Tourism Management
, Vol.
61
, pp.
248
-
260
.
Namhyun
,
K.
(
2012
), “
Tourism destination competitiveness, globalization, and strategic development from a development economics perspective
”, PhD dissertation Illinois:
University of at Urbana-Champaign
.
Porter
,
M.
(
1985
), “
Technology and competitive advantage
”,
Journal of Business Strategy
, Vol.
5
No.
3
, pp.
60
-
78
.
Porter
,
M.
(
1990
),
The Competitive Advantage of Nations
,
Harvard Business Review, The Free Press
,
New York, NY
.
Posner
,
M.V.
(
1961
), “
International trade and technological change
”,
Oxford Economic Papers
, Vol.
13
No.
3
, pp.
323
-
341
.
Pulido-Fernández
,
J.I.
and
Rodríguez-Díaz
,
B.
(
2016
), “
Reinterpreting the World Economic Forum’s global tourism competitiveness index
”,
Tourism Management Perspectives
, Vol.
20
, pp.
131
-
140
.
Pulido-Fernández
,
J.I.
,
Andrades-Caldito
,
L.
and
Sánchez-Rivero
,
M.
(
2015
), “
Is sustainable tourism an obstacle to the economic performance of the tourism industry? Evidence from an international empirical study
”,
Journal of Sustainable Tourism
, Vol.
23
No.
1
, pp.
47
-
64
.
Song
,
H.
and
Witt
,
S.F.
(
2000
),
Tourism Demand Modelling and Forecasting, Modern Economic Approaches
:
Pergamon
,
Amsterdam
.
Vernon
,
R.
(
1966
), “
International investment and international trade in the product cycle
”,
Quarterly Journal of Economics
, Vol.
80
No.
2
, pp.
190
-
207
.
WEF
(
2019
),
Global Competitiveness Report 2019
.
Botti
,
L.
,
Peypoch
,
N.
,
Robinot
,
E.
and
Solonadrasana
,
B.
(
2009
), “
Tourism destination competitiveness: the French regions case
”,
European Journal of Tourism Research
, Vol.
2
No.
1
, pp.
5
-
24
.
Priestley Commission
(
1955
),
Report of The Royal Commission on The Civil Service
,
1953–55
.
Dias
,
J.G.
(
2017
), “
Environmental sustainability measurement in the travel and tourism competitiveness index: an empirical analysis of its reliability
”,
Ecological Indicators
, Vol.
73
, pp.
589
-
596
.
Dupont
,
L.
(
2007
),
Evaluation De la Compétitivité Touristique Des Destinations Guadeloupe Et Martinique Par Analyse De Leur Productivité Et Efficacité Une Comparaison Inter-Caraïbe
,
The George Washington, DC University
, availabel at: ledupont2@wanadoo.fr
Dwyer
,
L.
,
Mellor
,
R.
,
Livaic
,
Z.
,
Edwards
,
D.
and
Kim
,
C.
(
2004
), “
Attributes of destination competitiveness: a factor analysis
”,
Tourism Analysis
, Vol.
9
No.
1
, pp.
91
-
101
.
Gomezelj
,
D.O.
and
Mihalic
,
T.
(
2008
), “
Destination competitiveness – applying different models, the case of Slovenia
”,
Tourism Management
, Vol.
29
No.
2
, pp.
294
-
307
.
Hall
,
C.M.
(
2007
), “
Tourism and regional competitiveness
”, in
Tribe
,
J.
and
Airey
,
D.
(Eds),
Developments in Tourism Research
,
Elsevier
,
Amsterdam
, pp.
217
-
230
.
Mazanec
,
J.A.
and
Ring
,
A.
(
2011
), “
Tourism destination competitiveness: second thoughts on the World Economic Forum reports
”,
Tourism Economics
, Vol.
17
No.
4
, pp.
725
-
751
.
OCDE
(
2013
), “
Indicateurs de la compétitivité du tourisme: Document d'orientation
”,
Éditions OCDE
,
Organisation Mondiale du Tourisme
(
2016
), “
Faits saillants du tourisme – Édition 2016
”,
UNWTO
,
Madrid
, doi: .
The Phocus wright
(
2011
), “
Destination unknown: how U.S. and European travelers decide where to go 2011
”,
Report
,
Ritchie
,
B.J.R.
and
Crouch
,
G.I.
(
1993
), “
Competitiveness in international tourism—a framework for understanding and analysis
”,
Reports on 43rd Congress
, Vol.
35
, pp.
23
-
71
.
Ritchie
,
J.R.B.
and
Crouch
,
G.I.
(
2000
), “
The competitive destination, a sustainable perspective
”,
Tourism Management
, Vol.
21
, pp.
1
-
7
.
Ritchie
,
J.R.B.
and
Crouch
,
G.I.
(
2002
), “
Country and city state destinations
”,
Tedqual
, Vol.
5
, pp.
13
-
16
.
Ritchie
,
J.R.B.
and
Crouch
,
G.I.
(
2003
),
The Competitive Destination, a Sustainable Tourism Perspective
,
Cabi Publishing
,
Cambridge
.
Ritchie
,
J.R.B.
and
Crouch
,
G.I.
(
2005
),
The Competitive Destination: A Sustainable Tourism Perspective
,
Oxford University Press
,
Oxford
.
Seddighi
,
H.R.
and
Theocharous
,
A.L.
(
2002
), “
A model of tourism destination choice: a theoretical and empirical analysis
”,
Tourism Management
, Vol.
23
No.
5
, pp.
475
-
487
.
Song
,
H.
and
Li
,
G.
(
2008
), “
Tourism demand modelling and forecasting: a review of recent research
”,
Tourism Management
, Vol.
29
No.
2
, pp.
203
-
220
.
Stiger
,
J.H.
(
1980
), “
Test for comparing elements of a correlation
”,
Psychological Bulletin
, Vol.
87
No.
2
, pp.
245
-
251
.
Tabarly
,
S.
(
2011
), “
Évaluer et comparer l'attractivité touristique: des outils Géoconfluences, février
”,
WTTC
(
2014
), “
Economic impact of Travel and Tourism 2014, rapport annuel
”.

Languages

or Create an Account

Close Modal
Close Modal