This study aims to assess flood-prone areas in Auckland, New Zealand, using stream order analysis as a geospatial tool to delineate flood risk zones. The research addresses the growing need for efficient flood risk mapping in urban settings by providing a simplified, yet effective, method for identifying high-risk zones. The central argument is that stream order classification offers critical insights into flood susceptibility, especially in rapidly urbanising regions.
The methodology integrates a high-resolution digital elevation model (DEM) to derive flow direction and flow accumulation grids, simulating the natural movement of surface water. Using the Strahler stream order method, the study classifies water channels based on flow convergence patterns to pinpoint areas with greater flood potential. Geographic information system-based spatial analysis tools were used, and Landsat 8 imagery provided the environmental context.
The analysis reveals that areas with higher stream orders, particularly within urbanised zones, are significantly more prone to flooding due to increased water accumulation. The stream order approach effectively identifies flood-prone areas without complex hydraulic modelling, making it a practical tool for preliminary flood risk assessments.
This research presents an innovative application of stream order analysis as a macro-scale terrain screening tool for flood susceptibility mapping, offering a blend of simplicity and scalability suited to early-stage planning support and data-scarce contexts. Rather than replacing detailed hydraulic or site-specific assessments, this method complements existing high-resolution flood models by providing a low-data, catchment-scale first-pass indicator of flood-prone zones. While stream order analysis has been used in previous flood studies, this study’s unique contribution is its application to Auckland’s hydrological network, achieved by integrating a DEM and land-use/land-cover (LULC) data. The distinctive value of this study lies in its tailored application to Auckland, effectively linking stream order analysis with urban growth dynamics and recent significant flood events. Future studies could incorporate higher-resolution datasets and real-time hydrological inputs to refine predictions and enhance decision-support systems.
1. Introduction
Flooding is one of the most persistent and destructive natural hazards globally, affecting many communities, ecosystems and infrastructures (McDermott, 2022). In urban environments, flood susceptibility is influenced by factors such as land-use changes, topography, drainage networks and climate variability (Konrad, 2003). According to UN-Habitat’s World Cities Report 2024 (Guterres, 2024), approximately 1 billion people live in areas prone to riverine flood events with a 100-year return period, with half residing in urban centres. An analysis of 1,860 cities revealed that 1,406 cities (76%) were located in areas highly vulnerable to flood-related mortality, affecting about 2 billion urban residents (Gumk, 2019). Its impact is especially pronounced in urban areas, where population density, infrastructure and climate change exacerbate flood risks (Cea and Costabile, 2022). Like many other nations, New Zealand faces frequent flooding, with both urban and rural areas susceptible to inundation during intense weather events (McKerchar and Pearson, 2001). Recent studies and research have highlighted the increasing frequency of flood events, which is closely tied to climate change and urbanisation, both of which contribute to rising sea levels and more erratic weather patterns (Fuchs et al., 2011). Floods cause immediate destruction and have long-term socio-economic consequences, including loss of property, livelihoods and critical infrastructure (Negi et al., 2022). As these events continue to increase in frequency and intensity, there is a pressing need to develop innovative methods for flood risk assessment that are both efficient and accessible (Kvočka et al., 2016). The understanding of flood risk has evolved significantly over the past decades, especially with advancements in geographic information system (GIS), remote sensing and hydrological modelling (Wang and Xie, 2018). Traditional flood mapping approaches often involve complex, data-intensive models that require extensive resources and technical expertise (Chandran et al., 2024). While accurate, these methods can be resource-intensive, making them difficult to apply in areas with limited data or financial constraints (Ekeu-wei and Blackburn, 2018). As a result, there has been a growing interest in simplifying flood risk assessment methodologies, focusing on accessible data and more efficient analytical tools (Glas et al., 2019). In the case study of Culiacan, Mexico (Sanhouse-García et al., 2021), a high-resolution digital elevation model (DEM) was utilised to analyse streamflow directions and determine stream orders, simplifying flood identification without complex hydraulic modelling. It highlights the impact of urbanisation on drainage, where high-order streams accumulate runoff due to limited infiltration, causing flooding in low-lying areas. This methodology offers a practical approach to flood risk assessment, aiding urban planning and drainage system improvements. This study, therefore, aims to provide insights into flood-prone areas using stream order analysis and geospatial techniques. Although Auckland is a data-rich environment with high-resolution LiDAR-based terrain models and detailed flood hazard mapping provided by Auckland Council, this study deliberately adopts a lower-resolution (30 m DEM) approach to test a transferable, computationally efficient framework applicable to both data-rich and data-scarce urban regions. Auckland is used as a benchmark case to evaluate how far geomorphological indicators such as stream order can capture meaningful flood susceptibility patterns under simplified data conditions. Accordingly, the following research question will be explored: How does the distribution and classification of stream orders in Auckland’s hydrological network contribute to identifying high-risk flood zones and informing effective flood mitigation strategies for urban resilience? The results of this research will provide insights for urban planners, policymakers, environmental managers and researchers. By aligning with Sustainable Development Goals (SDGs) 11 and 13, this study seeks to enhance flood resilience in Auckland and promote sustainable water management practices.
2. Literature review
2.1 Flood risk and geographic information system-based approaches
Flood risk assessment has evolved significantly, particularly with the integration of GIS, remote sensing and hydrological modelling (Wang and Xie, 2018). Traditional flood mapping relies on complex, resource-intensive models that require extensive data sets, limiting their applicability in regions with scarce data (Chandran et al., 2024). Research has emphasised the need for accessible, scalable approaches, particularly for developing countries with limited resources (Zhang et al., 2019). GIS-based flood-mapping techniques, such as DEMs and stream network analysis, provide a viable alternative for identifying flood-prone areas (Ali et al., 2016).
(Kourgialas and Karatzas, 2011) developed one of the earliest comprehensive GIS-based flood hazard models that integrated hydrological, geomorphological and land-use factors to delineate flood risk zones. Similarly, (Pradhan et al., 2023) and (Rahmati et al., 2016) demonstrated that integrating statistical and spatial analyses within GIS can achieve accurate flood-susceptibility mapping even with limited data sets. Other studies have incorporated multi-criteria decision analysis methods, such as the Analytical Hierarchy Process (Mudashiru et al., 2022), which allow for objective weighting of factors such as slope, rainfall and soil type. Remote sensing has also played a critical role in improving the precision of flood risk assessments. Studies by Okolie and Smit (2022), Munawar, Hammad, and Waller, and others highlighted how combining satellite imagery with topographic data enhances real-time flood monitoring and delineation. Recent research by Chowdhury (2023) and Zhang et al. (2021) further supports integrating DEM-derived hydrological indices, such as flow accumulation and drainage density, to improve flood mapping in urban and data-limited environments. These studies establish the effectiveness of GIS-based flood modelling as a robust and accessible method for flood risk assessment. The current study builds on this foundation by incorporating stream order analysis with DEM-based hydrological modelling to enhance the spatial identification of flood-prone areas in Auckland, New Zealand.
2.2 Stream order analysis in hydrology
Stream order is a hydrological classification system that categorises rivers and streams based on their position within a drainage network (Sanhouse-García et al., 2021). The system was introduced by Horton (1945) and later refined by Strahler (1957), providing a systematic framework for understanding riverine structures and functions (Strahler, 1992). Stream order classification is widely used in hydrology to analyse water flow dynamics and flood risk (Enea et al., 2024). By assigning numerical values based on stream connectivity, researchers can model water movement, predict flood-prone areas, and design effective mitigation strategies (Mihola, 2011). Strahler’s stream order system is one of the most widely used methods, based on a hierarchical numbering principle: the smallest unbranched tributaries are designated as first-order streams, and when two first-order streams converge, they form a second-order stream (Chatrabhuj et al., 2024). This numbering continues, with order increases occurring only when two streams of the same order merge (Lanfear, 2007). The simplicity and scalability of Strahler’s method make it a valuable tool for hydrological analysis in diverse landscapes (Al-Wagdany et al., 2020).
2.3 The role of stream order in flood risk assessment
Stream order classification provides insights into water movement and potential flood risk areas. Understanding how water converges and flows through urban drainage systems helps improve flood risk prediction (Enea et al., 2024). Lower-order streams, often located at higher elevations, contribute runoff to higher-order streams, which are more prone to flooding due to higher water volumes. Higher-order streams indicate regions of greater water accumulation, which may be more susceptible to flooding (Sanhouse-García et al., 2021). Studies have shown that urbanisation alters natural drainage patterns, leading to inefficient stormwater management and increased flood hazards (Hosseinzadeh, 2005). A related but distinct mechanism affecting urban runoff generation, and one not fully captured by standard land-use/land-cover (LULC)-based hydrological assumptions, is subsurface soil compaction associated with subdivision earthworks. During residential and commercial land development, topsoil is frequently stripped and underlying subsoil compacted by construction machinery prior to landscaping or turf establishment. Although the resulting surfaces are subsequently classified as “vegetated” or “grassland” based on spectral or visual land cover signatures, their compacted subsoil structure can substantially reduce infiltration capacity, causing them to generate surface runoff at rates approaching those of impervious surfaces(Pitt et al., 2002). This effect has been documented in the New Zealand context: a case study of a residential subdivision infiltration basin in Christchurch found infiltration rates of less than 2 mm/hr as a direct result of topsoil over-compaction during construction, even after remedial soil aeration (Brunton et al., 2013). While this evidence is drawn from Christchurch rather than Auckland specifically, it demonstrates that construction-stage soil compaction is a recognised and measurable phenomenon in New Zealand residential development more broadly, and there is no clear reason to expect Auckland subdivisions to be systematically exempt from the same earthwork’s practices. This distinction is significant for flood susceptibility modelling, as it demonstrates that land cover classification alone, whether from remote sensing or standard LULC products, may not reliably indicate a surface’s actual hydrological (infiltration) behaviour in rapidly urbanising catchments, where subdivision-stage earthworks are common and ongoing. By incorporating stream order analysis with remote sensing and hydrological modelling, planners can develop more effective flood mitigation strategies (Anees et al., 2017). Research suggests that integrating stream order with GIS-based flood modelling improves the accuracy of flood-prone area identification (Lin and Billa, 2021). The method is particularly relevant in urban areas where impermeable surfaces exacerbate flood risks. Moreover, this approach helps identify critical areas where drainage improvements are necessary to minimise flood damage and enhance urban resilience (Skrede et al., 2023).
While there is limited literature specifically for Auckland with the exact stream-order versus elevation thresholds found in this study, recent regional reports following the 2023 extreme rainfall events provide important context. Auckland Council, for example, the Council provides spatial flood information through its Flood Viewer and GeoMaps platforms, which map flood-prone areas, overland flow paths, and flood plains to support planning and risk awareness (Council, 2025b). In addition, developed the Property-Level Flood Risk Assessment Framework to assess flood hazards at the property scale, using parameters such as water depth, flow velocity and combined hazard ratings to evaluate risks to buildings and occupants (Council, 2025c). However, these local assessments rely primarily on hazard classification, and stormwater network analysis rather than geomorphological indicators such as stream-order thresholds. A review of available post-2023 council technical documentation indicates that stream order analysis has not been widely applied for flood susceptibility assessment in the Auckland urban context, highlighting a local research gap that the present study addresses.
Many hydrological and geomorphological studies across diverse regions support the idea that higher-order stream channels are associated with greater flood risk, especially when they occur in low-elevation zones, on steep slopes, and in combination with impervious land cover or built environments that reduce infiltration. While there is limited literature specifically for Auckland with the exact stream-order vs elevation thresholds found in this study, here are several relevant examples: In the Wadi Al-Lith watershed, Saudi Arabia, researchers used Strahler stream ordering, drainage density, slope, and other morphometric parameters to evaluate flash-flood hazard (Bashir and Alsalman, 2024). They found that lower-elevation catchments with higher stream order had significantly higher flood risk.
2.4 Historical flood event
The Auckland flood events of January 27th and February 13th and 14th, 2023, represent two of the most devastating and unprecedented hydrometeorological disasters in New Zealand’s history (Vallis et al., 2025). The event, which occurred over Auckland Anniversary Weekend, was triggered by an intense atmospheric river system that delivered approximately 265 mm of rainfall within 24 h, the highest daily total ever recorded in the city (Brook and Nicoll, 2024). This extreme precipitation overwhelmed urban drainage networks, resulting in widespread inundation, flash flooding and slope failures. Critical infrastructure, including Auckland Airport, major transport corridors and residential areas, sustained severe damage, while thousands of properties required structural safety assessments. The event caused four fatalities and widespread community displacement, prompting a state of emergency across the region (NIWA, 2023b). In total, this event caused damage and economic losses. These back-to-back disasters highlight the growing vulnerability of Auckland’s urban environment to extreme weather events and emphasise the urgent necessity for integrated flood resilience planning, improved stormwater infrastructure, and climate-adaptive urban management strategies (NIWA, 2023a).
2.5 Aligning flood risk assessment with Sustainable Development Goals 11 and 13
SDG 11 promotes sustainable urban development by enhancing resilience to natural disasters, including floods, through improved infrastructure planning and risk assessment (Barcellos‐Paula et al., 2025). The targets of SDG 11 include reducing the adverse impacts of disasters on urban populations and ensuring the creation of inclusive, safe and resilient cities. Urbanisation has increased impermeable surfaces, exacerbating flood risks in cities like Auckland (Ferguson et al., 2023). SDG 13 focuses on climate action, emphasising adaptive flood management strategies such as nature-based solutions and green infrastructure (Hofmeister et al., 2024). The integration of adaptive flood management strategies, including nature-based solutions and green infrastructure, is critical for strengthening climate resilience and incorporating disaster risk measures into urban planning. (Hofmeister et al., 2024).
In addition, Tomar et al. (2021) demonstrated the efficacy of GIS-based flood hazard mapping in mitigating urban flood risks, emphasising its role in sustainable development and disaster preparedness. This research introduces a practical, cost-effective approach to flood risk assessment using stream order classification and GIS. Unlike traditional flood models requiring extensive data and computational resources, this methodology leverages readily available DEMs and hydrological data sets to provide accurate insights into flood susceptibility. This approach aligns with the growing need for simplified flood assessment techniques that remain analytically rigorous and accessible to planners and decision-makers. By integrating stream order analysis with GIS, the study provides an innovative framework applicable across various geographic contexts, supporting urban resilience and climate adaptation strategies. The findings will contribute to flood risk management efforts, providing policymakers, urban planners and disaster response agencies with insights to enhance flood resilience in Auckland and other regions.
3. Methodology
This study aimed to assess flood-prone areas in Auckland, New Zealand, using stream order analysis to identify regions at risk of flooding. The methodology integrates high-resolution geospatial data sets to provide a comprehensive understanding of flood risk zones. The entire study workflow begins with extensive data acquisition. This approach is grounded in the use of a high-resolution DEM from the USA Geological Survey to analyse morphometric parameters of the study area (Okolie and Smit, 2022). Data pre-processing is an important component of the study. Flow direction and flow accumulation grids were generated to simulate water movement across the terrain. Stream order classification using the Strahler method plays a pivotal role, as it helps identify areas with varying flood risks by analysing water-flow concentration patterns. This theoretical approach elucidates the relationship between stream hierarchy and hydrological behaviour, enabling the identification of flow paths, confluence points, and regions of high-water accumulation (Ghorai et al., 2022). Theoretical insights were applied to understand how higher-order streams and urbanisation intensify flood risks, with a particular focus on flood hotspots in urban zones. Using this information, flood-prone zones were delineated, categorising areas based on stream order and flow accumulation values. This zonation provides a simplified yet effective way to identify areas at risk of flooding without complex hydraulic calculations. By combining theoretical rigour with practical applications, this study provides a robust framework for assessing flood-prone areas, offering guidance for disaster management and enhancing urban resilience in Auckland.
3.1 Stream ordering methods and justification
Stream ordering is a fundamental hydrological technique used to classify the hierarchical structure of drainage networks, which is essential for understanding runoff dynamics, stream flow accumulation and flood susceptibility (Mandal, 2018). Several methods have been developed to assign stream orders, including the Horton, Shreve and Strahler systems, each with distinct conceptual frameworks and analytical implications. The Horton method (1945) was one of the earliest approaches, in which the smallest fingertip tributaries are designated as first-order streams, and order increases downstream when two streams of the same order meet (Shreve, 1966). While simple, Horton’s system can lead to inconsistencies in larger drainage basins due to subjective interpretation of tributary hierarchy. The Shreve method (1967), in contrast, assigns magnitude values rather than hierarchical ranks (Sah and Das, 2017). Each initial stream segment is assigned a magnitude of one, and when two segments join, their magnitudes are added (Sah and Das, 2017). This approach effectively captures discharge potential but does not account for the relative importance of tributary junctions or catchment morphology, making it less suitable for spatial comparisons of terrain-derived hydrological characteristics (Ghandehari, 2013). The Strahler method (1957), an advancement of Horton’s system, provides a more consistent and hierarchical classification by increasing stream order only when two streams of the same order converge (Hodgkinson). This method has become the most widely adopted in hydrological and geomorphological studies due to its simplicity, reproducibility and strong correlation with watershed hydrological behaviour (Almasalmeh and Eizeldin, 2019). The Strahler approach facilitates the quantitative analysis of drainage density, bifurcation ratio and stream frequency parameters that directly influence flood generation and surface runoff potential (Strahler, 1997). It is acknowledged that urban flooding is fundamentally a volume and discharge dependent process, and the Shreve stream magnitude method, which sums contributing segments additively at each confluence, more directly approximates cumulative discharge potential than the Strahler method, which increases order only when two streams of equal order converge. However, the Strahler method was selected for this study for three primary reasons. Firstly, Strahler order provides a bounded, hierarchical classification (typically ranging from 1st to 4th order across a catchment of this scale) that is directly interpretable for zonal risk classification and communication to non-technical planning audiences, whereas Shreve magnitude values are unbounded and scale directly with network size, making them less suited to producing a small number of discrete, interpretable risk categories for urban planning application. Secondly, Strahler ordering has been the dominant classification method applied in prior stream-order-based flood susceptibility studies internationally (El Bastawesy et al., 2021; Sanhouse-García et al., 2021) and its use here maintains methodological consistency and comparability with this established literature base. Thirdly, because the present study uses stream order as a categorical proxy indicator of flood susceptibility zoning rather than as a direct quantitative estimate of discharge or flood volume, the topological consistency and reproducibility of the Strahler method were prioritised over the magnitude-based additive properties of the Shreve method. It is nonetheless recognised that Shreve magnitude, or a hybrid approach combining Strahler order with Shreve-derived magnitude as a secondary weighting variable, could provide a more volume-sensitive refinement of the susceptibility classification in future work, particularly for prioritising infrastructure investment where discharge magnitude at specific confluence points is of direct engineering relevance.
Therefore, in this study, the Strahler method was selected for stream ordering because it provides a clear hierarchical structure of the drainage network that correlates effectively with catchment hydrological response and flood susceptibility patterns. Its integration with GIS-based hydrological tools also enables efficient computation and visualisation of the stream hierarchy across the Auckland region’s complex terrain.
3.1.1 Methodologically rational.
Urban flood risk assessment traditionally relies on hydraulic and hydrodynamic models that require extensive input data, including long-term rainfall records, river discharge measurements, and detailed channel geometry (Khoshkonesh et al., 2024). While these approaches provide high predictive accuracy, they are often data-intensive, computationally demanding, and difficult to apply for rapid assessments at a city-wide scale. In rapidly urbanising environments such as Auckland, where flood risk is spatially heterogeneous and decision-making timelines are short, there is a clear need for a simplified yet physically meaningful method to identify flood-prone zones using readily available data. This study addresses this gap by adopting a DEM-derived stream-order-based approach that captures hydrological connectivity and runoff convergence without relying on complex hydraulic simulations. The method enables efficient spatial screening of flood susceptibility and supports planning-oriented flood resilience assessments.
3.2 Study area
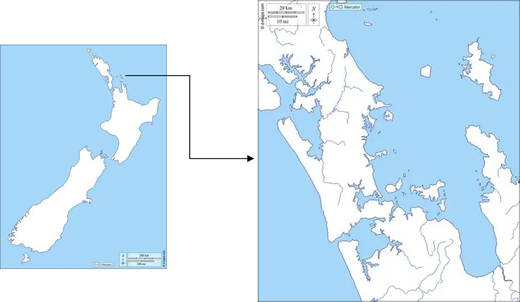
Auckland, the largest metropolitan area in New Zealand, is depicted in Figure 1 and is characterised by volcanic cones, coastal lowlands, and an extensive river and stream network (Németh et al., 2021). Auckland experiences a temperate maritime climate with significant seasonal rainfall, including short-duration high-intensity events, which, combined with low-lying topography, create heterogeneous flood risk across relatively small spatial scales (Brook and Nicoll, 2024). Rapid urbanisation and population growth have increased impervious surfaces and altered natural drainage, exacerbating stormwater runoff and flood susceptibility (Wang et al., 2023). The complex interaction between natural terrain and urbanised surfaces makes Auckland an ideal case study to evaluate DEM-derived morphometric analyses, stream order classification, and GIS-based flood susceptibility mapping, as these methods can systematically capture areas of high water accumulation and inform urban flood mitigation strategies (Lin and Billa, 2021).
3.2.1 Demography.
Auckland is New Zealand’s largest and fastest-growing urban area, with sustained population growth and associated land-use change that have increased the extent of impervious surfaces and altered natural drainage connectivity. Understanding the relationship between Auckland’s population growth and urban development from Table 1 is essential for this study because it helps identify areas with higher flood risks. As more people moved into the city and more buildings were built, natural land that could absorb rainwater was replaced with concrete and asphalt, which do not allow water to soak into the ground (Qi et al., 2009). This caused more water to flow into the streets and drainage systems, increasing flooding (Wang et al., 2023). By analysing how the city has changed over time, this study can pinpoint areas where rapid urbanisation has worsened flooding, which is vital for developing effective strategies to manage and reduce flood risks in those areas.
3.2.2 Evolution and urban transformation.
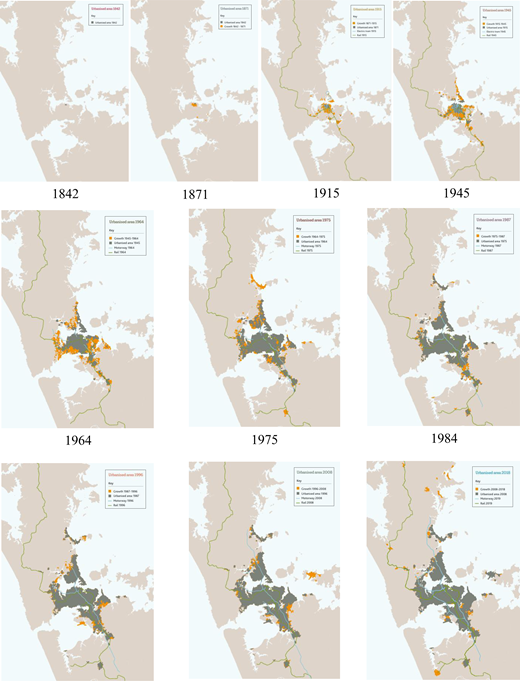
Including an evolution map (Figure 2) in this research helps to understand the historical context of urban development and its impact on flood susceptibility. It illustrates how changes in land use, increased impervious surfaces, and expanded infrastructure have altered natural drainage patterns and heightened flood risks in urban areas. This understanding is essential for identifying vulnerable zones and guiding mitigation strategies. The evolution of Auckland’s urban growth from 1842 to 2015 shows the city’s steady expansion from a small settlement to a large metropolitan area. Key periods of development are marked by industrialisation, post-war suburbanisation, and ongoing population increases. By 2015, Auckland had developed into a densely urbanised city with extensive infrastructure and residential, commercial and industrial zones.
3.3 Data used
This study used two primary data sets: a DEM and Landsat 8 imagery. The DEM was used to identify drainage patterns and catchment areas, extract stream networks and classify stream orders. Landsat 8 imagery was used to analyse land-use and land-cover changes, providing insights into urban expansion and its potential impact on flooding. These data sets were processed to ensure consistency in spatial and temporal scales.
3.4 Data acquisition and analysis
The primary data set for this analysis was a high-resolution DEM, which provides critical topographic information for hydrological analyses, including sink filling, flow direction and flow accumulation modelling, which form the foundation of watershed and flood risk assessment. DEM data was sourced from publicly available repositories such as the USA Geological Survey (USGS). The use of a 30 m DEM, rather than high-resolution LiDAR data available for Auckland, is intentional to ensure methodological scalability and transferability. This allows the framework to be applied in regions where high-resolution elevation data is unavailable or inaccessible, particularly in developing or data-scarce urban environments. Although the D8 flow-routing algorithm is widely used for regional hydrological analysis, it simplifies surface flow by assigning flow from each cell to the steepest downslope neighbour. Consequently, when applied to a 30 m DEM, the approach does not resolve fine-scale urban features such as roads, kerbs, retaining walls or engineered drainage infrastructure that influence pluvial flood routing in highly urbanised environments such as Auckland. Therefore, the method is intended to represent catchment-scale hydrological connectivity rather than detailed property-scale overland flow dynamics.The Fill tool was first used to remove surface depressions, ensuring a continuous flow surface for accurate hydrological simulation. The Flow Direction tool, based on the D8 algorithm, was then applied to determine the steepest descent path from each cell, thereby identifying potential water movement directions across the landscape (Wang et al., 2014). Subsequently, Flow Accumulation was calculated to quantify upstream contributing areas, highlighting drainage paths and potential stream channels (Lindsay et al., 2008). A thresholding technique was employed to extract the stream network from the flow accumulation raster, distinguishing primary drainage routes from minor flow paths. This step was essential for generating a hydrologically valid stream network suitable for subsequent Strahler stream-order classification, a widely recognised approach to understanding catchment hydrology and flood connectivity (Kourgialas and Karatzas, 2011; Strahler, 1992). Higher-order streams, as identified through this classification, indicate greater water accumulation and flood potential, aligning with established hydrological theory (Lin and Billa, 2021). A LULC map was also acquired from Landsat 8 to facilitate a comparative analysis with the stream order network. A LULC map is an essential tool for flood analysis because it provides comprehensive information about Earth’s surface characteristics, which directly influences hydrological processes (Hasan et al., 2023). Changes in land use significantly affect a watershed’s hydrological characteristics, including annual mean discharge, flood frequency, groundwater recharge and streamflow (Ragi and V, 2023). Intensive land use practices often reduce vegetation cover within a watershed, leading to lower humidity and increased aridity (Parveen et al., 2018). Areas with sparse vegetation experience high surface runoff and limited water retention capacity, while regions with dense vegetation exhibit higher evapotranspiration rates and reduced annual river flow (Zope et al., 2016). LULC changes have become a key focus in modern strategies for natural resource management and environmental change monitoring (Kaul and Ingle, 2012). The LULC map was generated using Landsat 8 imagery obtained from the USGS website to analyse these dynamics. The combined DEM LULC framework thus enhances the accuracy of flood-prone zone delineation and supports evidence-based urban flood management planning for Auckland.
3.4.1 Step-by-step analytical framework.
The analytical framework was developed through a systematic, step-by-step GIS-based workflow to ensure transparency, reproducibility and scientific robustness. Firstly, a high-resolution DEM was acquired and pre-processed using sink-filling techniques to remove artificial depressions that could distort hydrological flow paths. Secondly, flow direction was computed using the D8 algorithm to determine the steepest downslope direction of water movement across the terrain. Thirdly, flow accumulation was calculated to quantify upstream contributing areas, enabling the identification of drainage convergence zones. Fourthly, a threshold value was applied to the flow accumulation raster to extract a hydrologically meaningful stream network while excluding minor surface runoff paths. Fifthly, the extracted stream network was classified using the Strahler stream-order method, assigning hierarchical stream orders according to stream-convergence rules. Finally, the stream order map was spatially overlaid with land use/land cover and elevation data to delineate flood-prone zones, particularly where higher-order streams intersect urbanised and low-lying areas. This stepwise approach ensures that flood susceptibility is identified based on terrain-driven hydrological processes rather than subjective weighting schemes.
4. Results
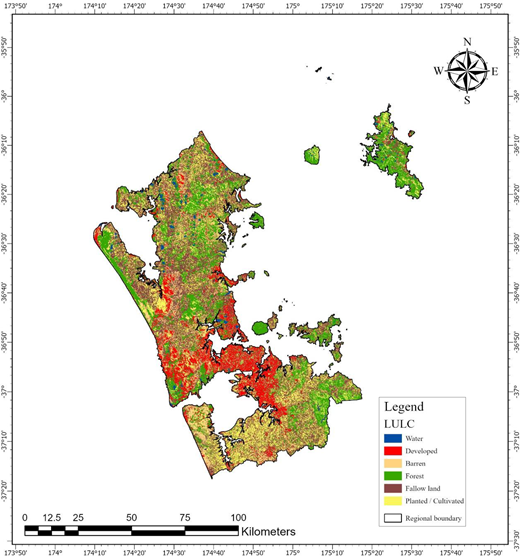
LULC analysis provides a detailed view of land category distribution and its influence on environmental and urban processes. The classification of Auckland’s LULC (Figure 3) using Landsat 8 imagery from the USA Geological Survey (USGS) highlights the dominance of several key land types. A significant portion of Auckland, the region, consists of unused or barren land, presenting opportunities for future development. This type of land presents opportunities for future development or ecological restoration. Forested areas cover a substantial part of the landscape, playing a vital role in supporting biodiversity, regulating climate, and providing ecosystem services. Agricultural land, including cultivated fields and farmland, also forms a considerable share, reflecting the region’s reliance on food production and rural economies. Urban settlements occupy a noticeable portion of the landscape, indicating the extent of built-up infrastructure, residential zones and commercial areas. While urban expansion is evident, a balance between developed and natural spaces remains. Water bodies such as lakes and rivers cover a smaller fraction of the region but are crucial for water supply, ecological balance and flood management. This distribution of land types highlights the need for strategic land management to ensure environmental sustainability, efficient resource allocation, and resilience against climate-related challenges. Understanding these patterns helps guide urban planning, conservation efforts, and decision-making for disaster preparedness.
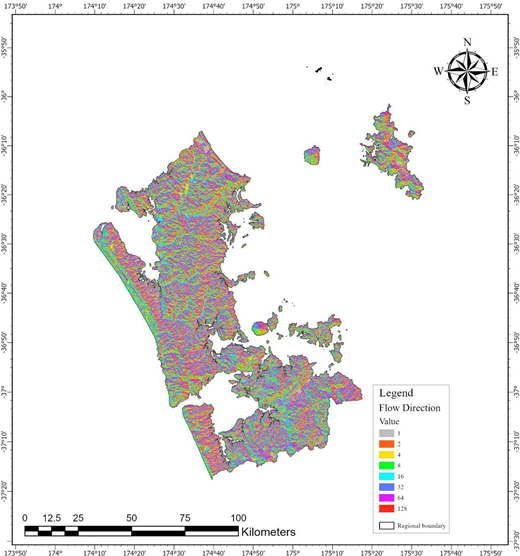
DEM is a digital representation of the land surface elevation (Balasubramanian, 2017). DEMs provide valuable information about terrain characteristics, such as elevation at specific locations, slope gradients and aspect directions (Lakshmi and Yarrakula, 2019). DEMs are key for identifying and analysing terrain features such as drainage basins and channel networks, providing critical insights into the landscape’s topographical and hydrological attributes (Yang et al., 2011). DEM data were first processed using the Fill tool in ArcGIS Pro to remove depressions, ensuring a continuous and accurate surface for hydrological analysis. These depressions can cause inaccuracies in flow direction calculations. Once the data set was refined, a flow direction raster (Figure 4) was generated using the D8 algorithm, which determines the direction of water movement by evaluating the steepest downslope path from each grid cell’s gradient (Wang et al., 2014).
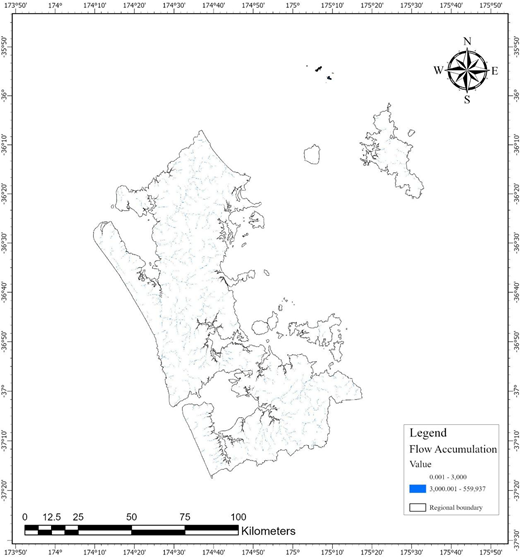
This step was fundamental in delineating potential water pathways across the landscape. Following the flow direction computation, a flow accumulation raster (Figure 5) was derived, indicating the number of upstream cells contributing to each point. High-flow accumulation values indicated potential stream channels and enabled delineation of significant hydrological features. A threshold was applied to the flow accumulation raster to refine the stream network, filtering out minor flow paths. This thresholding process helped filter out minor flow paths, ensuring that only meaningful hydrological features were included in the analysis. This refined network served as the basis for the subsequent stream-ordering process.
Once the stream network was delineated, stream ordering was conducted using Strahler’s method, a widely accepted hierarchical classification system that assigns orders based on the convergence of streams. The classification process began by assigning first-order status to streams originating from source points without tributaries. The resulting segment was classified as a second-order stream when two first-order streams merged. As more tributaries converged, higher-order streams were formed, progressively increasing in order. This classification was important for understanding hydrological connectivity and the role of different stream segments in flood dynamics. Higher-order streams indicate areas of significant water accumulation, which are critical for assessing flood risk. The hierarchical structure of the stream network, which was analysed, allowed for the determination of the spatial distribution of water flow and the identification of key drainage pathways. This information was instrumental in assessing the extent of water movement and potential flood-prone regions, particularly where high-order streams coincide with low-lying topography or urban developments.
4.1 Stream order classification and interpretation
The examination of stream ordering within the Auckland region yields critical insights into the hydrological dynamics of both urban and natural watercourses. A detailed analysis of stream order classification enhances comprehension of drainage patterns and facilitates the identification of zones particularly vulnerable to flooding. The methodology underlying stream order is rooted in a hierarchical framework in which lower-order streams converge to form higher-order streams.
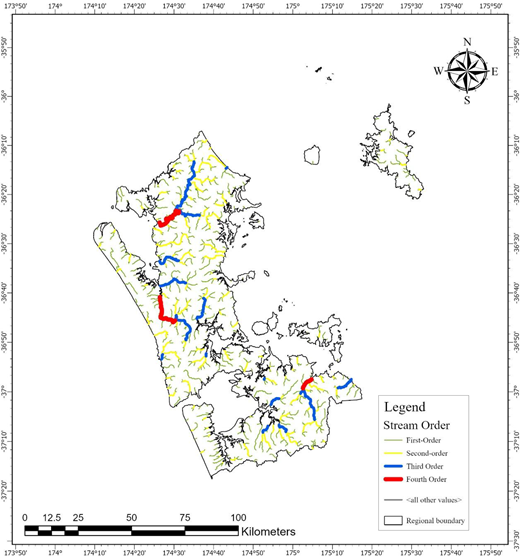
Figure 6 indicates that the Auckland region has a diverse network of streams, ranging from first-order to fourth-order. The figure shows different stream orders using colour coding: green for first-order streams, yellow for second-order streams, blue for third-order streams, and red for fourth-order streams. Each stream order represents a distinct role in the hydrological system and contributes to the overall drainage pattern. First-order streams (green) are the smallest and are typically located at higher elevations. These streams originate from surface runoff and serve as the initial contributors to the drainage system. Because they are located in elevated areas, first-order streams pose minimal flood risk. However, they are crucial in feeding water into the more extensive drainage network. These streams often have short flow paths and depend highly on local rainfall patterns. Second-order streams (yellow) form when two or more first-order streams converge. These streams act as intermediate channels that collect and transport water further downstream. While the flood risk in these areas is relatively low, urban development can impact their flow dynamics, potentially leading to localised flooding during heavy rainfall events. In some areas, these streams are subjected to modification, such as culverting and channelisation, which can alter their natural flow. Third-order streams (blue) represent a significant water accumulation from multiple second-order streams. These streams play a critical role in shaping the region’s hydrological connectivity and contribute significantly to flood susceptibility, particularly in urban areas where land use changes have altered natural drainage patterns. Fourth-order streams (red) are the most critical for flood risk, as they serve as major drainage channels that collect water from numerous lower-order streams. These streams are often found in low-elevation zones where water accumulates. The red zones on the map highlight the areas most vulnerable to flooding, as they serve as the primary drainage pathways in the Auckland region. Due to their high capacity and potential for flooding, these areas require extensive flood mitigation strategies.
4.2 Flood risk assessment
The map (Figure 6) identifies areas where water accumulation is more likely based on stream hierarchy and flow direction. The central and northern regions of Auckland exhibit a high flood risk, primarily due to several fourth-order streams, shown in red on the map (Figure 6). These streams drain extensive catchments, making them susceptible to substantial water accumulation during heavy rainfall. Given the higher stream order, these water bodies integrate runoff from multiple lower-order streams, amplifying discharge volume and increasing flood potential. Urban expansion in these areas often replaces permeable surfaces with impervious infrastructure, such as roads and buildings, thereby reducing natural infiltration and accelerating surface runoff. The combination of high stream order and urbanisation underscores the need for advanced flood management interventions, including improved stormwater drainage systems and nature-based solutions such as green roofs and permeable pavements. Western Auckland presents a complex drainage network with multiple third- and fourth-order streams. In urbanised zones, modifications to natural drainage pathways, such as channelisation and construction over floodplains, can exacerbate flooding.
In addition, the region’s steep terrain in certain areas may contribute to rapid runoff, further increasing flood risk. The convergence of these higher-order streams in urban environments necessitates adopting integrated water management approaches, such as retention basins, floodplain restoration and sustainable urban drainage systems (SUDS). Southern and eastern Auckland exhibit a mix of second and third-order streams, indicating a moderate flood risk. While lower-order streams typically contribute less to large-scale flooding, their influence can be significant in highly urbanised areas. These regions’ susceptibility to flooding largely depends on land-use patterns and infrastructure design in locations where urbanisation is rapidly expanding.
Furthermore, third-order streams suggest a transition to larger hydrological systems, meaning that these streams could act as feeders to higher-risk areas downstream. Implementing comprehensive land-use planning strategies, such as preserving natural waterways, enforcing flood-sensitive zoning regulations, and incorporating flood mitigation measures in new developments, can help mitigate potential risks in these areas. Previous studies, such as those by Council (2025a), identified central and northern Auckland as flood-prone zones, findings consistent with the high-risk areas identified in this study. These correlations strengthen confidence in the stream order-based model’s predictive validity.
5. Discussion
The stream order analysis highlights the complex relationship between urban development and flood susceptibility in Auckland, emphasising the importance of understanding stream order for effective urban flood management. Urbanisation can significantly influence the stream order system, which is critical for determining flood-prone areas. The role of stream orders in flood risk assessment is essential to deciding flood-prone areas. The hierarchical classification of streams provides a structured approach to understanding drainage dynamics and identifying flood-prone areas (Merovich et al., 2013). The results indicate that higher-order streams, particularly third- and fourth-order streams, are more susceptible to flooding because they accumulate water from lower-order streams. This finding aligns with Graf (1975), who noted that higher-order streams experience greater water accumulation, thereby increasing flood susceptibility. Similarly, Sanhouse-García et al. (2021) emphasised that integrating stream order into GIS-based flood modelling improves the identification of flood-prone areas. Urbanisation alters natural drainage patterns, increasing flood risks, and stream order analysis enhances hydrological modelling for effective flood mitigation. And further support this by demonstrating how stream order analysis enhances hydrological modelling for flood mitigation. One significant observation is the impact of urbanisation on stream network behaviour. In highly developed areas, natural drainage systems have been altered by land-use changes, including road networks, buildings and impervious surfaces. These modifications reduce natural infiltration, increasing surface runoff and flood risk.
In addition, artificial modifications to streams, such as culverting and channelisation, can disrupt natural water flow, exacerbating flood hazards. Climate change and extreme weather events further highlight the need for a resilient drainage network (Li et al., 2024). The changing precipitation patterns in Auckland necessitate adaptive flood management approaches that integrate natural hydrological processes with urban planning, similar to the findings of Sanhouse-García et al. (2021), who highlighted how urbanisation disrupts natural drainage patterns, increasing flood risks. Likewise, Wang et al. (2023) emphasised the importance of incorporating stream order analysis into hydrological modelling to enhance flood mitigation strategies and demonstrated that identifying critical drainage areas using stream order classification can improve urban resilience against extreme rainfall events. Stream restoration initiatives, the incorporation of green infrastructure, and the application of permeable surfaces can markedly augment the flood mitigation capabilities of a region (Pennino et al., 2016). An essential component of this discourse is the necessity for integrated flood management strategies. The identification of flood-prone areas, guided by stream-order analysis, provides critical data for urban planning and infrastructure development. Sustainable flood mitigation approaches, such as green infrastructure, permeable surfaces and wetland restoration, can strengthen the region’s resilience to flooding.
Moreover, it is imperative to incorporate climate change considerations into flood risk assessments. With evolving precipitation patterns and intensified storm events, higher-order streams may experience more severe flooding. Therefore, adaptive management strategies, including refined stormwater management systems and early warning frameworks, are crucial for mitigating potential flood risks. While this study provides a preliminary flood susceptibility assessment using a stream-order-based approach integrated with DEM and LULC data, it does not incorporate dynamic rainfall variability or future climate change projections. Flooding in urban environments is strongly influenced by temporal rainfall patterns and changing climatic conditions, which were beyond the scope of the present analysis. Future research could integrate high-resolution rainfall data sets and climate change projections to improve the predictive capability of flood susceptibility models. Incorporating these temporal and climatic factors would enhance the reliability of flood risk assessments and support more adaptive and real-time flood management strategies in urban Auckland. Such integration would complement the current terrain and land-use-based framework by accounting for temporal variability and climate-driven changes in hydrological processes. The analysis of stream order is a vital tool for evaluating flood risk in urban settings. These findings underscore the importance of proactive planning, sustainable land-use practices, and enhanced flood-mitigation strategies to ensure enduring resilience against flooding in the Auckland region. It is acknowledged that the practical utility of this model for municipal planning is constrained relative to Auckland Council’s official Flood Danger Rating framework, which classifies risk (Low, Moderate, High) at the property/cadastral scale based on peak water depth and velocity derived from hydraulic modelling. The present stream-order approach operates at catchment scale and does not resolve property-level hazard classification. Furthermore, pluvial flood extent is known to vary substantially with rainfall temporal profile (e.g. front-loaded versus back-loaded design storms), with published estimates indicating variation in flood-affected area of up to 25% for equivalent total rainfall depth. As a static, terrain-derived model, the present approach cannot represent this temporal variability. Accordingly, this method is best positioned as an early-stage, catchment-scale screening tool to help prioritise areas for more detailed, property-scale hydraulic assessment, rather than as a substitute for Council’s regulatory Flood Danger Rating framework.
5.1 Comparison with existing flood assessment methods
Several GIS-based flood assessment approaches have been widely applied in the literature, each with distinct strengths and limitations. Hydraulic and hydrodynamic models, such as HEC-RAS, are commonly used to simulate flood extent, depth and flow dynamics with high physical accuracy. These models are particularly valuable for detailed flood scenario analysis and infrastructure design (Kourgialas and Karatzas, 2011). However, they require extensive input data, including detailed channel cross-sections, discharge records and calibration data sets, and involve high computational and technical demands. As a result, their applicability is limited for rapid, city-wide flood screening, particularly in data-constrained environments.
Multi-Criteria Decision Analysis (MCDA) approaches, including the Analytical Hierarchy Process (AHP) and weighted overlay analysis, have also been widely employed for flood susceptibility mapping (Akhter et al., 2025). In a previous study conducted by the authors for the Auckland region, Annadi et al. (2025), an MCDA-based framework was successfully applied to integrate multiple flood-influencing factors, including topography, land use and hydrological parameters, to delineate flood-prone zones. While this approach provided valuable insights, it also highlighted inherent limitations in subjectively determined factor weighting. These characteristics can affect reproducibility and limit the ability to clearly represent underlying hydrological flow processes, particularly in complex urban drainage systems. It is acknowledged that a prior MCDA-AHP-based flood susceptibility framework applied to Auckland by the authors, incorporating seven spatial factors, achieved a reported accuracy of 82.98% (Annadi et al., 2025). The present study does not claim that the single-factor, terrain-derived Strahler approach exceeds or replaces the predictive accuracy of that multi-criteria framework. Rather, its scientific contribution lies in a different objective: isolating the specific, independent contribution of drainage network topology to flood susceptibility, free from the subjectively assigned expert weightings inherent to AHP-based multi-criteria methods. Because MCDA-AHP accuracy is influenced by the selection and relative weighting of its constituent factors decisions that are expert-dependent and not fully reproducible across studies or regions a purely terrain-driven method such as Strahler stream ordering offers a transparent, reproducible and data-minimal alternative particularly suited to data-scarce settings where the input factors required for MCDA (e.g. detailed soil, land-use and infrastructure layers) may not be available. The present study is therefore best understood not as a higher-accuracy replacement for MCDA-AHP modelling, but as a complementary, low-data, first-pass screening method appropriate for early-stage planning contexts or transferable application to less data-rich cities, with the trade-off in overall predictive accuracy being an explicit and acknowledged limitation. While Auckland possesses advanced LiDAR-based flood modelling and overland flow mapping systems, these high-resolution data sets are typically used for detailed regulatory and property-scale planning. In contrast, the stream-order-based approach presented in this study is designed as a macro-scale screening tool to identify broad hydrological patterns and potential flood-prone zones. This distinction clarifies that the method is not intended to replace existing council models but to complement them at an early-stage planning level or in contexts where detailed data sets are not available.
5.2 Justification for the selected method (stream order-based geographic information system approach)
This study employs a DEM-derived stream-order analysis using the Strahler classification method, integrated with flow accumulation and LULC data. Stream order analysis directly represents the hierarchical structure of drainage networks and captures the cumulative effects of upstream runoff, making it well-suited for identifying areas of increased flood susceptibility. The Strahler method is objective, reproducible and widely validated in hydrological research, while the use of freely available DEM and Landsat data sets ensures scalability and transferability across urban regions.
Unlike MCDA-based methods previously applied to Auckland, stream order classification is derived entirely from terrain-driven hydrological processes and does not depend on expert-assigned weights. This strengthens the analytical basis and enhances interpretability for urban planners and decision-makers. The approach is therefore particularly suitable for preliminary flood risk screening and for supporting planning-level flood resilience and climate adaptation strategies.
In addition to the methodological advantages described above, the results were also considered in relation to existing Auckland Council flood hazard mapping. While there is a general spatial agreement between the high-risk zones identified in this study and the flood-susceptible areas represented in council flood maps, the stream-order-based analysis provides an additional hydrological perspective by emphasising drainage connectivity and upstream runoff contribution. In particular, areas where multiple first- and second-order streams converge into higher-order channels show elevated flood susceptibility due to cumulative flow accumulation. These locations may not always be explicitly highlighted in traditional floodplain mapping, which often focuses on river overflow zones or historical inundation areas. Therefore, stream-order analysis can function as a complementary screening tool that assists planners in identifying potential flood-risk zones associated with urban drainage networks, particularly in rapidly urbanising catchments of Auckland.
5.3 Validation
The validation of the proposed stream-order-based flood susceptibility approach was conducted using indirect, yet robust, spatial comparison techniques widely adopted in data-limited flood risk studies where detailed hydrological observations are unavailable. Rather than relying on calibration against discharge or water depth measurements, this study employed spatial consistency, theoretical coherence and external evidence as complementary validation mechanisms. Firstly, the spatial distribution of high-risk zones identified from higher-order streams shows strong consistency with areas affected by the major Auckland flood events in January and February 2023. These extreme rainfall events resulted in widespread inundation across central and northern Auckland, which closely corresponds to the concentration of third- and fourth-order streams identified in this study. The coincidence between historically impacted locations and high stream-order zones provides empirical support for the method’s ability to capture areas of elevated flood susceptibility driven by runoff convergence. Secondly, validation was conducted by comparing the results with official flood-prone area information from the Auckland Council. Areas identified in this study as having high flood risk based on stream order hierarchy and flow accumulation exhibit strong spatial agreement with council-designated floodplains and at-risk zones. This alignment indicates that the stream-order–based method produces results consistent with authoritative flood assessments derived from more data-intensive modelling approaches, thereby reinforcing the reliability of the proposed framework. Thirdly, the results demonstrate strong theoretical consistency in hydrology. Established hydrological theory indicates that flood susceptibility increases with stream order due to the cumulative contribution of upstream catchments and increased discharge potential. The observed pattern in this study, in which higher-order streams in low-elevation, urbanised areas are associated with greater flood risk, aligns with foundational principles of drainage network behaviour and runoff accumulation. This theoretical coherence strengthens confidence that the results are not coincidental but grounded in well-understood hydrological processes. Finally, external validation was achieved by comparing with international case studies that applied similar stream-order–based approaches across diverse geographic contexts. Studies conducted in urban basins in Mexico (Sanhouse-García et al., 2021), Himachal Pradesh, Northern India (Kant et al., 2023) and DEM-based flood assessments in Egypt (El Bastawesy et al., 2021) report comparable relationships between higher stream orders and increased flood susceptibility. Although the specific thresholds vary depending on climate, terrain and land use, the underlying hydrological relationship remains consistent with the findings of this study. The convergence of results across different regions supports the broader applicability and transferability of the proposed method.
Overall, the triangulation of historical flood evidence, agreement with official flood mapping, theoretical hydrological principles, and consistency with international literature provides a robust validation framework for the proposed approach. While the method does not simulate flood depth or timing, it demonstrates strong capability as a preliminary flood susceptibility screening tool, suitable for urban planning, risk prioritisation and climate adaptation strategies in data-constrained environments.
5.3.1 Validation against Auckland council floodplain dataset source: authors own work.
To evaluate the performance of the stream-order-derived flood susceptibility classification, results were compared against the Auckland Council floodplain data set, the region’s official hydraulically modelled flood hazard layer (see Table 2). Both data sets were reclassified into binary susceptibility classes (0 = non-susceptible, 1 = susceptible) and cross-tabulated to generate a confusion matrix (see Table 3).
Validation Statistics
Critical Success Index (CSI):
False Alarm Ratio (FAR):
Cohen’s Kappa Coefficient:
where is the observed agreement between the stream-order classification and the Council floodplain data set, is the agreement expected by chance based on the marginal totals of both data sets, and Kappa is the chance-corrected measure of agreement. The CSI (0.022) and Kappa (0.030) values indicate limited direct pixel overlap between the two data sets, while FAR (0.890) reflects that many stream-order-classified susceptible pixels fall outside the Council’s mapped floodplain extent. Given the pronounced class imbalance in the study area, standard agreement metrics such as CSI and Kappa are known to understate genuine classification skill (Byrt et al., 1993). This is not indicative of an invalid classification but rather reflects a fundamental methodological distinction between the two approaches, with the stream-order method representing a topology-based proxy and the Council data set representing a fully hydraulically modelled floodplain product.
Specificity:
Odds Ratio:
The validation statistics summary is shown in Table 4.
While the confusion matrix indicates limited pixel-by-pixel overlap between the stream-order classification and the Council floodplain extent, this is expected and does not indicate the stream-order method is invalid. Flooding initiates at and immediately adjacent to stream channels before spreading laterally into the broader floodplain as rainfall continues and drainage capacity is exceeded. The stream-order method, by design, identifies these channel-proximal initiation zones the earliest and most consistent locations where flood susceptibility begins whereas the Council floodplain data set represents the fully developed flood extent after hydraulic and hydrological processes (rainfall-runoff, infrastructure capacity, overland flow) are accounted for. This is supported by the high Odds Ratio (3.63) and Specificity (0.993) obtained in this study, which show that stream-order-classified susceptible pixels are strongly and reliably associated with genuine flood-prone locations, even though the method does not capture the full lateral extent modelled by Council. The stream-order approach therefore serves as a valid early-stage/first-pass indicator of flood-susceptible zones useful for rapid, low-data-requirement screening rather than a replacement for the Council’s detailed hydraulic floodplain model.
6. Conclusion
This study effectively identified flood-prone areas in Auckland by integrating stream-order analysis with LULC classification. Regions with higher-order streams (third and fourth order) are more susceptible to flooding because they drain large catchments and serve as focal points for water accumulation. Central and northern Auckland, with a higher concentration of fourth-order streams, has a higher flood risk. At the same time, Western Auckland’s complex drainage system, shaped by urban development, may worsen flooding challenges. The LULC analysis highlights the impact of land cover on flood susceptibility. Areas dominated by impervious surfaces, such as urban settlements and developed regions, experience higher runoff, increasing flood vulnerability.
In contrast, forested and cultivated lands contribute to better water infiltration and reduced surface runoff. The correlation between land use patterns and stream networks underscores the importance of sustainable urban planning and flood mitigation. As noted in the literature review, global case studies (Bashir and Alsalman, 2024) consistently show that higher-order streams in low-elevation areas are among the most flood-prone. The evidence from Culiacán (Mexico) and Wadi Al-Lith, as well as DEM-based modelling in Egypt, provides strong external support for the patterns identified in this study. Although these studies use different numerical thresholds depending on local topography and climate, the underlying relationship that flood risk increases with stream order and decreases with elevation matches the findings here. This literature alignment strengthens confidence in the model results and underscores the importance of integrating stream order, elevation and land cover in flood risk assessment and urban planning. The results emphasise the importance of incorporating hydrological modelling and land-use management into flood resilience planning. Flood risk management strategies such as green infrastructure and drainage improvements may be prioritised in areas identified as potentially susceptible through this screening approach, in conjunction with detailed hydrodynamic modelling. Future research should integrate stream-order-based morphometric analysis with dynamic hydrodynamic models that incorporate rainfall temporal variability, stormwater network capacity, soil infiltration and climate change projections. This would help bridge the gap between catchment-scale screening and property-scale flood risk assessment required for urban planning.
6.1 Implications for flood resilience and mitigation
The recent severe flooding in Auckland, particularly the record-breaking rainfall in January 2023, has underscored the city’s vulnerability to extreme weather (11News, 2023). The floods resulted in significant damage to infrastructure, the displacement of residents and economic losses. In response, the Auckland Council has undertaken property risk assessments and recovery plans to address future flood risks (UNEP, 2023b). The increasing frequency and intensity of such events necessitate more proactive, data-driven approaches to flood risk assessment and mitigation. The findings of this research provide insights that can enhance flood management and response strategies in the region. This study provides a targeted approach to flood mitigation by identifying high-risk areas through stream-order analysis. Areas with higher-order streams, particularly fourth-order streams, are more susceptible to severe flooding. This knowledge can help prioritise areas for further detailed hydrological investigation and support early-stage spatial planning for flood risk management. These measures can improve drainage efficiency and reduce surface runoff when applied in conjunction with detailed hydraulic design and site-specific assessments.
A hybrid flood management approach combining traditional engineering solutions with ecosystem-based adaptation measures can enhance resilience in regions with complex drainage systems. Conventional flood control measures, such as levees and culverts, can complement nature-based solutions, such as wetland restoration, permeable pavements and green roofs. These hybrid approaches align with global best practices for sustainable flood management and can be integrated into Auckland’s existing flood response framework. The research emphasises the importance of proactive urban planning and sustainable development for areas with moderate flood risk. This research presents a stream-order-based approach as a preliminary catchment-scale screening tool for identifying potential flood-prone areas. While it supports early-stage spatial understanding of flood susceptibility, it is not intended to replace detailed hydraulic, or property-scale flood modelling used in official planning frameworks. While stream order analysis has been used in previous flood studies, this study’s unique contribution is its application to Auckland’s hydrological network by integrating high-resolution DEMs and LULC data. The distinctive value of this study lies in its application to Auckland’s hydrological network, providing a simplified terrain-based screening approach that complements existing flood hazard frameworks. Future research could incorporate higher-resolution data sets and real-time hydrological inputs to refine predictions and enhance decision-support systems.
The insights from this study align with the objectives of SDGs 11 and 13. SDG 11 (Sustainable Cities and Communities) emphasises the need for inclusive, safe, resilient and sustainable urban development (UNEP, 2023b). By integrating flood risk assessment into urban planning and implementing targeted flood mitigation strategies, this research supports efforts to create flood-resilient communities. Similarly, SDG 13 (Climate Action) calls for urgent measures to combat climate change and its impacts (UNEP, 2023a). Adopting hybrid flood management approaches and sustainable infrastructure aligns with SDG 13’s goals of strengthening climate resilience and integrating disaster risk reduction into planning processes. Using hydrological data in flood risk assessment enables data-driven decision-making, reducing vulnerabilities and minimising flood impacts. This research provides practical solutions for Auckland’s flood challenges and contributes to global efforts in sustainable disaster risk reduction and climate adaptation.
6.2 Limitations of the study
The study relies on Landsat 8 imagery with a 30-meter spatial resolution, which may not capture fine-scale urban features or localised drainage patterns. Higher-resolution data could enhance the accuracy of LULC classification and hydrological modelling. A related limitation concerns the runoff assumptions implied by the LULC classification in newly developed subdivisions. Because the 30 m LULC data set assigns land cover class based on spectral/vegetative signature, surfaces that appear vegetated (e.g. new turf or landscaping) are classified as low runoff “vegetated” or “grassland” cover. In practice, however, topsoil in many new residential developments is stripped and the underlying subsoil heavily compacted by construction machinery prior to landscaping, substantially reducing infiltration capacity. Such surfaces can generate runoff at rates approaching those of impervious surfaces despite their vegetated spectral appearance. As this sub-pixel soil compaction is not resolvable at 30 m resolution and is not captured by standard spectral LULC classification, the present model likely underestimates runoff generation, and consequently flood susceptibility, in newly urbanised subdivisions. Addressing this would require either finer-resolution LULC products capable of detecting construction-stage land disturbance, supplementary soil bulk-density or compaction survey data, or the use of development-stage-aware runoff coefficients (e.g. adjusted Curve Number values for post-construction compacted soils) rather than static land-cover-derived assumptions. As noted in the Methodology, higher-resolution data sets such as Sentinel-2 imagery or LiDAR-derived elevation data were not used in this study to preserve scalability across data-limited settings. Future studies could improve spatial accuracy by using such higher-resolution data sets, which can capture finer urban features and micro-topographic variations relevant to flood risk analysis. The DEM used for hydrological analysis may contain minor elevation inaccuracies, which could affect flow direction and accumulation calculations. While pre-processing steps were applied to improve accuracy, finer-resolution DEM data could yield more precise results. The study assumes that land-use patterns remain constant throughout the analysis period. However, urban development and land-use changes occur over time, influencing flood susceptibility. Future studies could integrate temporal analysis to account for dynamic land-use changes. This study does not include real-time rainfall data; its findings are based on spatial analysis rather than dynamic flood simulations. A key limitation of this study is that the stream-order-based method does not capture dynamic flood processes such as rainfall intensity patterns, stormwater pipe capacity, soil infiltration variability or temporal flood behaviour. In contrast, Auckland Council’s flood assessment framework operates at property-scale resolution using hydraulic variables such as flood depth, velocity and design storm scenarios. Therefore, the proposed model is not suitable for cadastral-level flood risk classification or regulatory flood mapping and should be interpreted as a supporting spatial screening tool rather than a decision-making model for site-level planning. Relatedly, the static nature of this model means it cannot capture the temporal dynamics of storm rainfall profiles, which can alter total flood-affected area by up to 25% for the same total rainfall depth depending on storm loading pattern, nor does it account for subsurface stormwater pipe network capacity, both of which are incorporated into Council’s Flood Danger Rating assessments. A specific physical limitation arising from the DEM pre-processing workflow concerns the treatment of Auckland’s volcanic crater landforms. The Fill tool used in this study, applied prior to D8 flow-direction computation, treats all closed topographic depressions as artefacts of DEM noise and fills them to enforce continuous, non-terminating overland flow paths to the catchment outlet. However, many volcanic craters and associated basalt lava-flow surfaces across the Auckland Volcanic Field are highly permeable and have historically functioned as natural soakage systems, with rainfall infiltrating directly into fractured basalt rather than generating sustained overland flow. By filling these depressions, the D8-based workflow artificially redirects this water into simulated surface flow paths that do not reflect actual local hydrological behaviour, meaning flood susceptibility in and around volcanic craters and basalt-soakage areas may be overestimated by the present model. This is a structural limitation of standard hydrological DEM-conditioning routines rather than an error specific to this study, and it highlights the need for geology-aware pre-processing for example, preserving depressions coincident with mapped volcanic soakage zones as terminal sinks rather than filling them, or excluding these zones from the derived overland-flow network using published Auckland volcanic field geology boundaries Future studies should utilise high-resolution LiDAR-derived DEMs and hydrodynamic models to improve representation of these processes. A further limitation concerns the relationship between the stream network extraction threshold used in this study and Auckland’s regulatory definition of overland flow paths. The stream network was extracted from the flow accumulation raster using a fixed upstream contributing-cell threshold, applied uniformly across the 30 m DEM. This differs conceptually from the Auckland Unitary Plan’s regulatory definition of overland flow paths, which are formally recognised where the contributing catchment exceeds 4,000 m2. Because the threshold applied in this study was selected to isolate hydrologically meaningful drainage channels for catchment-scale stream-order classification, rather than to replicate statutory flow-path criteria, the resulting network should not be interpreted as equivalent to Council’s regulatory overland flow path layer. Depending on the specific threshold applied, the extracted network may be either more extensive, capturing minor convergence zones below the regulatory catchment size, or more conservative, omitting some Council-recognised flow paths, than the statutory 4,000 m2 definition. This distinction is important for practical application: the stream-order network presented here functions as a catchment-scale hydrological screening tool reflecting terrain-driven flow convergence and is not intended for use in resource consent or building consent processes requiring compliance with the statutory overland flow path definition. Future refinement of this method could explicitly calibrate the extraction threshold to the 4,000 m2 regulatory catchment size to enable direct comparability with Auckland’s statutory flow path definition. While this study incorporates a formal quantitative validation against the Auckland Council floodplain data set, it should be noted that pixel-based confusion matrix approaches cannot fully capture spatial or boundary displacement between data sets. Future work could extend this validation using receiver operating characteristic (ROC) analysis or buffer-tolerance agreement methods.