The design and maintenance of neighbourhoods can influence lifestyles, social interactions and quality of life. Tāmaki Makaurau/Auckland’s urban form is marked by extensive urban sprawl and low-density residential-only zones. While a few studies have assessed liveability in selected Aotearoa/New Zealand’s neighbourhoods, studies that compare residents’ perceived liveability across different areas of Auckland remain limited. This study aims to examine urban liveability perceptions in various Auckland neighbourhoods to understand how the built environment and amenities impact residents’ quality of life.
A quantitative research methodology was used, collecting data from 164 residents through an online questionnaire distributed in eight Auckland suburbs. Results from the neighbourhoods of Massey, Mt. Eden, Northcote, Takanini and Saint Heliers are discussed in this paper, comparing areas distributed geographically across the territory which show significant contrasts. The data were analysed using descriptive and inferential (Kruskal–Wallis) statistics and discussed with information from spatial mapping.
Perceptions of liveability vary across neighbourhoods. The overall results show the highest perceived liveability in Mt. Eden and Saint Heliers, and the lowest in Takanini and Massey. Street type, age, disability and work routine also influence perception of liveability. Results align with social deprivation indexes, canopy cover, walking frequencies and proximity to the city centre: higher liveability levels were found in the least deprived and greener areas located closer to the city centre, where there are higher rates of walking.
This study highlights the social dimensions of liveability using residents’ perceptions with a holistic approach, including factors such as amenities, infrastructure, transport, safety and sense of community. The findings inform socioeconomic and built environment indicators of liveability, helping to create evidence-based policies and design practices for sustainable and well-connected future neighbourhoods.
1. Introduction
Rapid urbanisation, climate change and social disconnection are some of the challenges currently affecting cities globally, and it is crucial to prioritise the development of liveable urban environments that promote and support health and well-being (Higgs et al., 2019). It has been widely acknowledged that the design and structure of urban environments significantly influence health outcomes and well-being of residents (Badland et al., 2014). The physical and socio-cultural aspects of liveability are interconnected: the physical characteristics of a neighbourhood, including housing design and density, land use mix, and the availability of public spaces, can influence the opportunities for social interaction, thereby impacting the well-being of residents (Tiitu et al., 2023). Socially sustainable and liveable cities are key to improving well-being globally, with Sustainable Development Goal (SDG) 11 focusing on making cities and human settlements more inclusive, safe, resilient and sustainable worldwide (United Nations, 2015). Currently, most liveability indices are aggregated at the city level without reflecting spatial variation within cities and are often not aligned with policy or health indicators (Higgs et al., 2019). Mainstream liveability indexes, used to rank cities globally, often mask urban inequalities and make vulnerable populations invisible (Oviedo et al., 2022). International studies have revealed that cities ranked among the world’s most liveable share extreme disparities in socio-spatial contrasts (Kadi et al., 2022; Sarkar et al., 2024).
This study investigates perceptions of liveability in Tāmaki Makaurau/Auckland, New Zealand, a multicultural city housing circa 1.5 million inhabitants. The city is often included among the top rankings of the world’s most liveable cities (Economist Intelligence, 2023; Mercer, 2023). Despite these rankings, there are significant contrasts in perceptions and experiences of liveability across different neighbourhoods in this city, along with issues of socio-spatial inequality, particularly in Western and Southern suburbs, which have lower socio-economic levels (McMillan, 2024). Auckland’s urban form is marked by extensive urban sprawl, and there are many areas dedicated exclusively to residential low-density land use, with a lack of mixed-use areas and access to essential local amenities. There is growing evidence that lower residential densities with reduced street connectivity, singular land uses, poor access to public open space and public transport infrastructure and unavailability of shops and services have been negatively associated with adverse health outcomes (Badland et al., 2014).
The current lack of available and affordable housing has led to densification strategies in the city, and this is transforming Auckland’s neighbourhoods. Changes to policies were made over the years to encourage an increase in housing density throughout Aotearoa New Zealand. In some areas, these rapid changes conflict with the need for establishing the types of infrastructures that would offer higher levels of liveability for residents. There is recognition that “the role of public spaces and associated amenities of the neighbourhood (such as parks, shops, schools and so on) take on increasing significance as density increases” (Allen et al., 2018, p. 3). Current urban planning strategies in Auckland and other major New Zealand cities focus on preventing sprawl and concentrating growth near transit centres, with many policies highlighting the potential benefits of compact development through enhanced urban liveability and good urban design outcomes (Beattie and Haarhoff, 2018). The central objective of the Auckland Plan 2050 is to make it “the world’s most liveable city” (Auckland Council, 2015). However, how this goal will be measured remains unclear, as few indicators assess Aucklanders’ perceptions of community and spatial aspects of the built environment. The proposed indicators to benchmark Auckland’s urban liveability do not address the role of the built environment comprehensively, despite an increasing urban intensification to allocate a growing population; balancing benefits and impacts of density on liveability is challenging due to the subjective aspects involved (Schindler and Dionisio, 2024).
There are few studies assessing the quality of life in Auckland’s neighbourhoods from residents’ perspectives to verify if policies are leading to good urban design outcomes and enhanced liveability in practice. Prior research assessed liveability from residents’ points of view in a few selected neighbourhoods in Auckland, including a comprehensive Post-Occupancy Evaluation of Hobsonville Point and a Master Thesis evaluating liveability in Auckland’s city centre (Howard, 2008). The research in Hobsonville Point, developed as part of the National Science Challenge 11, assessed residents’ perceptions through an online questionnaire and focus groups, asking about levels of satisfaction with dwellings, with the wider neighbourhood, and the extent to which residents perceived a sense of community. The findings highlighted the key role that high-quality public spaces and amenities play in housing satisfaction and liveability perceptions. In Hobsonville, 72% of respondents agreed with the statement: “I feel like I belong to this community”, and 82% agreed with the statement “I believe my neighbours would help me in an emergency”. These responses signify strong bonds that underpin a sense of community, even though many neighbours have not known each other for very long in this new neighbourhood. A 57% agreed that “I can recognise most of the people who live on my street”. Sense of community was a key component of satisfaction for a number of focus group participants in Hobsonville. However, as this study was based only in one neighbourhood, it was not possible to make significant comparisons with other areas in Auckland. The research by Howard (2008) investigated the liveability of Auckland’s city centre through a resident-focused lens, using postal surveys and professional interviews to assess five key dimensions: public spaces, walkability, safety, mixed use and access to services. Findings revealed that residents generally perceived the city centre as liveable, with walkability standing out as a particular strength. The study highlighted which aspects matter most to residents-such as proximity to daily needs-and how these factors influence their behaviours, especially regarding safety.
Other local studies have assessed liveability through mapping and other methods, without directly involving residents as participants. (Jiang et al., 2024a, 2024b) assessed liveability in the suburbs of Onehunga and Remuera through network analysis and GIS mapping with a focus on proximity-based planning, without exploring residents’ perceptions. In this study, “liveable areas” were defined as areas with overlap coverage of all six essential services within a 15-min walk. The analysis involved a horizontal comparison of essential service coverage and a longitudinal analysis of the impacts of essential service coverage, both collectively and individually, within both neighbourhoods. Findings suggested that the proximity to retail, health care and leisure facilities needs urgent improvements. Noted issues included excessive big-box retail growth, uneven health care distribution and private, non-everyday access to natural resources. This study was limited to two Auckland neighbourhoods and relied solely on mapping techniques. It did not incorporate resident engagement to capture community perceptions, nor did it evaluate the quality of the built environment, including streetscape features and other relevant aspects. A recent article by (Magnuszewski et al., 2025) proposed the Auckland Urban Liveability Index (AULI): a mechanism for quantifying and evaluating modern urban densification. The index defines liveability through 29 variables organised into five components: social infrastructure, transportation, green space, safety and culture. These components are aggregated to neighbourhood-level spatial units. The authors stated that their study was the first to estimate modern liveability in a large-scale way for a city in New Zealand (Magnuszewski et al., 2025). However, the study did not engage with residents directly and only measured liveability through quantitative approaches, considering proximity to amenities and services. This type of assessment might miss important aspects such as the quality of the built environment design or the quality of streetscapes, for example. The index relied on international understandings of urban liveability such as 15-min concepts, without engaging with Auckland’s population to ask what they perceive as a liveable environment.
Therefore, there are no previous studies comparing residents’ perceived liveability in different areas of Auckland and how built environments could be enhanced to ensure that all neighbourhoods enable a good quality of life for their inhabitants. In this article, we report the results of an online survey that investigates residents’ perceptions on liveability levels across different areas of Auckland. The goal of this study is to begin the identification of key differences in residents’ perceptions of liveability, to understand how the built environment and neighbourhood amenities impact the quality of life for residents in Auckland, and to consider what improvements are needed to deliver socially and environmentally sustainable future neighbourhoods throughout Aotearoa New Zealand.
2. Urban liveability definitions and measurements
Urban liveability is a growing interdisciplinary concept spanning across urban planning, public health and social sciences research, and it is closely related to notions such as quality of life and well-being. There are many different definitions and conceptualisations of liveability and little consensus about its measurement in the literature (Dsouza et al., 2023). Liveability is defined by some authors as the capacity of a place and its systems to consistently meet basic human needs, offer opportunities for cultural and artistic expression, and cultivate a sense of community, while emphasising social inclusivity, safety, sustainability and opportunity (Badland et al., 2014; Dsouza et al., 2023). Other definitions of urban liveability refer to perceptions regarding the quality of life in a human living environment (Kashef, 2016), or the ability of cities to fulfil expectations of their inhabitants for well-being and quality of life (Martino et al., 2021). Perceptions of liveability can also relate to residents’ wishes to remain in their neighbourhoods in the long term: “Liveability reflects the well-being of a community and represents the many characteristics that make a location a place where people want to live now and in the future.” (Victorian Competition and Efficiency Commission, 2008, p. 4). Following a literature review, Lowe et al. developed a comprehensive definition of urban liveability as being communities that are “safe, attractive, socially cohesive and inclusive, and environmentally sustainable; with affordable and diverse housing linked by convenient public transport, walking and cycling infrastructure to employment, education, public open space, local shops, health and community services, and leisure and cultural opportunities” (Lowe et al., 2015, p. 138).
In Aotearoa New Zealand, there is also little consensus on liveability definitions. The New Zealand index of socioeconomic deprivation draws on indicators across eight domains including communication (internet and telecommunication access), income and education, as well as dwelling conditions and home ownership. A socioeconomic deprivation decile is calculated for each statistical area, and the higher the deprivation decile, the more socioeconomically deprived the area. The index provides some indication of structural barriers to quality of life. A current definition of liveability by the NZ Ministry of Transport states: Liveability refers to the environmental and social quality of an area as perceived by residents, employees, customers and visitors. This includes safety and health (traffic safety, personal security and public health), local environmental conditions (cleanliness, noise and air quality), the quality of social interactions (neighbourliness, fairness, respect, community identity and pride), opportunities for recreation and entertainment, aesthetics and existence of unique cultural and environmental resources (e.g. historic structures, mature trees and traditional architectural styles) (Kotahi Transport Agency, W.N 2020).
Urban liveability can be assessed with objective and subjective indicators and at different spatial scales (Mouratidis and Yiannakou, 2022). Although various methods are used to assess liveability worldwide, scholars agree that using both spatial and perception-based measures in a complementary fashion is the most accurate way to describe liveability in a certain area (Dsouza et al., 2023). Some of the themes commonly investigated in urban liveability research internationally are walkability, sense of community, perceptions of safety and provision of green space. In urban design literature, the idea of creating walkable neighbourhoods well-served by local amenities such as libraries, cafes, shops, community centres and public green spaces is understood to contribute to urban vitality, social interaction, and a sense of community (Kashef, 2016). According to Mouratidis and Yiannakou, common determinants of neighbourhood satisfaction include proximity to city centres, perceived safety, place attachment, perceived quietness and social cohesion (Mouratidis and Yiannakou, 2022). A literature review by Badland et al. identified 11 distinct domains considered to be important components of liveability, and likely to contribute to health and well-being: natural environment; crime and safety; education; employment and income; health and social services; housing; leisure and culture; local food and other goods; public open space; transport and social cohesion and local democracy (Badland et al., 2014). The Victorian Competition and Efficiency Commission (2008) from Australia proposed a list of liveability indicators to be evaluated individually against objective and subjective criteria: safety, sense of community, cultural diversity, access to services, connectivity (through ICT), transport and housing affordability. Namazi-Rad et al. (2012) developed an empirical model in Sydney, based on subjective ranking and evaluation of six environmental factors to six factors related to people’s living conditions: home, neighbourhood, transport, entertainment, services and work. Lowe et al. (2020) analysed seven policy domains relevant to urban liveability: walkability, transit access, public open space, housing affordability, employment, food environments and alcohol environments. A literature review on liveability by Lowe et al. (2015) revealed that the four most frequently mentioned indicators were crime and safety, transport, housing and employment and income, which are fundamental to health and well-being. Other indicators identified in the review were: natural environment, education, health and social services, leisure and culture, food and other goods, public open space, social cohesion and local democracy.
According to Dsouza et al. (2023), some of the main challenges of liveability assessments are the trade-offs between context-specific measurements and the transferability or replicability of liveability measures to other areas. Given the uniqueness of cities and their social, cultural and environmental contexts, there is less agreement with liveability measurement approaches globally. Improved measurement frameworks and standardised approaches are needed to increase understanding of liveability’s influence on well-being and to facilitate comparisons across contexts (Dsouza et al., 2023). Other authors reinforce the idea that the links between neighbourhood characteristics and liveability depend on the local context related to local culture, attitudes and preferences (Mouratidis and Yiannakou, 2022). Tiitu et al. (2023) highlight the importance of understanding liveability levels in neighbourhoods with low socio-economic status, as less affluent groups are more often affected by inadequate housing conditions or adverse environmental effects in their residential neighbourhoods, such as poor air quality or high noise levels. When improving liveability, it is crucial to consider which neighbourhood attributes residents value in their living environments, as people’s preferences vary according to their sociodemographic and cultural backgrounds, as well as their individual perceptions, values and lifestyles (Tiitu et al., 2023).
Another international tool is the Quality of Life Initiative, released in 2024 by UN-Habitat. It aims to create a comprehensive framework for cities to assess and improve the quality of life for all inhabitants. Their Quality of Life Index is an innovative tool to help policymakers and urban planners gain new insights and guidance. Its novel structure incorporates a “compulsory global layer that captures universal aspects of quality of life and a local layer defined by the city itself, equips each city with their own bespoke index tailored to local values, priorities and cultural and contextual nuances” (UN-Habitat, 2024). The Quality of Life Index includes indicators across nine essential quality of life domains to guide and evaluate community priorities and actions: basic services and mobility, culture and recreation, economy, education, environment, governance, health, housing and social cohesion. This is a promising initiative to create a standardised way to measure liveability and quality of life in different cities while also considering unique local aspects, such as indigenous perspectives on well-being. However, this framework was released after the completion of the data collection stage for this study.
In the context of liveability assessments, the concept of Post-Occupancy Evaluation (POE) is also relevant. POE is a type of evaluation utilised to confirm the actual performance of the built environment, including quantitative and qualitative data. POEs are commonly used in the building scale, and there are limited examples of POEs in large scale, including communities, cities and regions (Boarin et al., 2018). Previous research carried out a comprehensive POE in Hobsonville Point in Auckland which focused on residents’ perceptions on sustainability and liveability in the neighbourhood (Haarhoff and Boarin, 2022). This prior study serves as the basis for the development of our assessment of residents’ perceptions of liveability, considering the lack of standardised international or local methods for assessing liveability in neighbourhoods at the time our study was carried out. The survey at Hobsonville Point included questions about (A) the dwelling, (B) the neighbourhood and (C) sense of community; this study adapts questions from points B and C of their survey. Another notable local measure of liveability is the Auckland Urban Liveability Index (AULI) proposed by Magnuszewski et al. (2025). Even though our research had been finalised before the publication of this paper, our study generally aligns with the same themes of social infrastructure, transportation, green space, safety and culture.
In summary, due to the absence of an official measure of urban liveability in Auckland at the time the research was carried out, the theoretical framework for this study is grounded in both international and local understandings of this concept. According to the reviewed literature, the themes of transport options, social cohesion, green spaces and amenities and sense of safety are understood to be of value to residents locally and internationally. To develop a deeper, more nuanced assessment of liveability, consideration of the lived experience of urban residents is critical. This research forwards the identification of factors that affect the perceived liveability at a neighbourhood scale; a scale that intersects everyday life with wider municipal, infrastructural, and economic forces. The study aims to understand if and how perceived liveability varies across different urban neighbourhoods in Tāmaki Makaurau Auckland, as well as the factors that influence levels of perceived liveability.
3. Methodology
3.1 Study design
Capturing the potential variation of perceptions of liveability across neighbourhoods in the same city requires the application of a standardised approach that allows comparison to take place. This study used a cross-sectional survey design to examine perceptions of liveability across selected neighbourhoods across Tāmaki Makaurau Auckland. The approach captures variations at a specific point in time and so is appropriate for assessing spatial differences in attitudes and experiences. Five neighbourhoods were selected based on their varying formas and contexts. The survey targeted adult residents living within these neighbourhoods and also collected demographic characteristics, daily routines as well as responses to 18 Likert-scale questions related to liveability dimensions and open-ended questions about the future of the neighbourhood. The questionnaire approach for data collection is reproducible and structured by simple questions that are accessible for a range of respondents. The design supports both descriptive assessment of the neighbourhoods and inferential analysis (Kruskal–Wallis) of group differences.
3.2 Questionnaire design
The framing of questions is based on findings from a literature review which followed a narrative approach and included definitions and measurements of urban liveability in New Zealand and globally. Searches were conducted in Web of Science, Scopus and Google Scholar to identify key references on this theme. Keywords searched included “urban liveability”, “liveability assessment(s)” and “urban quality of life”. From this an online questionnaire was developed to captures resident’s perception of urban liveability. As there is no standard definition, questionnaire or measurement of liveability in New Zealand’s context, the development of questions for the online survey was based on findings from a previous literature review on post-occupancy evaluation of neighbourhoods(Boarin et al., 2018), and research that applied a comprehensive post-occupancy evaluation in the neighbourhood of Hobsonville in Auckland (Haarhoff and Boarin, 2022). The themes covered in the questionnaire were in line with international literature on liveability and included sense of community and social connection, transport modes, local amenities and third places, green space and environmental factors, and perceptions of safety.
The questionnaire methodology was reviewed and approved by [Auckland University of Technology Ethics Committee] in March 2024, approval number [24/16]. Participation was voluntary and anonymous, with informed consent obtained from all respondents. This study, developed by the [Future Neighbourhoods Master Lab], was integrated into the initial stages of Master of Architecture (Professional) theses research, and the results from the questionnaire informed architectural and urban design propositions to improve these areas.
The questionnaire consisted of three sections. The first section included general demographic information of the respondent, including age, gender, disabilities, as well as work and travel routines. The second section comprised 18 Likert-scale questions that address perceptions of liveability directly. Responses were positively framed and measured on a five-point scale ranging from “Strongly disagree” to “Strongly agree” so that mean scores for a respondent would constitute an overall metric for perceived liveability. The third section contained opinion-based open-ended questions to gather information about challenges and the future of the neighbourhood.
The following 18 statements were selected for the second section of the questionnaire:
I feel like I belong in this community.
I believe my neighbours would help me in an emergency.
I often have friends from the neighbourhood over to see me.
I plan to stay a resident of this community for a while to come.
I can recognise most of the people who live on my street.
I feel safe walking alone in my neighbourhood during the day.
I feel safe walking alone in my neighbourhood after dark.
The design and condition of footpaths and pedestrian road crossings is good.
When walking, I feel safe from fast-moving vehicles.
There is a distinct neighbourhood identity.
There is a good amount of greenery within my neighbourhood.
There are well-maintained streets, parks and community facilities.
There is housing for a range of income levels within the neighbourhood.
There is public transport within a 10-minute walk from my home.
I am able to easily satisfy most of my daily needs within a 15-minute walk from home.
The increase of residential developments and densification within my neighbourhood is positive.
There is good infrastructure for cycling within my neighbourhood.
My neighbourhood is well prepared for the impacts of climate change (e.g. storms, floods).
3.3 Study area and sampling
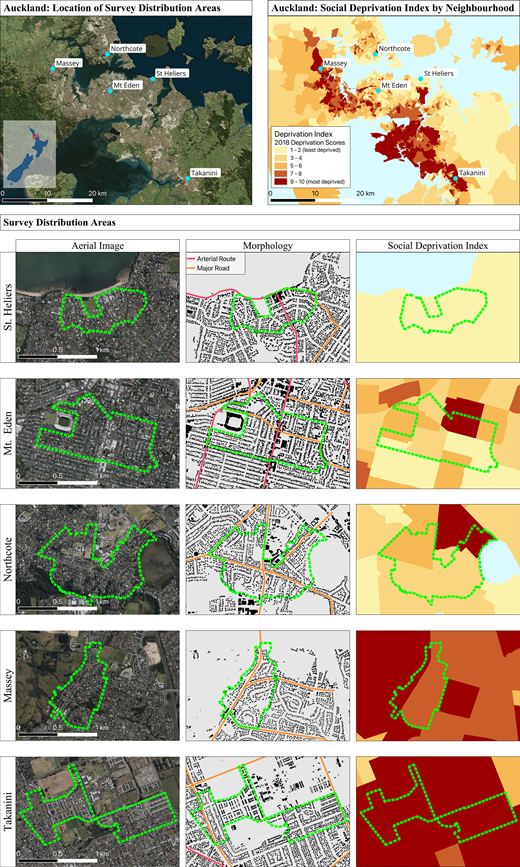
Five neighbourhoods with varying attributes from across the city were selected from the initial eight areas for this study. Mapping the selected neighbourhoods aimed to identify key aspects such as urban morphology, presence of amenities and green space, land use and deprivation indices. Data from a variety of sources including Auckland City Council Open Database, Land Information New Zealand (LINZ) and Statistics New Zealand were collated in a GIS.
The study used a non-probability, self-selection sampling method within a defined geographic scope. The online questionnaire was distributed in April–May 2024 to residents of the selected neighbourhoods via:
Postal drop invitation with link and QR code: 2321 printed invitations were distributed in eight neighbourhoods. These were dropped in every dwelling in the assigned areas of the selected neighbourhoods, without excluding any houses.
Posters with QR codes in public facilities: Four posters were displayed where space in public facilities, such as libraries, were available.
Social media posts: Nine posts were shared in community Facebook groups and location-based Instagram advertisements were run.
The online platform Qualtrics was selected to host the questionnaire, as it is the University’s preferred platform, ensures secure data storage, and it provides a user-friendly interface, suitable for diverse respondents. Participation was voluntary. This approach constitutes a self-selection sampling technique, where respondents opted in based on personal interest. While efficient for capturing community perceptions, this method may introduce self-selection bias, as participants may differ systematically from non-respondents. The questionnaire was anonymous; however, it collected information such as age range, gender, employment status and approximate location of residence, indicated on a map. The sample size was determined by available resources and response rates, rather than statistical power calculations.
Figure 1 shows the location of the surveyed neighbourhoods in Tāmaki Makaurau Auckland including aerial imagery, urban morphology maps and social deprivation index maps. Table 1 gives a general description of the neighbourhoods. The survey was initially distributed in selected areas within the following eight suburbs: Henderson, Massey, Mt. Eden, New Lynn, Northcote, Takanini, Piha and Saint Heliers. The scope of this contribution is limited to reporting the main results from five selected neighbourhoods: Massey, Mt. Eden, Northcote, Takanini and Saint Heliers. These local areas represent West, Central, North, South and East Auckland, respectively, enabling an assessment of the city’s suburbs distributed geographically across its territory. There are differences in the quality of public amenities and infrastructure available in each neighbourhood, and different levels of social deprivation in each area, ranging from 1 (least deprived) to 10 (most deprived).
The selected neighbourhoods reflect the diversity of Auckland’s built environments. Saint Heliers is a seaside suburb known for its beaches and community village including various cafés, grocery stores and other amenities. It is located approximately 9 km away from Auckland’s City Centre. The survey was distributed in the central areas of Saint Heliers, which has various housing types, such as apartments, terrace houses and detached houses. Mt. Eden is a well-established suburb located approximately 3 km away from Auckland’s CBD, and developed around the volcanic cone of Maungawhau (Mt. Eden). It features a mix of Victorian villas and bungalows, with a strong emphasis on heritage conservation. The area is known for its vibrant community, local shops, schools and proximity to various public transport options. Northcote is a diverse suburb with a mix of residential, commercial and industrial areas. The area where the survey was distributed shows a predominance of detached single-family homes. The suburb is located approximately 6 km away from the city centre and is connected to it via Auckland’s Harbour Bridge. Massey is a growing suburban area with a prevalence of single-family detached homes and some newer greenfield housing developments. This suburb is located approximately 18 km away from Auckland’s CBD and features large parks and reserves, as well as farmland at its borders. Takanini is a rapidly growing suburb with a mix of residential, big-box retail and industrial areas. The area where the survey was distributed features older residential zones with detached housing, as well as new master planned greenfield developments where terrace housing prevails. The suburb is 28 km away from the CBD, and is well-connected to the city via trains and bus routes.
3.4 Data preparation and analysis methods
Data were screened prior to analysis to ensure consistency. Responses that did not fully complete the 18 liveability questions and the demographic questions were removed. All Likert-scale questions were coded numerically from 1 (“Strongly disagree”) to 5 (“Strongly agree”). All demographic variables were standardised into a categorical format. Where a category yielded a small number of responses and was conceptually similar to an adjacent category, they were merged. This was done to ensure appropriate group sizes for the Kruskal–Wallis tests.
Descriptive statistics were first generated to summarise the sample characteristics and provide an overview of responses to the liveability items. For the Likert-scale variables, medians and interquartile ranges (IQRs) were calculated, and distribution patterns were visualised using boxplots to allow comparison across neighbourhoods.
Because the Likert items are ordinal and preliminary checks indicated non-normal distributions, non-parametric tests were used for between-group comparisons. Differences in responses across neighbourhoods were assessed using the Kruskal–Wallis H test. For any tests that yielded statistically significant results, pairwise comparisons were conducted using Dunn’s test with a False Recovery Rate (FDR) procedure (Benjamini–Hochberg correction). In addition to test for the significance of the neighbourhood a respondent belonged to tests were also carried out on all other categories. All analyses were performed using Python SciPy 1.16.2. and scikit-posthocs 0.7.0.
4. Results and findings
A total of 182 responses were collected through the online questionnaire across all neighbourhoods, of which 164 were complete and valid, giving a response rate for postal invitations of 7.1% (Table 2).
4.1 Sample characteristics
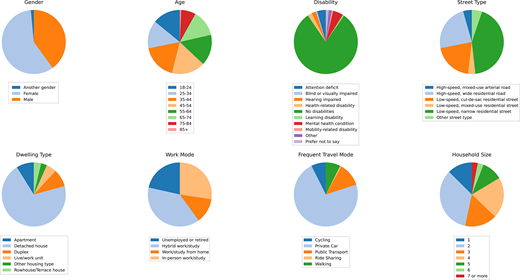
Descriptive statistics are presented below to explain the demographic composition of the respondents. Variables include generalised individual information such as gender and age as well as environmental contextual information such as household size, dwelling type, street type and main mode of transportation.
The distribution of responses is shown in Figure 2. Age distribution is balanced; most respondents were aged 35–64 (50%), followed by 18–34 years (28%) and 65 years and older (22%). Slightly more women (57%) than men (48%) completed the survey. In total, 22% of respondents reported having some form of disability or chronic health condition. The most common working/study style is hybrid (39%) followed by in-person work/study (27%), while 21% of respondents are retired or unemployed.
The majority of respondents live in detached houses (70%) and use private cars (73%) as the main mode of transport. In total, 63% of respondents reported living on quiet residential streets (43% low-speed residential street, 20% cul-de-sac residential street) and 29% on busy roads (24% residential road, 5% arterial road).
The most common mode of transportation is private car. Mt. Eden has the highest use of public transportation (mean score = 1.95) and both St. Heliers and Mt. Eden have high levels of walking (2.67 and 2.57, respectively) (Table 3).
4.2 Descriptive findings
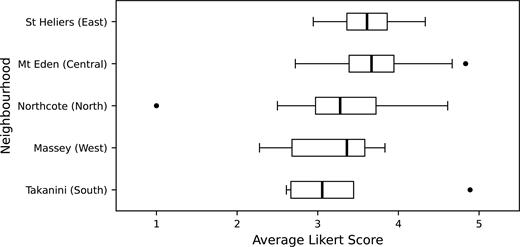
The 18 questions related to perceived liveability were measured on a five-point Likert-scale ranging from 1 (“Strongly disagree”) to 5 (“Strongly agree”). All items were framed positively, allowing the mean of the 18 responses to be interpreted as an individual’s overall perception of neighbourhood liveability. Figure 3 presents the distribution of these mean scores across neighbourhoods. Neighbourhoods are ordered by levels of social deprivation, from St Heliers (low deprivation) to Takanini (high deprivation). The mean scores generally follow the social deprivation scores although Mt Eden has a higher mean score than St Heliers. Takanini has the lowest mean score.
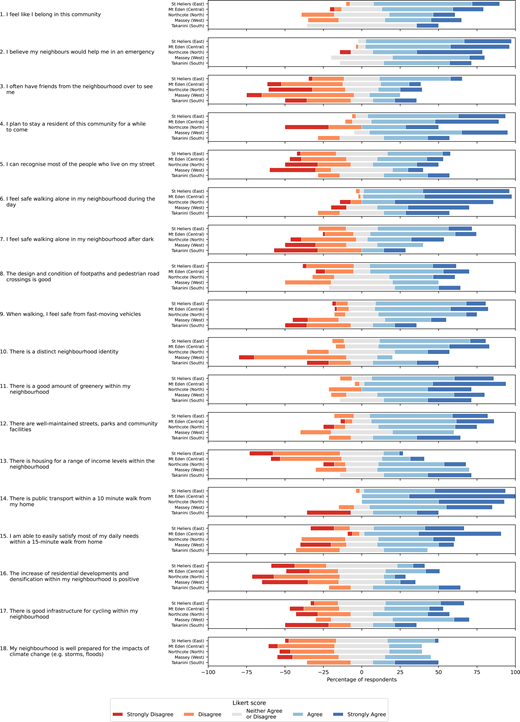
Figure 4 displays the distribution of responses for each of the 18 items by neighbourhood. The results are discussed in the following sections, organised according to the main themes examined.
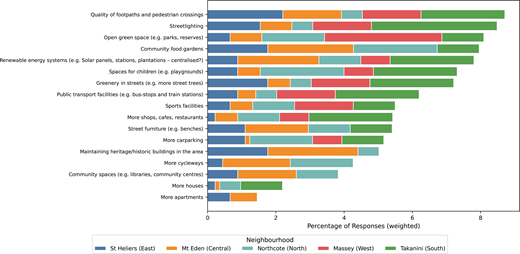
Residents were asked about their future vision for their neighbourhoods and to suggest improvements they would like to see implemented. One of the multiple-choice questions asked “What are some things that you would like to improve in your neighbourhood? Select the top three items that you would like to improve in your area.” (Figure 5). The top three ranked selections were quality of footpaths and pedestrian crossings, streetlighting and parks. In general, outdoor natural amenity items such as parks and food gardens, score higher than built infrastructure such as shops and community spaces. These results, from residents of all neighbourhoods surveyed, highlight that people truly value improvements to pedestrian infrastructure to make walking safer and enjoyable in Auckland.
4.3 Variations in perceptions of liveability across Tāmaki Makaurau, Auckland
To examine whether responses varied significantly between the selected neighbourhoods, non-parametric statistical tests were used. Given the ordinal nature of the nature of the Likert-scale items and the relatively unequal size of the sample sizes Kruskal–Wallis H-test was seen as an appropriate method. In addition to test for the significance of the neighbourhood a respondent belonged to tests were also carried out on all other categories. The analysis indicated significant differences for several items, suggesting that resident’s perceptions of urban liveability vary by neighbourhood (Table 4).
For example, perceived social attachment questions (Q1 – Q5) varied significantly for four items, as did Neighbourhood identity (Q10) (H = 24.476, p = 0.0001). Post-hoc pairwise comparisons using Dunn’s test with false discovery rate (FDR) correction revealed that both St. Heliers (East) and Mt. Eden (Central) residents report significantly higher scores that Massey (West). Similarly, convenience questions (Q14: Access to Public Transport and Q15: Daily Needs Within 15 mins.) are significantly higher for Mt. Eden (Central) than most other areas. St. Heliers, an older established suburb, reports higher scores for Q13: Housing Diversity than Massey (West) and Northcote (East), two areas that are undergoing recent and rapid urban densification.
Tests were also carried out for all other demographic categories. Statistically Significant scores were reported for Street Type (Q2: Neighbour Help in Emergency, Q8: Good Pedestrian Infrastructure, Q11: Neighbourhood Greenery). Age reported significant scores for Social Attachment questions (Q2-Q4), Neighbourhood Identity (Q10) and Convenience (Q14, Q15).
Disability also reported significantly high scores for Mt. Eden (Central) or St. Heliers (East) for Q14: Access To Public Transport and Q15: Daily Needs within 15 mins. suggesting that St. Heliers low social deprivation score and higher perceived liveability scores does not necessarily extend to residents with disabilities.
For Work Routine respondents who work or study from home report lower scores for Q11: Neighbourhood Greenery than all other work types including those who work in-person.
These results highlight that differences in liveability perceptions are not uniform across the study areas, providing empirical support for subsequent discussion of neighbourhood-specific patterns and potential contextual factors influencing residents’ experiences.
5. Discussion
The results of this study demonstrate that residents’ perceptions of urban liveability vary meaningfully across neighbourhoods and demographic groups. Social attachment and neighbourhood identity were rated higher in established areas such as St. Heliers (East) and Mt. Eden (Central) compared with rapidly densifying suburbs like Massey (West) and Takanini (South), suggesting that long-standing social networks and familiarity with the local environment could contribute to perceived liveability. Similarly, convenience measures - including access to public transport and daily necessities within 15 minutes – were higher in Mt. Eden (Central), reflecting the benefits of its central location and dense amenity.
Differences were not limited to spatial context; demographic factors further shaped perceptions. Age influenced social attachment, neighbourhood identity and convenience ratings, while street type influences perceptions of neighbourly support, pedestrian infrastructure and greenery. Notably, residents with disabilities reported lower convenience scores in areas that otherwise scored highly on liveability, indicating that certain groups may experience the urban environment differently. Work routine similarly impacted perceptions, with home-based workers reporting lower satisfaction with neighbourhood greenery compared to those working on-site.
5.1 Transport choices and liveability
It is widely acknowledged that built environments that encourage the use of active and public transport can enhance people’s physical and mental health, as well as provide significant environmental benefits (Rees et al., 2020). Physical neighbourhood features that encourage walkability lead to increased urban vibrancy and are beneficial for human well-being (Jan Gehl, 2009; Jane Jacobs, 1961; Lehmann, 2016; Tiitu et al., 2023). The questionnaire linked positive perceptions of walkability in neighbourhoods and higher availability of public transport options with higher perceived liveability.
Survey results indicated that residents’ perceptions of walkability and public transport availability were closely linked to their overall sense of liveability. While all neighbourhoods reported similar scores for the condition of footpaths and crossings (Q10), there were strong differences in perceived safety from fast-moving vehicles (Q11) access to public transport (Q14) as well as cycling infrastructure (Q15) where Takinini (South) scored lower. This suggests that in developing areas such as Takanini (Souh) connectivity to different modes of transportation as well as consideration of the adjacency of vehicles and pedestrians is important. And second, that destinations for pedestrian trips [ability to meet daily needs (Q15)] is an integral part of a walkability framework. This holistic approach to walkability (connectivity and adjacency, destinations) is also present in other areas. In the open-ended questions one respondent in St. Heliers noted that there is a need for “speed restrictions for motorbikes and cars roaring up [residential] hill roads from the beach”.
These perceptions were mirrored in reported transport behaviour. Car use remains prevalent across most neighbourhoods, particularly in Massey (West), highlighting Auckland’s car-dependent suburban form. Walking was most common in St. Heliers, while cycling was reported more frequently in Northcote, reflecting local infrastructure and urban form differences. Overall, the findings suggest that the presence and quality of active and public transport options strongly shape both perceptions of liveability and residents’ mobility patterns, reinforcing the importance of designing neighbourhoods that support multiple transport modes. It is also important here to note that tests for significance suggest that age and disability also affect responses to questions on access to public transport and daily needs and therefore perceptions of liveability are not equal within neighbourhoods.
5.2 Social cohesion, amenities and third places
Social cohesion refers to the extent of connectedness and solidarity among groups in society, including the idea of ‘neighbourliness’: good relationships between neighbours (Mouratidis and Yiannakou, 2022). Urban design promoting social interaction and safety generally contributes to happier neighbourhoods. In this context, opportunities for social connection can also be found in “third places”. As discussed by Oldenburg and Brissett (1982), the concept of the third place refers to participation of urban citizens in spaces beyond the home and office (Oldenburg and Brissett, 1982a). The authors cite the writing of Addison (1965) and Wechsberg (1966) that make reference to the coffee houses that have proliferated in London and Vienna since the eighteenth century (Oldenburg and Brissett, 1982a). Central to these ideas is the concept of social gathering for pleasure, as Oldenburg and Brissett argue that participation in third places is important for enhancing engagement in the home and at work. Oldenburg expands on these ideas in his subsequent work “Our Vanishing ‘Third Places’” (1996–1997) with a focus on suburban neighbourhoods, criticising the lack of communal space in zoning regulations (Oldenburg, 1996). Oldenburg further advocates for increased walkability and access to neighbourhood shops or small eateries.
Survey results indicate that many Auckland neighbourhoods are primarily residential, with limited opportunities for social interaction outside of parks and green spaces. When asked about favourite local places, respondents most frequently cited local natural landmarks, which also function as public spaces (35% of total responses; mountain (17%), beach (13%), forest (5%)) followed by parks (17%), local shops (11%) and eateries (9%). Only 6% of responses listed public institutions such as libraries and community centres as their favourite local place. Recognising the role of natural or ecological areas in Tāmaki Makaurau Auckland as reserves and as identity forming landmarks, as communal and leisure spaces is important when evaluating perceived liveability.
Perceptions of neighbourliness and neighbourhood identity varied across areas. Residents in St. Heliers and Mt. Eden reported stronger feelings of belonging and higher recognition of local residents, reflecting established communities with stable populations and active local amenities. In contrast, Northcote, Massey and Takanini; neighbourhoods undergoing rapid densification, had lower agreement with statements regarding recognition of neighbours and a distinct neighbourhood identity. Population growth and insufficient development of communal spaces, whether they are built infrastructure or natural landmarks, may impede social cohesion and makes a strong argument for designing with existing natural ecosystems to foster identity and place attachment.
5.3 Availability of green spaces
The links between green space provision and liveability are widely acknowledged in research and practice (Blaschke et al., 2024; Zhang et al., 2024). Auckland has become less green as it has grown over time: between 1980 and 2016, green space as a proportion of the urban area declined by between 10% and 15%, and there is a significant discrepancy in tree canopy among different suburbs (Parliamentary Commissioner for the Environment, 2023). A study in Auckland has shown that while regional canopy cover is 18%, there are significant differences in canopy cover across the territory, ranging from 8% to 30% across the 16 urban local boards (Golubiewski et al., 2020). According to this study, the local boards where the selected neighbourhoods are situated have the following tree canopy cover: Northcote (Kaipātiki) 30%, Mt. Eden (Albert-Eden) 20%, St Heliers (Orakei) 19%, Massey (Henderson-Massey) 15%, Takanini (Papakura) 14% (see also Table 1). Previous research by Zhang et al. (2024) revealed that most deprived neighbourhoods tended to have more urban green space availability but less accessibility. Children, adolescents and elderly were likely to have less potential opportunity to choose different urban green spaces to visit. Areas with a higher proportion of Māori had less urban green space availability and Pacific populations had less accessibility.
In the questionnaire, the statement “there is a good amount of greenery within my neighbourhood” obtained relatively high satisfaction in all neighbourhoods. Mt. Eden residents demonstrated the highest level of satisfaction with urban greenery, while respondents in Northcote and Takanini demonstrated the lowest levels of satisfaction. This seemingly conflicting result suggests that while areas such as Northcote have high canopy cover, it may not be spatially distributed evenly, and that access to greenery in everyday life affects perceptions of liveability.
5.4 Perceptions of safety
Perceived safety in neighbourhoods can encompass several aspects, such as the perception of crime rates, traffic safety, among others. The design and amenity of the built environment, such as well-lit streets and parks and passive surveillance on streets impact in how safe residents feel and enhance well-being. “Even if there is no such thing as a place free of crime […] a liveable city should aim to control the risk or fear of crime, where a feeling of security underpins a sense of place attachment and the social cohesion of its residents.” (Ceccato, 2012). In the monograph ‘Crime and Fear in Public Places’ (2020), Ceccato and Nalla promote the role of safety as a core component to urban sustainability by drawing on recommendations from the New Urban Agenda and Guidelines on Safer Cities and Human Settlements. The authors employ five core themes including “the environment”, “the movement”, “the users’ perspective”, “the metrics” and “the intervention” to examine the urban phenomena of crime and fear in public spaces, with the aim of generating safe, inclusive, resilient and equitable cities (Ceccato and Nalla, 2020).
Residents of Mt. Eden reported high levels of perceived safety both during the day and at night, reflecting the suburb’s well-lit streets, active public spaces and established urban infrastructure. In contrast, perceptions of safety were lower in Takanini and Massey, particularly for walking at night, where residents expressed greater concern. St. Heliers, by comparison, exhibited consistently positive safety perceptions, with few respondents indicating discomfort.
These patterns suggest that public safety is closely tied to local environmental and social conditions, including street lighting, pedestrian activity and the presence of informal social surveillance. Lower perceptions of safety in rapidly developing or less well-serviced areas may inhibit residents’ use of public spaces and reduce opportunities for social interaction and active transport. Consequently, addressing safety concerns through urban design interventions such as improved lighting, pedestrian infrastructure and mixed-use development-could enhance both mobility and social cohesion, contributing to overall liveability in these neighbourhoods.
5.5 Densification, neighbourhood transformation, climate change and future improvements
Residents were asked about future urban changes to their neighbourhoods, climate-change preparedness and any improvements they would like to see in their local areas. In the survey question “the increase of residential developments and densification within my neighbourhood is positive” and “there is housing for a range of income levels in my neighbourhood” Takanini, the neighbourhood with the least established housing, reported the highest agreement. Similarly, the statement “my neighbourhood is well prepared for the impacts of climate change (e.g. storms, floods)” obtained the strongest levels of agreement in Takanini and highest disagreement in the suburbs of Mt. Eden and Massey. This suggests that as Takanini grows, development and contemporary urban design and planning approaches positively contribute to perceived liveability, in contrast to transforming neighbourhoods.
Recently, policies such as the Government Policy Statement on land transport 2024 and National Land Transport Programme have been moving towards a focus on private vehicle transport, and drastically reducing funding for public transport, pedestrian and cycling improvements (Russell Palmer, 2024; Timothy Welch, 2024). These survey results indicate that these policies might not align well with the current priorities of citizens. These responses highlight the need to ensure a sense of identity and good provision of amenities and green space while densifying Auckland’s neighbourhoods.
5.6 Implications for urban design and policy
Liveability in Tāmaki Makaurau Auckland emerges from the interaction and layering of neighbourhood form, transport accessibility, social maturity, green infrastructure and demographic characteristics. Rapid densification in greenfield areas such as Takanini as well existing suburbs such as Northcote has created a complexity of issues and solutions with varying impact. The results of this research as discussed above carry several implications for planning and policy. Perceptions of liveability are strongly influenced by area because of the variations in walkability, access to public transportation and amenities. However, the interconnectedness of these factors is common across all of the areas investigated.
Similarly, the role of natural systems in the perception of liveability is consistent across all areas. This finding helps contextualise theories developed by Oldenburg and Ceccato for example in a Auckland context. The natural environment plays multiple roles as a source of community identity and as places of social interaction that sit alongside public infrastructures such as parks. Given the importance of green infrastructure for climate mitigation as well, discussion on the improvement of liveability in Auckland should incorporate this awareness and be considered core social infrastructure in transforming urban areas.
The results further highlight that measures to improve liveability are not uniformly distributed among residents. Addressing the uneven experiences reported by disabled residents and certain age groups further underscores the importance of inclusive design – continuous footpaths, safe crossings and proximity to daily needs can help reduce disparities.
Perceptions of liveability reflect not only objective conditions such as the presence of transport links or green space, but also subjective experiences shaped by safety, accessibility, familiarity and social connection. The divergence observed between objective indicators (e.g. canopy cover) and perceived neighbourhood greenery demonstrates that experiential quality matters as much as quantitative provision. Policymakers should therefore integrate perception-based metrics into monitoring frameworks to capture how residents actually experience urban environments, ensuring that interventions address lived realities rather than solely physical indicators.
6. Limitations
This exploratory study aimed to identify initial contrasts in Auckland’s suburbs to inform future research. Participation was voluntary, and the self-selection sampling approach may have overrepresented residents with strong opinions (Smith, 2012). Cultural perspectives, including Māori, Pasifika, and Pākehā viewpoints, were not fully captured, limiting the scope of interpretation. To develop authentic indicators to gain a deeper understanding of local perspectives on well-being and liveability in Aotearoa New Zealand, mātauranga Māori (Māori Indigenous knowledge) would be essential. It can guide culturally-driven environmental assessment practices through the use of tōhu or indicators in environmental kaitiakitanga (Indigenous guardianship) (Walker et al., 2021). Indigenous world views see human well-being as part of a wider life field, connected to more-than-human well-being; however, indicators targeting holistic ecological well-being are yet to be co-produced and appropriately implemented in Aotearoa New Zealand (Yates et al., 2022; Yates, 2021). Future research should incorporate broader measures of liveability, co-created survey items reflecting local cultural values, and holistic well-being approaches that consider both human and more-than-human factors. While the findings cannot be generalised across Auckland, they provide insights into current inequities and inform the design of larger, representative studies.
7. Conclusions and future work
Tāmaki Makaurau faces the challenges of implementing new housing through urban densification while ensuring social cohesion, amenities for residents and resilience to the impacts of climate change. This research investigated perceptions of liveability and sense of community in eight different neighbourhoods in Auckland, with five of them being discussed in more detail in this paper. Although there were different perceptions of liveability according to various aspects assessed, the overall results demonstrated higher levels of perceived liveability in higher socio-economic areas located in more proximity to the city centre, with higher levels of walkability and greenery. The results reinforce the notion of the divide between the wealthy and “leafy” North, Central and East suburbs, and the less privileged South and West suburbs in Auckland. It is crucial to manage the city’s densification in an equitable way to maintain the well-being of all residents and give all residents opportunities to live happy lives with healthy lifestyles. International and local literature on liveable compact cities highlight the need for various components to be incorporated in higher density environments, such as land-use mix with multiple local amenities, diversity of building designs and ages, multiple transport options and well distributed high-quality public green space. All these components must be included in intensification strategies, instead of the single focus on increased density that is seen in some areas of Auckland at the moment. The study provides insights into current issues and inequities amongst different areas to inform future research enquiries. The next stage of this research will be a detailed analysis of responses combined with GIS mapping and correlation with site observations. Creating a balance between increasing density while ensuring ease of access to public facilities, good transport options, abundant public green space and creating a sense of community is a challenge in many cities worldwide. International studies have also revealed that other cities ranked among the world’s most liveable share this same disparity with extreme socio-spatial contrasts. Additional feedback loops between communities, policymakers and designers can help create better outcomes for all neighbourhoods in equitable ways.
The authors acknowledge the contributions of the following Master of Architecture students to this research: Abby Geddes, Riana Horne, James Pearson, Jyllian Cruz, Devarsh Patel, and Kyle Paala. The authors also thank all residents who participated in the survey.