

There is a significant decrease in students' attendance in Zoom classes compared to traditional classes. This paper investigates the factors that affect students' attitudes, behavioral intentions and actual use of Zoom for online classes at higher educational institutions (HEIs) in Sri Lanka.
This research uses the technology acceptance model (TAM) as a theoretical model. The data are collected from HEI students via an online survey form. The hypotheses between constructs in the model are tested using partial least squared–structural equation model.
The analysis shows that computer self-efficacy (CSE) affects perceived usefulness (PU) and perceived ease of use (PEU), which affects attitude (ATT) and behavioral intention (BI) and actual use (AU) of Zoom in a chain reaction. Further, PEU affects PU, which, in turn, affects BI. Furthermore, the effect size of PU to BI is larger than ATT to BI.
Students' attendance for Zoom classes mainly depends on CSE, PU and PEU. Therefore, HEIs should promote Zoom with interactive training before teaching online. Further, officials should revise the curriculum in schools to upsurge the CSE of students.
During coronavirus-19, no research was published on students' use of Zoom for online classes in the Sri Lankan context. Moreover, the TAM model has been modified by including CSE as an external variable.
Introduction
In most countries worldwide, the coronavirus-19 (COVID-19) pandemic has seriously affected most sectors. One of the sectors worst affected by this pandemic is education. As a result, most students have been forced to stay out of their educational institutions. With the emergence of the pandemic as of April 2020, 90% of the world's students population had been affected (UNESCO, 2021). At this time of great crises, e-learning has become the salvation and is considered the best option to continue uninterrupted education. Fitria and Kenedi (2021) state that e-learning allows students to learn whenever and whatever they want, whereas traditional learning requires a physical location for students and educators to meet. Hardaker and Singh (2011) claim that compared to traditional learning, e-learning has undergone tremendous innovations, and it has significantly changed the profile of higher education over the past decade. Mittal et al. (2021) state that significant changes have been observed in faculty members' opinions about online teaching after the effective implementation of e-learning during this pandemic.
The COVID-19 pandemic has had a significant impact on teaching and learning. Most higher educational institutes (HEIs) have suspended their traditional way of teaching, face-to-face learning and shifted toward e-learning, a modern approach (Cheong et al., 2021). Virtual conference platforms have emerged in HEIs as the most popular tool for delivering interactive classes in e-learning (Bahasoan et al., 2020; Sayem et al., 2017). Empirical studies on e-learning applications have received much attention in the global context during the pandemic; however, it is minimal in the Sri Lankan context (Sabraz Nawaz and Rusith, 2019). The context emphasizes the need for a detailed study to explore the use of the e-learning application by Sri Lankan students is viewed as most significant and timely.
In Sri Lanka, a Chinese traveler was reported as the first COVID-19 positive case on January 27, 2020, followed by a local was reported on March 11, 2020 (Karunathilake et al., 2020). The Sri Lankan government strategically implemented public health monitoring system to control the spread of the pandemic. In this scenario, the government closed all HEIs on March 12, 2020, and stopped all academic operations. Since then, higher education in Sri Lanka has been experiencing many obstacles. At the pandemic's beginning, the government launched the “work from home” concept. As a result, the educators had to teach students from home using an alternative method. The Zoom application was the best option available for them. The government also took many measures to implement e-learning and motivate educators and students effectively. The Lanka Education and Research Network (LEARN) made it possible to continue academic activities online (Rameez et al., 2020; Haththotuwa and Rupasinghe, 2021). All Internet service providers have provided free access for Zoom to all universities and state HEIs through LEARN during the pandemic (Hayashi et al., 2020; Chandradasa and Galhena, 2021). Therefore, almost all universities and state HEIs in Sri Lanka prefer Zoom over other popular virtual conference platforms such as Cisco Webex, Google Meet and Microsoft Teams for conducting online classes. Therefore, Zoom has become a popular teaching platform for delivering online classes in Sri Lankan universities and state HEIs (Haththotuwa and Rupasinghe, 2021).
The Government of Sri Lanka has subscribed to Zoom for all universities and state HEIs to continue academic activities during the pandemic. Consequently, almost all universities and state HEIs use Zoom to deliver online classes to their students. However, students' attendances in the online Zoom classes are comparatively lower than the traditional face-to-face classes. According to Rameez (2019), HEIs impose 80% of students' attendance for each subject as one of the eligibility criteria for sitting the semester-end examinations. However, many students fail to attend the classes regularly and do not meet the 80% threshold. Rajanen (2021) argues that the Zoom classes are attended by 50–75% of students on average. This shows that there is a significant decrease in students' attendance for Zoom classes. Therefore, it is important to identify why students are reluctant to attend Zoom classes on HEIs to foster an effective teaching and learning environment. Understanding students' attitudes, behavioral intentions and actual use of Zoom for online classes are essential to be addressed here. Furthermore, in the Sri Lankan context, studies on the factors affecting the students' attitudes, behavioral intentions and actual use of Zoom for online classes are hard to find in the literature. Therefore, this study aims to investigate the factors that affect students' attitudes, behavioral intentions and actual use of Zoom for online classes in HEIs. Therefore, this study investigates the factors which influence the adoption of Zoom for online classes among HEIs of Sri Lanka. This research provides a better understanding of students' attitudes toward Zoom in online classes, which helps higher education policymakers develop and implement better policies to enhance online teaching and learning.
Literature review
E-learning during the pandemic
E-learning uses online technology to enhance the flexibility, student-centeredness and creativity of the teaching-learning process. According to Basilaia et al. (2020), e-learning is an approach that relates to “learning experiences in synchronous or asynchronous environments using different devices (e.g. smartphones, laptops, tablets, etc.) with Internet access. In these environments, students can be anywhere (independent) to learn and interact with instructors and other students.” Many countries have responded to the pandemic by implementing lockdown and social distancing measures, resulting in the closure of schools and HEIs, and training institutes. Subedi et al. (2020) state that distance education through e-learning has become a solution for this global pandemic, even with the challenges posed to both educators and students. During the pandemic, e-learning tools are essential in assisting and promoting teaching and learning during the closure of schools, universities and other HEIs. According to Basilaia et al. (2020), during the pandemic, academic institutions in all countries must be ready to transfer on-campus courses to the virtual campus, which helps to maintain social distance and reduce the source of COVID-19 spread. E-learning facilitates social distance, decreasing viral transmission during the pandemic (Yao et al., 2020). As a result, e-learning is becoming increasingly popular throughout the pandemic. However, social isolation causes uncertainty, physical pain, loneliness, worry and stress that harm the teaching-learning process at university (Xiang et al., 2020).
According to Thamarana (2016), academic activities performed at academic institutions are transferred to the home environment through e-learning. Students can create a space that includes everything they can imagine in a virtual environment that enables them to interact, simulate and collaborate. Nevertheless, quarantine has a strong psychological influence on students (Cao et al., 2020). There is growing evidence of a lack of interest in the subject and social isolation during the pandemic (Cheong et al., 2021). The prolonged closure of educational institutes and the isolation of students at home would certainly be harmful to their overall health (Brooks et al., 2020). According to Ling et al. (2020), the pandemic is considered a threat and creates anxiety, stress and uncertainty. Anxiety is positively associated with fitness concerns during the pandemic. According to Lwoga and Komba’s (2015) findings, e-learning use is determined by computer self-efficacy (CSE), whereas performance expectation, effort expectancy and social influence predict the desire to use online-based learning systems indefinitely.
The Zoom application
Many educators conduct online classes using virtual conferencing applications such as Google Classroom, Zoom, ClassDojo and others (Radić et al., 2021). During the pandemic, Zoom has become a regular part of the life of students and educators. They spend much time on the screen of digital devices for Zoom. The Zoom provides synchronous interactions between educators and students, transmits images and videos using a web camera and screencast, and is a chatting tool that allows multiple conversations simultaneously (Archibald et al., 2019). Guzachchova (2020) states that Zoom is an excellent tool for collaboration that allows teachers to interact with students. Zoom facilitates teachers to explain their subject with their shared screen, making lessons more interactive with students. Zoom offers a variety of digital tools to help teachers digitally replicate much of what happens in the classroom (Radić et al., 2021). Teachers and students can record online classes and watch at their convenient. Teachers may form various virtual rooms to divide the learners into groups of any size. It is a fruitful approach to get learners to take part in group discussions, projects and other academic activities while allowing them to work independently.
According to Oktaviani (2021), Zoom has some limitations and challenges. Handling Zoom might be difficult at the initial stages like other applications. While using Zoom, students may also experience unstable Internet connection, inadequate microphone or speaker and a noisy environment. According to Haqien and Rahman (2020), Zoom lectures are less effective for university students in Jakarta and Depok due to network difficulties that negatively affect learning. Further, Zoom encounters privacy and security criticism: security experts warn that the default settings are insufficiently safe (Cheong et al., 2021). Dutelle (2020) recommends using Zoom if it is impossible to conduct courses in a physical location or if it is dangerous to do so.
Theoretical framework: technology acceptance model (TAM)
Technology acceptance model (TAM) model provides a traditional view of accepting new technology from the user's perspective (Davis, 1989). This model illustrates how people accept and use new technology, and experts have differing viewpoints on its theoretical assumptions and actual usefulness (Lala, 2014). TAM is one of the most influential models of technology acceptance. TAM comprises five constructs: perceived usefulness (PU), ease of use, attitude toward new technology, behavioral intention and actual use (Scherer et al., 2019). This study adds CSE as an external variable that can be used in TAM for various situations.
Teo and Zhou (2017) state that TAM is used to predict the adoption of new technology in the acceptance of technology research. Lai (2017) investigates the user acceptability of computer technology by comparing other technology adoption theories and models with TAM. According to Khoi (2020), future use of technology could be forecast by applying the TAM when the technology is used for the first time. Akar (2019) states that TAM has been used to explain user behavior over various technologies, including e-government, e-tourism, web-based applications and many more. The number of research applying TAM to determine technology adoption in education research is growing. TAM is considered a dominant paradigm for understanding information technology adoption at the organizational level. According to Legris et al. (2003), TAM is the primary model for analyzing the factors influencing user acceptance of new technology.
CSE assesses a person's ability to use computer technology at the highest level and strongly relates to academic performance (Binyamin et al., 2018; Ariff et al., 2012). CSE has significant influences on PU and perceived ease of use (PEU). PU is “the degree to which an individual or group believes that adopting a certain technology will improve their job performance” (Davis, 1989). PU will influence the individuals' and group's intention to accept and use the new technologies. Ladyshewsky (2004) reveals that students largely concentrate on e-learning because of its PU. PEU refers to a person's belief that new technology will be easy and comfortable (Davis, 1989). Al-Okaily et al. (2020) argue that PEU and PU positively impact students' intention to use e-learning. Students use e-learning applications because of their accessibility, PU and PEU (Coldwell et al., 2008). PU and perceived positive outcomes are the two most important factors for e-learning acceptability among Saudi students (Linjawi and Alfadda, 2018). PU and PEU significantly influence students' intentions to adopt an e-learning system during COVID-19 (Habes, 2019).
PU directly impacts the behavioral intention (BI) to use a new system, while PEU indirectly impacts BI via attitude (ATT). ATT is a thorough assessment of that person's ability to carry out that behavior. It may be inferred that users' attitudes about technology are their perceptions, whether good or negative (Azhari and Usman, 2021). ATT toward using technology influences students' intentions to use e-learning applications (Ramdhony et al., 2021; Altawallbeh et al., 2015; Selim, 2007; Alqahtani and Rajkhan, 2020). The study of Rafiq et al. (2020) in Pakistan and Yusoff et al. (2021) in Malaysia find that PU and PEU significantly impact students' ATT toward e-learning in higher education. PU and PEU are predictors of ATT toward using Microsoft Teams® in North West England (Hargreaves et al., 2022).
BI is the desire to carry out behavior (Yilmaz et al., 2020). BI is significant in determining how new technologies are used and adopted (Motahhir and Bossoufi, 2021). PEU and PU are critical factors that determine a student's and teacher's BI to use technology for e-learning in higher education (Elkaseh et al., 2016). Masrom (2007) states that the PEU of e-learning influences the willingness to utilize e-learning; however, the PEU may have less effect than the PU. Students' BI to use e-learning is predicted by both PEU and PU (Abdullah et al., 2016). Furthermore, ATT is a significant factor affecting the intention to use Zoom for online learning during the pandemic in Vietnam (Long and Khoi, 2020). The studies of Shao (2020) in China and Azhari and Usman (2021) in Indonesia reveal that students' ATT significantly impacts BI for online learning. Moreover, students' attendance in Zoom classes is considered actual use (AU) of Zoom. BI is the principal determinant of the AU of Zoom among Indonesian students (Faisal et al., 2021). Bhatt and Shiva (2020) employed TAM to investigate the adoption of Zoom for online learning in India. The study reveals that ATT significantly affects BI, and BI affects the AU of Zoom.
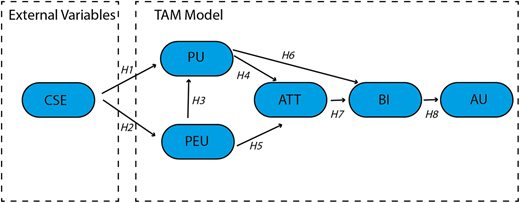
Figure 1 shows the conceptual framework developed using TAM to identify the factors influencing students' intention and use of Zoom for online learning in Sri Lankan HEIs. It forms and examines six constructs based on TAM, namely CSE, PEU, PU, ATT, BI and AU. CSE is considered an external variable, while PEU, PU and ATT are considered core variables, and BI and AU are considered outcome variables of the model used in this study. To achieve the research objective of this study, the following eight hypotheses are constructed based on the conceptual framework:
PU is significantly affected by CSE.
PEU is significantly affected by CSE.
PU is significantly affected by PEU.
ATT is significantly affected by PU.
ATT is significantly affected by PEU.
BI is significantly affected by PU.
BI is significantly affected by ATT.
AU is significantly affected by BI.
Methodology
Data collection
Most HEIs have subscripted to Zoom to deliver lectures online due to the COVID-19 pandemic in Sri Lanka. The target respondents of this study were active students of state universities, state HEIs, and non-state HEIs who use Zoom to attend online classes. The data were collected through a survey questionnaire adapted from Alfadda and Mahdi (2021) to match the local research setting of this study. The questionnaire consists of demographic-related questions in the first part and students' perceptions of Zoom in the second part. The second part was categorized into six sub-sections based on the conceptual framework and constructs: CSE, PU, PEU, ATT, BI and AU. Respondents were required to respond to each question on a five-point Likert scale based on their degree of agreement (1 – Strongly disagree, 5 – Strongly agree). Due to the COVID-19 pandemic, the questionnaire was converted to Google Forms, distributed through appropriate WhatsApp groups, and requested to fill. The questionnaire was active online for two weeks from June 2, 2021. A total of 207 students responded to the online survey, from which only 183 responses were useable for the analysis. Student distribution of Sri Lankan HEIs was considered when administering the questionnaire to ensure the sample represented the population distribution.
This study used SPSS 26 to purify the survey data and describe the demographic profile of the respondents. The measurement and structural equation models (SEM) were analyzed in two-stage, as suggested by Anderson and Gerbing (1988). The convergent validity, discriminant validity, and construct reliability were examined in the measurement model. The proposed structural model (TAM) was evaluated in the SEM to determine whether the proposed hypotheses between the constructs were true (Hair et al., 2017). Rather than assessing a set of regression equations separately, SEM enables the researcher to examine all the relationships among observable indicator variables and numerous outcome variables simultaneously (Ghauri et al., 2020). There are two forms of SEM: Covariance-based (SEM) and partial least squared (PLS-SEM). For smaller samples, the PLS-SEM is the best option (Ghauri et al., 2020; Bandalos, 2018). Therefore, Smart PLS 3.2 was used to analyze the measurement model and SEM.
Data analysis
Descriptive statistics
The respondents' demographic profiles are presented in Table 1. Total valid respondents were 183, of which 114 (62.3%) were female and 69 (37.7%) were male students. According to Jayasingha and Suraweera (2020), the female proportion is 60.1% in HEIs of Sri Lanka. Students who belong to state universities were 114 (62.3%), state HEIs were 55 (30.1%) and non-state HEIs were 14 (7.7%). The GCE (A/L) (general certificate of education (advanced level)) examination determines students' eligibility for higher education in Sri Lanka. Due to the capacity constraints, nearly 18% of eligible students are admitted to state universities; 8% and 3% of eligible students continue their higher studies in state HEIs and non-state HEIs, respectively (Somaratna, 2020; Alawattegam, 2020). The level of study of the respondents was as follows: undergraduate 109 (59.6%), postgraduate 59 (32.2%) and diploma 15 (8.2%). According to the University Grants Commission of Sri Lanka, the students proportion of undergraduates is 62%, postgraduate is 28% and diploma and other short-term courses are 10% in state and non-state HEIs. Therefore, the sample distribution almost matches the population distribution.
Demographic profile
| Characteristics | Attribute | Frequency | Percentage |
|---|---|---|---|
| Gender | Male | 69 | 37.7 |
| Female | 114 | 62.3 | |
| Total | 183 | 100 | |
| Higher educational institution | State university | 114 | 62.3 |
| State HEIs | 55 | 30.1 | |
| Non-state HEIs | 14 | 7.7 | |
| Total | 183 | 100 | |
| Level of study | Postgraduate | 59 | 32.2 |
| Undergraduate | 109 | 59.6 | |
| Diploma (HND, NDT, etc.) | 15 | 8.2 | |
| Total | 183 | 100 | |
| Academic Year | 1st Year | 72 | 39.3 |
| 2nd Year | 18 | 9.8 | |
| 3rd Year | 45 | 24.6 | |
| 4th/Final Year | 48 | 26.2 | |
| Total | 183 | 100 |
Measurement model
According to Hair et al. (2019), construct reliability, convergent validity, and discriminant validity were tested using the measurement model. Table 2 shows the Cronbach's alpha (CA) and composite reliability (CR) values which determine the construct reliability. During the test of the measurement model, items that had factor loading below 0.70 were removed from the model; consequently, ATT2 (0.571) and PEU1 (0.515) were removed. Table 2 indicates that all remaining constructs have CA and CR values of more than 0.70, meeting the threshold requirements proposed by Hair et al. (2019). It confirms that the constructs measured by the 24 items were reliable to perform the model. Convergent validity was determined by the average variance extracted (AVE) value. Table 2 shows that all AVE values of constructs are greater than 0.50, fulfilling the criteria suggested by Hair et al. (2019), and all constructs indicate convergent validity. The discriminant validity was determined by using the Fornell–Larcker criteria and factor loadings. Table 3 shows that all diagonal values are greater than the remaining column's values. Table 4 shows the factor loadings of constructs in the measurement model. The factor loadings are above 0.7 for the respective constructs and confirm that inner construct relationships are found with acceptance parameters as suggested by Fornell and Larcker (1981) and Hair et al. (2019).
Construct reliability and convergent validity
| Items | Cronbach's alpha (CA) | Composite reliability (CR) | AVE |
|---|---|---|---|
| ATT | 0.919 | 0.949 | 0.861 |
| AU | 0.862 | 0.914 | 0.781 |
| BI | 0.892 | 0.920 | 0.698 |
| CSE | 0.922 | 0.951 | 0.865 |
| PEU | 0.907 | 0.941 | 0.843 |
| PU | 0.931 | 0.945 | 0.709 |
Inter constructs correlation and AVE
| Items | ATT | AU | BI | CSE | PEU | PU |
|---|---|---|---|---|---|---|
| ATT | 0.928 | |||||
| AU | 0.402 | 0.884 | ||||
| BI | 0.418 | 0.328 | 0.836 | |||
| CSE | 0.273 | 0.305 | 0.272 | 0.930 | ||
| PEU | 0.419 | 0.366 | 0.318 | 0.394 | 0.918 | |
| PU | 0.477 | 0.364 | 0.564 | 0.445 | 0.550 | 0.842 |
Factor and cross-loadings
| Items | ATT | AU | BI | CSE | PEU | PU |
|---|---|---|---|---|---|---|
| ATT1 | 0.926 | 0.376 | 0.391 | 0.204 | 0.374 | 0.469 |
| ATT3 | 0.939 | 0.386 | 0.429 | 0.312 | 0.416 | 0.474 |
| ATT4 | 0.918 | 0.353 | 0.335 | 0.238 | 0.373 | 0.376 |
| AU1 | 0.361 | 0.858 | 0.226 | 0.199 | 0.382 | 0.338 |
| AU2 | 0.345 | 0.889 | 0.294 | 0.262 | 0.320 | 0.274 |
| AU3 | 0.362 | 0.903 | 0.332 | 0.328 | 0.288 | 0.355 |
| BI1 | 0.367 | 0.249 | 0.847 | 0.185 | 0.299 | 0.494 |
| BI2 | 0.394 | 0.267 | 0.864 | 0.237 | 0.311 | 0.518 |
| BI3 | 0.299 | 0.239 | 0.834 | 0.257 | 0.208 | 0.445 |
| BI4 | 0.289 | 0.250 | 0.827 | 0.228 | 0.223 | 0.461 |
| BI5 | 0.385 | 0.359 | 0.805 | 0.232 | 0.276 | 0.435 |
| CSE1 | 0.262 | 0.265 | 0.250 | 0.921 | 0.328 | 0.387 |
| CSE2 | 0.263 | 0.274 | 0.255 | 0.933 | 0.344 | 0.409 |
| CSE3 | 0.240 | 0.310 | 0.253 | 0.936 | 0.418 | 0.442 |
| PEU2 | 0.401 | 0.368 | 0.298 | 0.421 | 0.939 | 0.532 |
| PEU3 | 0.298 | 0.269 | 0.250 | 0.328 | 0.895 | 0.490 |
| PEU4 | 0.446 | 0.361 | 0.324 | 0.328 | 0.919 | 0.493 |
| PU1 | 0.340 | 0.360 | 0.420 | 0.348 | 0.437 | 0.790 |
| PU2 | 0.362 | 0.263 | 0.451 | 0.384 | 0.443 | 0.798 |
| PU3 | 0.446 | 0.262 | 0.463 | 0.328 | 0.461 | 0.861 |
| PU4 | 0.385 | 0.251 | 0.467 | 0.378 | 0.445 | 0.859 |
| PU5 | 0.402 | 0.334 | 0.538 | 0.403 | 0.499 | 0.854 |
| PU6 | 0.457 | 0.327 | 0.530 | 0.417 | 0.482 | 0.881 |
| PU7 | 0.412 | 0.349 | 0.446 | 0.360 | 0.474 | 0.846 |
Note(s): Italic values (Factor loadings) should be more than 0.70 to consider that the construct has Convergent Validity, and other values (Cross loadings) should be less than the factor loadings to consider that the construct has Discriment Validity
Structural equation model
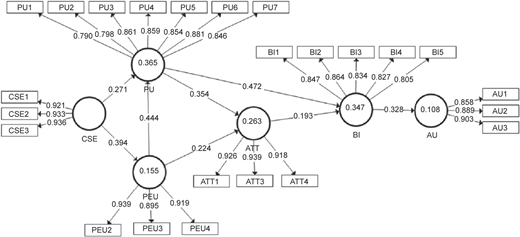
The path coefficients and their significance of the proposed model were tested in SEM. This study used a bootstrapping procedure with 5,000 subsamples to obtain the model's t-statistics and p-values of path coefficients and tested the proposed hypotheses. Figure 2 depicts the path coefficients of the hypothesized relationships between the constructs in the SEM. Table 5 summarizes the results of SEM. The values in Table 5 indicate that the t-values of path coefficients are greater than 2.576, p-values are less than 0.01. Thus, this study suggests that all eight path coefficients in the model are significant. Hence, this study concludes that all proposed hypotheses are true.
Summary of the SEM
| Hypothesized path | Path | Path coefficient | t-value | p-value | Results |
|---|---|---|---|---|---|
| H1 | CSE → PU | 0.271 | 4.438 | 0.000 | Significant |
| H2 | CSE → PEU | 0.394 | 5.917 | 0.000 | Significant |
| H3 | PEU → PU | 0.444 | 6.752 | 0.000 | Significant |
| H4 | PU → ATT | 0.354 | 4.539 | 0.000 | Significant |
| H5 | PEU → ATT | 0.224 | 2.695 | 0.007 | Significant |
| H6 | PU → BI | 0.472 | 7.517 | 0.000 | Significant |
| H7 | ATT → BI | 0.193 | 2.869 | 0.004 | Significant |
| H8 | BI → AU | 0.328 | 4.625 | 0.000 | Significant |
Model fit
The coefficient of determination (R2), which explains the proportion of variation of each endogenous variable in the structural model, is shown in Table 6. It indicates that the model explained a reasonable portion of the variance in all of the endogenous variables: PEU (15.5%), PU (36.5%), ATT (26.3%), BI (34.7%) and AU (10.8%). Falk and Miller (1992) suggest that the R2 value should be greater than 0.10. Thus Falk and Miller (1992) criteria are met for all dependent variables in the model. However, substantial unexplained variations in the model suggest that additional crucial factors could improve the model's strength.
Coefficients of determination (R2)
| Original sample (O) | Sample mean (M) | Standard deviation (STDEV) | t-statistics (|O/STDEV|) | p-value | |
|---|---|---|---|---|---|
| ATT | 0.263 | 0.269 | 0.058 | 4.574 | 0.000 |
| AU | 0.108 | 0.116 | 0.049 | 2.190 | 0.029 |
| BI | 0.347 | 0.359 | 0.054 | 6.461 | 0.000 |
| PEU | 0.155 | 0.162 | 0.051 | 3.018 | 0.003 |
| PU | 0.365 | 0.370 | 0.066 | 5.515 | 0.000 |
The factors in a conceptual framework can be affected/influenced by various factors. The removal of an exogenous variable can affect the dependent variable. According to Cohen (1988), the effect size was measured by F2 is the change in R2 that occurs when an exogenous variable is omitted from the framework. Table 7 shows the effect size (F2) assessed for this model. It reveals that the CSE → PU (F2 = 0.097), PEU → ATT (F2 = 0.048), PU → ATT (F2 = 0.119), ATT → BI (F2 = 0.044), and BI → AU (F2 = 0.121) have small effects. CSE → PEU (F2 = 0.183), PEU → PU (F2 = 0.262) and PU → BI (F2 = 0.264) have moderate effects.
Effect size (F2)
| Effect size (F2) | Sample mean (M) | Standard deviation (STDEV) | t-statistics (|O/STDEV|) | p-value | |
|---|---|---|---|---|---|
| ATT → BI | 0.044 | 0.052 | 0.034 | 1.309 | 0.191 |
| BI → AU | 0.121 | 0.135 | 0.066 | 1.841 | 0.066 |
| CSE → PEU | 0.183 | 0.197 | 0.076 | 2.412 | 0.016 |
| CSE → PU | 0.097 | 0.105 | 0.049 | 1.993 | 0.047 |
| PEU → ATT | 0.048 | 0.056 | 0.038 | 1.244 | 0.214 |
| PEU → PU | 0.262 | 0.272 | 0.103 | 2.543 | 0.011 |
| PU → ATT | 0.119 | 0.127 | 0.062 | 1.912 | 0.057 |
| PU → BI | 0.264 | 0.282 | 0.090 | 2.940 | 0.003 |
The Q2 is predictive relevance, which determines whether or not a model is predictive. Q2 determines the predictive power of the endogenous constructs. Predictive power was evaluated in this study by executing Stone–Geisser's Q2 (Geisser, 1974). According to Hair et al. (2019), Q2 values greater than zero suggest that the PLS model has predictive power and is cross-validated. Table 8 shows the assessed Q2 for this model, indicating it has good predictive power and is cross-validated.
Results and discussion
This study investigates how various factors influence the ATT, BI and AU of Zoom in online classes at Sri Lankan HEIs during the COVID-19 pandemic. Six constructs are identified, and eight hypotheses are formulated based on TAM. The impacts of all the constructs and hypotheses were measured using SEM. According to the empirical analysis, all the eight proposed hypotheses in the model are true. Table 5 summarizes the significance of the path coefficients between all constructs (CSE → PU, CSE → PEU, PEU → PU, PU → ATT, PU → BI, ATT → BI, BI → AU). The t-values of all paths are greater than 2.576, demonstrating that path coefficients are statistically significant at a 99% confidence interval.
CSE positively impacts PEU (β = 0.271, t = 4.438, p = 0.000) and PU (β = 0.394, t = 5.917, p = 0.000). These findings are consistent with Senaratne and Samarasinghe (2019), Bubou and Job (2020), Thongsri et al. (2020), Ejdys (2021) and Chien (2012). If students find Zoom is useful and convenient, they regularly attend online classes and are highly engaged. This study also finds that PEU positively impacts PU (β = 0.444, t = 6.752, p = 0.000); PU (β = 0.472, t = 7.517, p = 0.000) and ATT (β = 0.193, t = 2.869, p = 0.004) positively impact BI toward using Zoom. These findings are consistent with previous studies (Cathy et al., 2015; Cakır and Solak, 2015; Ibrahim et al., 2017; Al Kurdi et al., 2020). The path values of H4 (β = 0.354, t = 4.539, p = 0.000) and H5 (β = 0.224, t = 2.695, p = 0.007) suggest that the PU and PEU of Zoom impact ATT toward online learning, which is consistent with earlier research that confirms the relationships (Zaidi et al., 2021). The path value of H8 (β = 0.328, t = 4.625, p = 0.000) indicates that BI toward Zoom positively impacts the AU of Zoom. It confirms that BI toward Zoom influences their AU of Zoom for online classes, as predicted by the original TAM model. The findings of this study stress that CSE influences PU and PEU; PEU influences PU; PEU and PU influence ATT; ATT influences BI to use Zoom. BI influences the AU of Zoom. These findings align with the original TAM (Davis, 1989; Radić et al., 2021) and are consistent with previous studies (Cathy et al., 2015; Cakır and Solak, 2015; Ibrahim et al., 2017; Al Kurdi et al., 2020).
This study implies that students with a positive perception of Zoom have strong intentions to use it for their online classes. The positive attitude about Zoom depends on PU and PEU. Furthermore, CSE plays a significant role in the attitude toward using Zoom through PU and PEU. It suggests that students' negative attitude toward Zoom causes poor attendance in Zoom classes. This negative attitude arises due to a lack of self-efficacy in operating computer/digital devices and applications, unawareness, unfamiliarity, and incomprehensibility about Zoom. Therefore, the findings imply that policymakers should take appropriate measures to enhance students' CSE, PU, and PEU. Further, HEIs should provide training about Zoom before teaching online, which enhances PU and PEU. Furthermore, the curriculum of primary and secondary schools has to be revised to improve students' self-efficacy in operating computer/digital devices and applications.
Conclusion
This study investigates the factors influencing the adoption of Zoom for online classes among HEIs of Sri Lanka. This study bases the TAM as a theoretical framework, develops six constructs, and proposes eight hypotheses. The measurement and SEM were tested using Smart PLS 3.2. The study finds that all eight proposed hypotheses in the theoretical framework are supported by data on students' use of Zoom for online classes. Accordingly, CSE influences the PU and PEU; PEU and PU influence ATT; PU and ATT influence BI; BI influences AU. Furthermore, the effect size toward BI from PU is larger than ATT.
Each study has its own set of limitations. This study evaluated six constructs in the model, which explain little variances. Future research may consider a few more constructs affecting students' technology acceptance, such as online teaching methods, quality of Internet connection, and information system quality. Furthermore, this paper focuses HEIs context only. Hence, this study's findings may not apply to other domains, such as primary and secondary school. In addition, more diverse demographic profiles would be considered for future research. Moreover, the adoption of Zoom for online classes may differ among gender, levels of study and type of HEIs. Therefore, it recommends conducting multi-group analyses (MGA) based on gender, levels of study and type of HEIs for future study. Furthermore, MGA can be done by expanding the study's sample size in the future. This study contributes to the modified TAM model's validation by incorporating and validating the impact of CSE as an external variable on the student's ATT, BI and AU of Zoom for the online classes.
The author(s) received no financial support for the research, authorship, and/or publication of this article.
