The purpose of this paper is to identify the factors affecting learners' perception of e-learning during the Coronavirus-2019 (Covid-19) pandemic. Furthermore, it investigates mechanisms that enhance students' engagement in e-learning, especially under the constraints created by the pandemic.
Quantitative research approach was used, and data were collected using a structured questionnaire. The sample consisted of 163 undergraduates registered at the Faculty of Management Studies of the Open University of Sri Lanka (OUSL). The structured questionnaire was designed taking into consideration learners attached to different regional centers and study centers of the OUSL.
As per the findings, performance expectancy, social influence, effort expectancy and service quality are the factors which have significant effects on students' “intention to use” e-learning as a method of pursuing education. Furthermore, it was observed that 65.6% of the students had access to technology through mobile phones, while 53.4% of the students had engaged in e-learning for the first time. This was mainly due to restrictions that were imposed during the Covid-19 pandemic.
The study will help in formulating policies and introducing procedures in relation to online teaching-learning models to be used by both teachers and learners, especially in similar pandemic situations in the future.
This study will assist to determine the effectiveness of the e-learning system used by the OUSL. The findings highlighted the importance of improving information technology (IT) facilities available at all the regional and study centers across Sri Lanka.
1. Introduction
The coronavirus (Covid-19) outbreak has become a major stumbling block to the education system, and technology has now started playing a more vital role in overcoming this obstacle in providing education all over the world. The pandemic has compelled universities and higher educational institutions to rely more on advanced technologies to conduct their respective study programs and create new educational opportunities for everyone. It has led to the opening up of vast opportunities to those involved in the field of education across the globe. Technological advancement is taking place at a rapid pace, and access to digital tools such as mobile phones and the Internet is growing, leading to most institutions canceling physical contact sessions and encouraging the utilization of online resources instead.
This global scenario has created a situation in which learners can use e-learning to learn from home, and more importantly, update their knowledge and skills using various technological devices such as computers and mobile phones. Learners are provided with enormous flexibility and freedom with regard to most aspects of learning; for example, in terms of
the place they login from,
the time they login to their network and
the content they access (tools, materials, etc.).
Furthermore, learning management systems (LMS) utilize rich multimedia content, and the best online teachers, equipped with the latest updates, could be relied upon in delivery. Also, learning processes in this system can be offline, online or a combination of these (Al-Busaidi, 2013), and students and learners can gain knowledge and disseminate it digitally (Tetteh, 2016). In e-learning, learners have flexibility and convenience in the contexts of time and location, hence online learning can be defined as the distribution of learning materials and methods for learning, teaching or acquiring knowledge anytime, anywhere using information technology (IT) (Turban et al., 2015).
Online learning has broadened its horizons in different perspectives. As per Garrison (2011), the method of online learning not only enables students to study at home, but also helps employees learn and expand their knowledge and skills while at work. Furthermore, with the enhancement of technology, e-learning systems have facilitated learners with a platform where they can avoid face-to-face interaction (Ashrafi et al., 2020). This specifically helps learners who are socially inept or do not have physical access to meet people in person, or to engage and interact physically with others to learn. e-learning is not just about web-based learning. There are multiple facets of e-learning; these include mobile learning with smartphones, tablets and other equipment. The term e-learning also includes a wide range of activities such as computer-based training and instruction, and education delivered online. Therefore, enabling e-learning in educational institutions is considered useful (Samsudeen and Mohamed, 2019; Turban et al., 2015). More importantly, Zalat et al. (2021) argued that prior to Covid-19, e-learning was underutilized by developing countries and the current pandemic forced countries across the globe to rely on e-learning for education. In this context, it is worthwhile to discuss how the Open University of Sri Lanka (OUSL) has practiced e-learning in this crisis situation.
The OUSL was established in 1980 as the leading Open and Distance Learning (ODL) establishment in Sri Lanka where students and adults could pursue their education through ODL methodologies. ODL can be considered as an established mechanism for teaching and learning which offers flexible learning and “access to learning opportunities” to anyone, anywhere and at any time (Jayatilleke and Gunawardena, 2016). The OUSL has made a remarkable transition to online education in response to the Covid-19 pandemic. According to Liyanagama et al. (2015), the initiation of online learning can be seen in the year 2003/2004 with the Capacity Enhancement (OUSL) unit of the Asian Development Bank supported Distance Education Modernization Project. And also, the OUSL has continuously adopted many strategies to promote online learning (Chathurika and Rajapaksha, 2017). As per Hayashi et al. (2020), even though the OUSL had adopted a distance learning method to support the largest number of students through a network of regional and study centers in each district, only 69% of them managed to continue e-learning amidst the Covid situation. Prior to the emergence of the Covid-19 pandemic, the practice of the OUSL had been to conduct separate, parallel study sessions across all centers in Sri Lanka. As a result of the pandemic, the OUSL started conducting lectures centrally, utilizing e-learning and other online conferencing applications.
The OUSL has provided an opportunity to obtain hands-on experience of online learning technologies and upgrade skills in digital learning, training and teaching. Whereas most Sri Lankan universities use Moodle open-source platform as their LMS, the OUSL has used the same as their e-learning system for many years. Furthermore, the university has conducted many awareness programs to promote online learning after the Covid-19 pandemic such as awards for best online submission of assignments, student awareness sessions of online learning and several supplementary resources being made available on YouTube, etc. Figure 1 shows the LMS interface of the OUSL which is currently in use.
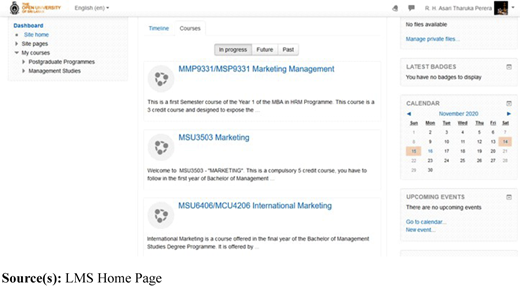
As per Figure 1, the features of e-learning include membership, classroom management, announcements, learning resources, Zoom links, learner groups, quizzes, learning records, grades and grade processing systems. Through e-learning, experts get the opportunity to deliver their knowledge and expertise to a vast number of learners, and assess learners' progress, whereas learners get the opportunity to interact with experts and gain knowledge (Aguti et al., 2015). The OUSL, with 24 study centers across the country with its online learning facility, provides a convenient and accessible platform for learners who are not willing to attend lectures in person and have face-to-face interactions with teachers and classmates.
Following the Covid-19 pandemic, the university has had to adapt solely to online learning. Hence, it is worthwhile to examine the factors affecting the effective implementation of an e-learning system. The success of implementing an e-learning system depends on the students' willingness to accept such a system (Al-Qirim et al., 2018) and also on the accessibility of the system to students at any time and in any place (Maxwell, 1995; Turban et al., 2015). Even though previous researchers (Patterson and McFadden, 2009; Dodge et al., 2009) argued there was a higher drop-out rate in e-learning than in face-to-face contact sessions, Covid-19 has altered the status quo of the e-learning landscape (Zalat et al., 2021). Consequently, this study intends to explore the relevance of this transformation in relation to a context within the OUSL. Furthermore, researchers have observed that limited studies have been conducted to understand what factors would affect learners' perception of e-learning during a pandemic situation. Accordingly, this study is going to investigate the factors affecting learners' perception towards e-learning during the Covid-19 pandemic. Thus, the following research objectives will be discussed:
To identify the factors affecting learners' perception towards e-learning during the Covid-19 pandemic.
To identify obstacles faced by users and determine mechanisms to enhance students' engagement while using the e-learning system during the Covid-19 pandemic.
2. Theoretical framework and hypotheses
2.1 The unified theory of acceptance and use of technology (UTAUT)
It is important to study the intention of the learner using the information system (IS) and the usage behavior of the learner. In this regard, the unified theory of acceptance and use of technology (UTAUT) is important to this discussion. This model was introduced by Venkatesh et al. (2003) on user acceptance of IT. The UTAUT aims to explain user intentions in utilizing an IS and subsequent usage behavior. The theory holds that there are four key constructs: 1) performance expectancy (PE), 2) effort expectancy (EE), 3) social influence (SI) and 4) facilitating conditions. The first three are direct influences of usage intention, and the fourth is a direct determining factor of user behavior (Tan, 2013; Ain et al., 2016; Zuiderwijk et al., 2015). It can be seen that many researchers have investigated the UTAUT model in the context of intention to use e-learning (Kamalasena and Sirisena, 2021; Abbad, 2021; Jameel et al., 2021). As the present research is focused on usage intention, the aforementioned three factors of usage intention (PE, EE and SI) would assist to provide insights into the factors that may influence the adoption of e-learning during the Covid-19 pandemic.
2.1.1 Performance expectancy (PE)
The level of belief of a learner in the given online learning system is important. The learners' belief in the degree to which they have control, or better perception, of a system, can be explained by PE. PE is defined as “the degree to which an individual believes that using the system will help him or her to perform better” (Venkatesh et al., 2003), which signifies the degree of belief an individual has in using a particular IS. It is similar to perceived usefulness in the technology acceptance model as well. Moreover, Murniati (2020) argued, attitude to use, perceived usefulness and perceived ease of use are the variables that mostly affect e-learning intention to use. According to Venkatesh (2000), PE can be considered as a factor that predicts the intention to use new technology in the context of operations. Furthermore, the same concept of PE acts as a predicting variable of usage intention of a newly introduced system in diverse contexts such as mobile banking (Alalwan et al., 2015), e-learning (Ali et al., 2018), social media (Sharma et al., 2016) and online banking (Alalwan et al., 2014). This study refers to PE as the extent to which users believe that the use of e-learning systems enhances educational performance. As per the literature, PE is significantly and positively associated with learners' behavior intention to use e-learning (Mensah, 2019; Nawaz et al., 2020).
PE has a significant impact on learners' behavior intention to use e-learning.
2.1.2 Effort expectancy (EE)
EE can be articulated as the degree of “ease of use” related to learners' use of IT (Venkatesh et al., 2012). It can be aligned with the level of comfort in the usage of ISs (Venkatesh et al., 2003). And also can be considered as the perception of an individual (learner) who is able to use the IS without any extra effort (Yadav et al., 2016; Mafuna and Wadesango, 2016). According to Sharma et al. (2016) and Zuiderwijk et al. (2015), a positive relationship can be seen between EE and the intention to use a system, and this can be considered one of the important elements of intention to use e-learning systems (Tarhini et al., 2017a, 2017b). This study also argued on the premise that “if a learner finds it easier to use e-learning, he or she is willing to adopt it.”
EE has a significant impact on learners' behavior intention to use e-learning.
2.1.3 Social influence (SI)
As e-learning provides learners with educational practices, SI cannot be ignored. The concept of SI argues that the person's degree of recognition depends on whether the individuals who are important to them believe that they should often use ISs. SI relates to subjective norms in the theory of planned behavior. According to previous research, users have a tendency to communicate with others to determine their technology acceptance (Magsamen-Conrad et al., 2015). The concept of SI is authenticated in numerous studies as an important factor in determining the intent of people to use innovations such as online learning (Ali et al., 2018; Tarhini et al., 2017a, b). Maldonado et al. (2010) observed a positive relationship between SI and behavioral intention. As argued by Venkatesh and Davis (2000), the impact of SI is significantly higher in a mandatory setting than in a voluntary setup. Moreover, this research works on the assumption that users' intention to use e-learning systems is affected by “SI” derived from lecturers, instructors and friends.
SI has a significant impact on learners' behavior intention to use e-learning.
2.2 DeLone and McLean IS success model
Whatever the IS, there is a need to measure its success. The IS success model identifies and describes the relationships among six critical dimensions. This model was designed by DeLone and McLean (1992, 2003), with the added variable of “service quality (SQ)” employed in the updated model in 2003. Thus, the modernized model of DeLone and McLean (1992, 2003) included six variables: 1) information quality (IQ), 2) system quality (SysQ), 3) SQ, 4) user's intention to use IS, 5) net benefits and 6) user satisfaction. It can be seen that many studies had applied the IS success model presented by DeLone and McLean (2003) for e-learning assessment and development. The updated DeLone and McLean (2003) IS success model could be adjusted to fit in assessing challenges in online learning as well. Thongsri et al. (2019) employed SysQ, IQ and SQ to measure e-learning systems. This can be seen as same for some other studies as well (Ramayah et al., 2010; Lee and Hsieh, 2009; Park and Kim, 2013; Byrd et al., 2006). This study, too, employed these variables to measure the e-learning system of OUSL.
2.2.1 System quality (SysQ)
Irrespective of the many benefits provided, people may resist systems due to other reasons such as slow response times, heavy traffic causing the server or network lag, lack of accessibility, etc. Therefore, the quality of a system is of vital importance. SysQ refers to the quality of the IS, including the availability of the system, ease of utilization to the user (user experience or UX), a user-friendly interface and speed of response (feedback), etc. (DeLone and McLean, 2003). The quality and the excellence of any IS always influence the learners' intention to use the system (DeLone and McLean, 2003). If it is a system of poor quality then it can lead to the dissatisfaction of students. In case a student finds that the given system is not user-friendly, he or she might not readily accept the system. Other researchers too have indicated that SysQ influences intention to use an IS; for instance, Lee and Hsieh (2009) observed that the variable of “SysQ” directly affects the “intention to use mobile internet services,” and McFarland and Hamilton (2006) argued that the “SysQ” influenced both variables of “perceived use” and “actual use of the system.”
SysQ has a significant impact on learners' behavior intention to use e-learning.
2.2.2 Information quality (IQ)
It is important to consider the quality, accuracy and relevance of information. In a scenario where an IS is used by learners (including students), IQ can be considered as the “quality of data received.” Data quality consists of characteristics such as data relevance, data completeness, comprehensibility of data and data being up to date. Quality of information will affect intention to use and user satisfaction in the system (DeLone and McLean, 2003). Williams and Jacobs (2004) stated that IQ is an important factor for education, especially in e-learning. Furthermore, Byrd et al. (2006) also stated that the valuation of the quality of information is a vital and important dimension of e-learning.
IQ has a significant impact on learners' behavior intention to use e-learning.
2.2.3 Service quality (SQ)
SQ is regarded as an important factor in customer orientation. Customer service is considered a particularly crucial element in e-commerce as well (Chung and Skibniewski, 2007). SQ is the assistance provided to the user, and the sincere interest, or empathy, displayed in solving users' problems by responding to questions raised by users while using the IS (DeLone and McLean, 2003). Many studies have been conducted focusing on the concept of SQ (Sharma, 2015, 2016). Notably among these, research conducted in the education sector argued that students were willing to learn from and acquire online learning applications in cases where they perceived the quality of the service they received was higher. On a further supporting note, Milosevic et al. (2015) indicated a direct relationship between SQ and intention to use mobile learning by learners. Park and Kim (2013) argued that SQ also has a significant impact on the level of acceptance.
SQ has a significant impact on learners' behavior intention to use e-learning.
3. Methodology
This study is based on quantitative methodology, and a questionnaire was used to collect data, including personal and research information. During the pandemic, the Faculty of Management Studies fully shifted to online mode; following this, a lesser number of students being involved in lectures was observed. A pilot survey was then conducted by interviewing a few students to investigate the factors contributing to low involvement, based upon the results of the same, the need to conduct a comprehensive study was observed.
The operationalization of variables can be seen in Table 1.
Operationalization
| Variables | Statements | References | Measure | |
|---|---|---|---|---|
| Independent variables | Performance expectancy (PE) | PE1: I find e-learning useful for my studies | (Venkatesh et al., 2003; Chiu and Wang, 2008; Milošević et al., 2015; Thongsri et al., 2019) | 5-point Likert Scale |
| PE2: Using e-learning would enable me to achieve learning tasks more quickly | ||||
| PE3: Using e-learning in my studying would increase my learning productivity | ||||
| PE4: e-learning could improve my collaboration with classmates | ||||
| Effort expectancy (EE) | EE1: I would find e-learning flexible and easy to use | (Venkatesh et al., 2003; Chiu and Wang, 2008; Milošević et al., 2015; Thongsri et al., 2019) | 5-point Likert Scale | |
| EE2: Learning to operate e-learning does not require much effort | ||||
| EE3: My interaction with e-learning would be clear and understandable | ||||
| Social influence (SI) | SI1: I would use e-learning if it was recommended to me by my lecturers | (Venkatesh et al., 2003; Chiu and Wang, 2008; Milošević et al., 2015; Thongsri et al., 2019) | 5-point Likert Scale | |
| SI2: I would use e-learning if it was recommended to me by my classmate | ||||
| SI3: I would like to use e-learning if my lecturers' supported the use of it | ||||
| SI4: People who are important to me think that I should use e-learning | ||||
| System quality (SysQ) | STQ1: e-learning system provides high availability | (Al-Busaidi, 2013; Chiu and Wang, 2008; Thongsri et al., 2019) | 5-point Likert Scale | |
| STQ2: The response time of the e-learning system is reasonable | ||||
| STQ3: e-learning system has attractive features to appeal to the users | ||||
| STQ4: e-learning system provides interactive communication between teacher and students | ||||
| Information quality (IQ) | INTQ1: The information provided by e-learning is relevant | (Ahn et al., 2007; Al-Busaidi, 2013; Thongsri et al., 2019) | 5-point Likert Scale | |
| INTQ2: The information provided by e-learning is easy to understand | ||||
| INTQ3: The information provided by e-learning is up to date | ||||
| INTQ4: The information provided by e-learning is complete | ||||
| Service quality (SQ) | SERQ1: When you have a problem, the e-learning shows a sincere interest in solving it | (Ahn et al., 2007; Al-Busaidi, 2013; Thongsri et al., 2019) | 5-point Likert Scale | |
| SERQ2: e-learning is always willing to help you | ||||
| SERQ3: e-learning service gives you individual attention | ||||
| SERQ4: e-learning understands your specific needs | ||||
| Dependent variable | Intention to use e-learning (BI) | INT1: I intend to use an e-learning device for learning in the future | (Milošević et al., 2015; Chathurika and Rajapaksha, 2017; Thongsri et al., 2019) | 5-point Likert Scale |
| INT2: I predict that I will use e-learning frequently | ||||
| INT3: I will enjoy using e-learning | ||||
| INT4: I would recommend others to use e-learning |
Source(s): Developed by researcher
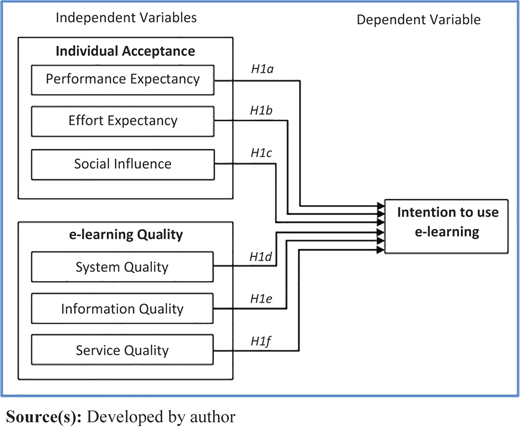
The questionnaire was developed and distributed among the sample using Google Forms. The population of this study included all management undergraduates in the OUSL, with approximately 4,000 undergraduates pursuing education in the Faculty of Management Studies. The study adopted a convenient sampling method, which was of non-probabilistic type. A sample of 163 completed questionnaires was assessed following the removal of incomplete questionnaires. The following conceptual model was advanced from the literature review.
According to Figure 2, individual acceptance and e-learning quality are considered as independent variables and intention to use e-learning is considered as the dependent variable.
In all, 35 learners were randomly selected for the pilot test to check the reliability of the questionnaire. The existence of reliability was identified by evaluating the feedback of respondents. Cronbach's alpha values were considered to ascertain the reliability of the instrument.
As per Walsh (1995), the value of Cronbach's alpha varies from zero (0) to one (1), and a value of 0.6 or above indicates acceptable internal consistency reliability. According to the reliability test (Table 2), Cronbach's alpha value for each variable is higher than 0.6, which confirms a high level of reliability.
4. Data analysis
4.1 Demographic profile of the sample
Demographic data such as gender, age, employment status, etc., were analyzed to contextualize the findings and to provide appropriate recommendations.
Table 3 discusses the demographic characteristics of the sample. According to the research findings, the majority of respondents (66.3%) are female, and the majority of respondents are between the ages of 18–25 (69.9%). The majority of students who begin their studies at OUSL after their A/L (Advanced level examination) are between the ages of 18–25. Thus, the results are compatible with the student profile. As depicted in Table 2, three regional centers of the Open University (Colombo, Kandy and Kurunegala) represent the majority of the respondents (77.9%). Most of the respondents (93.9%) are in the ranges of good and excellent in computer literacy and they use mobile phones (65.6%) and laptops (28.8%) as their main login devices. Students primarily got to know about e-learning at OUSL from day schools, friends and emails. Many managerial implications can be observed based on the above mentioned findings as well.
Demographic information
| Frequency | Percentage (%) | Valid percentage (%) | Cumulative percentage (%) | |
|---|---|---|---|---|
| Gender | ||||
| Male | 55 | 33.7 | 33.7 | 33.7 |
| Female | 108 | 66.3 | 66.3 | 100.0 |
| Total | 163 | 100.0 | 100.0 | |
| Age | ||||
| 18–25 | 114 | 69.9 | 69.9 | 69.9 |
| 26–35 | 44 | 27.0 | 27.0 | 96.9 |
| 36–45 | 5 | 3.1 | 3.1 | 100.0 |
| Total | 163 | 100.0 | 100.0 | |
| Regional centers | ||||
| Anuradhapura | 9 | 5.5 | 5.5 | 5.5 |
| Badulla | 9 | 5.5 | 5.5 | 11.0 |
| Batticaloa | 4 | 2.5 | 2.5 | 13.5 |
| Colombo | 87 | 53.4 | 53.4 | 66.9 |
| Jaffna | 4 | 2.5 | 2.5 | 69.3 |
| Kandy | 17 | 10.4 | 10.4 | 79.8 |
| Kurunegala | 23 | 14.1 | 14.1 | 93.9 |
| Matara | 8 | 4.9 | 4.9 | 98.8 |
| Rathnapura | 2 | 1.2 | 1.2 | 100.0 |
| Total | 163 | 100.0 | 100.0 | |
| Login device -e-learning | ||||
| Mobile phone | 107 | 65.6 | 66.0 | 66.0 |
| Desktop computer | 6 | 3.7 | 3.7 | 69.8 |
| Laptop | 47 | 28.8 | 29.0 | 98.8 |
| Tablet | 3 | 1.8 | 1.8 | 100.0 |
| Total | 163 | 100.0 | 100.0 | |
| Computer literacy | ||||
| Excellent | 23 | 14.1 | 14.1 | 14.1 |
| Good | 130 | 79.8 | 79.8 | 93.9 |
| Poor | 10 | 6.1 | 6.1 | 100.0 |
| Total | 163 | 100.0 | 100.0 | |
Source(s): Survey data
A more in-depth study discovered that there were several obstacles that students encountered while using the e-learning system.
According to Table 4, around 32% of the respondents experienced problems with unstable Internet connections. And also 19.6% of the respondents indicated that “Adapting to online learning is difficult.” That may be due to many reasons such as computer literacy, etc. In any case, there is a need for future researchers to investigate this further in different perspectives. More importantly, 16.6% questioned the affordability of costly Internet services in Sri Lanka. Non-availability of quality devices also was considered a problem by 14.8%. Interestingly, around 5% of respondents mentioned the importance of face-to-face interactions over online interactions, with the element of “Human Touch.” Of all the participants only 12.2% “do not have any issues” using online learning. Nevertheless, this also needs to be further explored by future studies.
Have you encountered any problems while using e-learning?
| Frequency | Percentage (%) | Valid percentage (%) | Cumulative percentage (%) | ||
|---|---|---|---|---|---|
| Valid | Adapting to online learning is difficult | 32 | 19.6 | 19.6 | 19.6 |
| Without face-to-face interaction, learning is difficult | 08 | 4.9 | 4.9 | 24.5 | |
| Quality devices do not exist | 24 | 14.8 | 14.8 | 39.3 | |
| Unstable Internet connection | 52 | 31.9 | 31.9 | 71.2 | |
| High cost of Internet service | 27 | 16.6 | 16.6 | 87.8 | |
| No issues | 20 | 12.2 | 12.2 | 100 | |
| Total | 163 | 100 | 100 | ||
Source(s): Survey data
The above table (Table 5) indicated that 53.4% of students engaged in e-learning for the first time. This may mainly be because of restrictions imposed due to the Covid-19 pandemic.
Have you had access to e-learning prior to the pandemic?
| Frequency | Percentage (%) | Valid percentage (%) | Cumulative percentage (%) | ||
|---|---|---|---|---|---|
| Valid | Yes | 76 | 46.6 | 46.6 | 46.6 |
| No | 87 | 53.4 | 53.4 | 100.0 | |
| Total | 163 | 100.0 | 100.0 | ||
Source(s): Survey data
As per Table 6, the level of influence of PE, SI and IQ is higher than that of EE, SysQ and SQ. These variables have been measured through a five-point Likert scale ranging from 5 (strongly agree) to 1 (strongly disagree).
Mean and standard deviation
| Descriptive statistics | |||
|---|---|---|---|
| Mean | Std. Deviation | Level of influence | |
| Performance expectancy | 3.7607 | 0.74915 | Larger extent |
| Effort expectancy | 3.5276 | 0.70644 | Medium extent |
| Social influence | 3.7347 | 0.81351 | Larger extent |
| System quality | 3.5414 | 0.74653 | Medium extent |
| Information quality | 3.6457 | 0.77221 | Larger extent |
| Service quality | 3.4095 | 0.77221 | Medium extent |
| Valid N (list-wise) | |||
Source(s): Survey data
According to Table 7, students in Badulla, Jaffna, Kurunegala, and Matara are highly influenced by “PE” while using the e-learning system. Students in Anuradhapura, Batticaloa, and Colombo are highly influenced by the “SI” factor, whereas Kandy students are highly influenced by “SysQ” than other factors. Batticaloa and Rathnapura students are highly influenced by “IQ”.
Mean and standard deviation (regional centers)
| Performance expectancy | Effort expectancy | Social influence | System quality | Information quality | Service quality | |
|---|---|---|---|---|---|---|
| Anuradhapura | 3.3611 | 3.3704 | 3.5278 | 3.2778 | 3.4444 | 3.3056 |
| Badulla | 3.6667 | 3.4815 | 3.4444 | 3.4722 | 3.6389 | 3.3889 |
| Batticaloa | 3.3125 | 3.3333 | 3.4375 | 3.2500 | 3.4375 | 2.8125 |
| Colombo | 3.8966 | 3.6513 | 3.9167 | 3.6437 | 3.7644 | 3.4253 |
| Jaffna | 3.9375 | 3.0833 | 3.0625 | 3.3750 | 3.2500 | 3.8125 |
| Kandy | 3.3088 | 3.1961 | 3.5000 | 3.5294 | 3.4118 | 3.3676 |
| Kurunegala | 3.9239 | 3.6232 | 3.7283 | 3.5652 | 3.6848 | 3.6304 |
| Matara | 3.5938 | 3.2917 | 3.4688 | 3.0938 | 3.3125 | 3.0625 |
| Rathnapura | 3.2500 | 3.0000 | 3.1250 | 3.1250 | 3.5000 | 2.8750 |
Source(s): Survey data
4.2 Multiple regression analysis
The purpose of regression analysis is to find out the level of significance of the impact or influence of the independent variables on the dependent variable. Regression analysis was used to develop the equation which described the relationship between these variables.
As depicted in Table 8, adjusted R-value of 0.670 in the model implies that 67% of the observed variability in intention to use e-learning can be explained by the independent variables considered in the model; namely PE, EE, SI, SysQ, IQ and SQ. The remaining 33% of the variance in intention to use e-learning related to other variables were not considered in the model. The R2 value of 68.2% indicates the existence of numerous variables which can have an influence on intention to use e-learning, this could be referred to as scope for future research.
Model summary
| Model summary | ||||
|---|---|---|---|---|
| Model | R | R2 | Adjusted R2 | Std. error of the estimate |
| 1 | 0.726a | 0.682 | 0.670 | 0.48456 |
Note(s): a. Predictors: (Constant), SER_IND06, SI_IND03, PE_IND01, EE_IND02, INT_IND05, STQ_IND04
Source(s): Survey data
Table 9 indicates the coefficient of regression factor influence on intention to use e-learning. The coefficient of regression β is 0.229 for “PE” and the significant value is 0.005 (0.005 < 0.05). It indicates that if PE increases by one, then intention to use e-learning would increase by 0.229. This indicates that PE has a positive and significant impact on intention to use e-learning. The coefficient of regression β is 0.313 and Sig. value is 0.001 (0.001 < 0.05) for “EE”. It indicates that if EE increased by one, then intention to use e-learning would increase by 0.313. The coefficient of regression of EE has a positive impact on intention to use e-learning. The coefficient of regression β is 0.181 and Sig. value is 0.026 (0.026 < 0.05) for “SI”. It indicates that if SI increased by one, then intention to use e-learning would increase by 0.181 and this indicates that SI has a positive impact on intention to use e-learning. The coefficient of regression β is 0.233 and Sig. value is 0.003 (0.003 < 0.05) for “SQ”. Accordingly, this result indicates that SQ has a significant impact on intention to use e-learning. If SQ increased by one, then intention to use e-learning would increase by 0.233. The coefficients of regression of SysQ (Sig 0.656 > 0.05) and IQ (Sig 0.068 > 0.05) indicated that they do not significantly influence the intention to use e-learning. The summary of the hypotheses testing is depicted in Table 10.
Regression analysis
| Coefficients | ||||||
|---|---|---|---|---|---|---|
| Model | Unstandardized coefficients | Standardized coefficients | t | Sig. | ||
| β | Std. Error | Beta | ||||
| 1 | (Constant) | −0.096 | 0.218 | −0.440 | 0.660 | |
| Performance expectancy | 0.229 | 0.081 | 0.204 | 2.816 | 0.005 | |
| Effort expectancy | 0.313 | 0.089 | 0.262 | 3.526 | 0.001 | |
| Social influence | 0.181 | 0.081 | 0.175 | 2.243 | 0.026 | |
| System quality | −0.051 | 0.114 | −0.045 | −0.446 | 0.656 | |
| Information quality | 0.177 | 0.096 | 0.162 | 1.839 | 0.068 | |
| Service quality | 0.233 | 0.076 | 0.214 | 3.052 | 0.003 | |
Source(s): Survey data
Hypothesis testing
| H1a: Performance expectancy has a significant impact on learners' behavior intention to use e-learning | Accept | Regression analysis |
| H1b: Effort expectancy has a significant impact on learners' behavior intention to use e-learning | Accept | Regression analysis |
| H1c: Social influence has a significant impact on learners' behavior intention to use e-learning | Accept | Regression analysis |
| H1d: System quality has a significant impact on learners' behavior intention to use e-learning | Reject | Regression analysis |
| H1e: Information quality has a significant impact on learners' behavior intention to use e-learning | Reject | Regression analysis |
| H1f: Service quality has a significant impact on learners' behavior intention to use e-learning | Accept | Regression analysis |
Source(s): Developed by researcher
5. Conclusion
The outbreak of the coronavirus has become a major stumbling block in providing education across the world, compelling most institutions to cancel in-person classes and shift to online teaching. The Sri Lankan higher education sector has also made the move towards the adoption of e-learning systems during the pandemic. The Faculty of Management Studies of the OUSL has consequently made a remarkable transition to online education to overcome the challenges created by the Covid-19 pandemic. Thus, in the prevailing background, this research contributes in many ways by adding value to theory and practice. Although many studies explore the same problem with alternative variables, this study incorporated two models, namely the UTAUT model to provide insights into the factors that may influence the adoption of e-learning by learners, and the IS success model of DeLone and McLean (2003) to measure the success of the e-learning system.
As per this study, “PE” was the most determinant factor of “Behavioral Intention” to use an e-learning system. Furthermore, the findings indicate that “PE” positively and significantly affects the intention to use e-learning. This can be aligned with the findings of Alalwan et al. (2014) and Venkatesh (2000), where “PE” is found to be a factor that affects intention to use new technologies in operation. In a pandemic situation, students with high-performance expectations are more likely to accept online learning than those with low-performance expectations. This is because learners believe that e-learning materials such as quizzes, discussion forums, as well as video tutorials, will help them to engage in productive learning. In addition to which, discussion forums and Zoom/Microsoft Teams classes will enable collaborative learning with classmates. “EE,” “SI” and “SQ” also significantly influence the use of e-learning (Sharma et al., 2016; Zuiderwijk et al., 2015; Ali et al., 2018; Tarhini et al., 2017a, 2017b; Park and Kim, 2013). Although previous studies identified “SysQ” and “IQ” as important variables that affect the use of “e-learning” (Ahn et al., 2007; Alla and Faryadi, 2013; DeLone and McLean, 2003), the current study concluded that “SysQ” and “IQ” do not have a significant impact on intention to use e-learning during the pandemic period.
Moreover, the current study found that 65.6% of students have access to technology through mobile phones. This can be considered an important finding, as Sung et al. (2016) observed that students most often used laptops to do homework, finish assignments and take notes. Furthermore, it was observed that 53.4% of students have engaged in e-learning for the first time. This can be construed as mainly due to restrictions imposed during the Covid-19 pandemic. This finding can be considered as important, as the study conducted by Zalat et al. (2021) also argued that the unexpected pandemic has changed the landscape prevalent thus far in developing countries.
Most of the respondents (93.9%) were in the ranges of good and excellent in computer literacy. And interestingly, Colombo, Kurunegala and Kandy represented the majority of students who responded to this study. This aligns with the findings of the Census and Statistics of Sri Lanka (2018) as Colombo (42.6%), Kandy (34.8%) and Kurunegala (29.1%) are well above the national average (27.5%) in terms of computer literacy rate. Moreover, in the future, researchers can conduct extended studies to test this result with alternative uncertainties, using different models. In addition to this, researchers identified different factors that could have an impact on the use of e-learning in different regional centers; for example, students attached to the Anuradhapura, Batticaloa and Colombo centers are highly influenced by the “SI” factor, whereas Kandy students are highly influenced by “SysQ” than by other factors. This can be further investigated in future studies.
The above findings suggest some obstacles such as the problem of not having adequate facilities in IT (such as bandwidth problems), which may be considered as important to address. Accordingly, it is imperative to improve IT facilities available at all regional centers; this may be done by upgrading the Internet bandwidth provided and by establishing more and added Wi-Fi access points within the campus premises (Samsudeen and Mohamed, 2019). Also the ability of the students to purchase equipment such as laptops and smartphones in relation to their income levels also needs to be explored as one of the obstacles. Students could be encouraged and assisted to access and use e-learning systems by implementing mechanisms to facilitate vendors involved in the selling of laptops, smartphones, etc., for instance, to sell devices to students supported by installment payment or loan schemes backed by government-owned, or even private, banks; or other similar mechanisms put into place in collaboration with the Education Ministry of Sri Lanka.
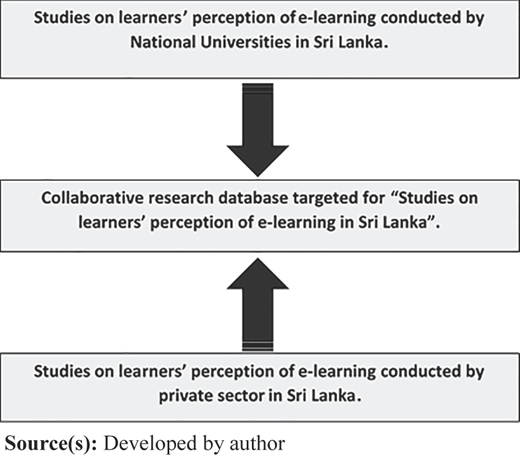
Ultimately, these strategies would inspire and encourage students' usage and practice of e-learning systems (Kuruppuarachchi et al., 2017). Further, the researcher recommends conducting awareness programs on e-learning during students' registration process, as well as at orientation programs. And also, there should be future research expanding this study to other faculties of the Open University, and throughout Sri Lanka. The following model (see Figure 3) which researchers have created from a database of collaborative studies (in the public and private sectors in Sri Lanka) can be proposed for utilization to observe common problems in the education sector which are encountered in pandemic situations.