Skip to article sections
Purpose

This study aims to examine the gender gaps in intergenerational educational mobility across 23 OECD countries and identify whether and to what extent cognitive and noncognitive skills contribute to these.

Design/methodology/approach

Using PIAAC II Cycle data, this study builds four mobility measures and applies the Oaxaca–Blinder decomposition to assess the role of skills in gender differences in mobility.

Findings

Men display lower educational mobility than women in nearly all countries. In the explained component of the gap, cognitive skills, particularly numeracy, are the main contributors, generally favoring men. Noncognitive traits like conscientiousness and open-mindedness follow, typically contributing to women’s mobility.

Originality/value

To the best of the authors’ knowledge, this is the first cross-country study to jointly examine the role of cognitive and noncognitive skills in shaping gender gaps in educational mobility, highlighting the relevance of skill-building.

The increasing recognition that skills are fundamental to social and economic outcomes has fueled interest in their gendered distribution. Extensive research on cognitive skill proficiency reveals large gender gaps that vary across countries, life stages and skill domains (Encinas-Martín and Cherian, 2023). Among school students, girls tend to outperform boys in reading, while the reverse holds true for numeracy. As students approach university, the reading gap narrows significantly, whereas the gender gap in numeracy tends to widen (Borgonovi et al., 2021). Noncognitive skills – such as personality traits, motivation and beliefs – also differ considerably by gender (Rammstedt et al., 2017). Women tend to score higher in agreeableness, conscientiousness and extraversion and lower in emotional stability, with more consistency across countries (Flinn et al., 2025; Weisberg et al., 2011).

Both types of skills are strongly associated with a wide range of life outcomes. Cognitive skills such as numeracy are linked to wages, education, health and social outcomes (Hanushek et al., 2015; Vera‐Toscano et al., 2017). Noncognitive skills show similar relevance: they have been associated with labor market participation, job stability, trust and well-being (Palczyńska and Swist 2018; Rammstedt et al., 2017). Therefore, gender gaps in skills are seen as “pervasive” barriers to gender parity (Battisti et al., 2023).

Specifically in education, these gaps sometimes work in the advantage of women rather than in men’s (Bertrand, 2011; Aucejo and James, 2021; Edwards et al., 2022). Such is the case of educational achievement and attainment. Trends show that women now consistently outperform men in education, a pattern often referred to as “the boy problem” (Delaney and Devereux, 2021), with cognitive and noncognitive traits playing a key role as an underlying driver (Bertrand, 2011). Studies such as Heckman and Kautz (2012) and Blanden et al. (2007) are pioneers at incorporating the role of skills in social and economic outcomes. These view skills as fundamental endowments that influence productivity, behavior and as a mechanism of transmission of advantage across generations (Blanden et al. 2007; Almlund et al., 2011).

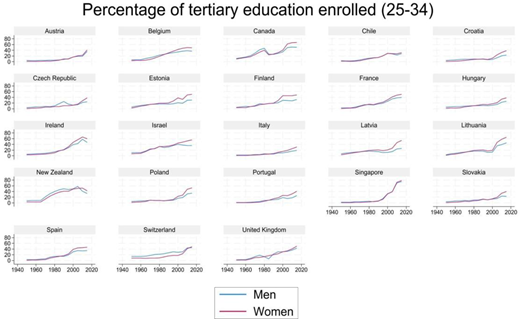
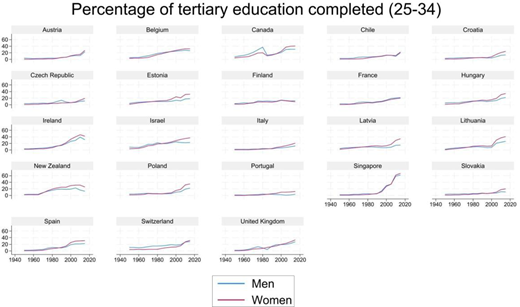
The growing interest in the role of skills is also related to the observed reduction in educational inequalities between men and women observed in recent decades. According to Barro and Lee (2013) data (summarized in Figures A1 and A2 in  Appendix), while during 1950s and 1960s, men had higher tertiary attainment than women, by the early 2020s, they were overtaken by women in most OECD countries. Among young adults, the tertiary attainment gap is now clearly in favor of women. In fact, it is worth mentioning that in most countries, women overtake men earlier and by a larger margin in enrolment than in completion. This suggests that the female advantage is driven primarily by higher entry and persistence rather than by differential completion conditional on entry alone. The fact that the reduction in educational gender inequalities has occurred during a period of rapid expansion also supports the idea that massification interacted with changing gender norms, labor-market incentives and institutional access to produce the observed reversal. However, the literature [1] is not conclusive regarding how this reduction in gender educational inequalities translates into a higher intergenerational mobility for women and what role cognitive and noncognitive skills could play as a relevant factor to explain gender differences.

In fact, despite the increasing body of research linking skills to educational attainment the role of skills in shaping intergenerational mobility has received limited attention. Recent contributions in the literature on intergenerational mobility highlight persistent, yet complex, gender disparities. Women tend to experience higher educational mobility than men across many high-income countries (Hu and Qian, 2023; Duong, 2024) and in some developing economies (Leone, 2021; Torche, 2015). Moreover, while trends for women point to rising mobility across various measures, those for men are mixed (Van der Weide et al., 2024), suggesting that the “boy problem” may extend to an intergenerational phenomenon.

While the main mechanism through which cognitive and noncognitive skills may affect intergenerational mobility is precisely via their relation to the education of daughters and sons, [2] the literature has also identified additional potential channels. Conditional on parental education, cognitive skills affect educational attainment primarily through academic performance and eligibility thresholds (Heckman et al., 2006), while noncognitive skills influence persistence, behavior and educational decision-making (Almlund et al., 2011). Because these skills are complementary (Cunha and Heckman, 2007), educational attainment reflects not only ability but also the capacity to sustain effort and respond to challenges, even among children from similar family backgrounds. Moreover, if girls display stronger noncognitive skills and as educational institutions reward these traits (Cornwell et al., 2013), the same skill endowment [3] could yield higher educational attainment for girls than for boys, affecting gender differences in intergenerational educational mobility.

This study addresses this question by analyzing data from 23 OECD countries using the second cycle of the Programme for the International Assessment of Adult Competencies (PIAAC). We compute four distinct measures of educational mobility and find that in nearly all countries, men show lower mobility than women – with Switzerland as the only exception. Using a statistical decomposition approach, we show that cognitive skills are the primary contributors to gender differences in mobility, followed by noncognitive skills, which in some cases, rival the influence of household background. These findings underscore the potential of skill-building policies to better understand gender mobility gaps across generations.

The remainder of the study is structured as follows. Section 2 describes the data source and methodological considerations, Section 3 presents descriptive evidence of the gender gaps in intergenerational mobility, cognitive and noncognitive skills. Section 4 proceeds to present the association and contribution of skills to mobility. Section 5 provides concluding remarks.

The data source used in this study is the second cycle of the PIAAC, delivered from September 2022 to August 2023 to the adult population aged 16–65 living in participating countries. The program adopts a stratified sampling design that is country-specific but complies with the PIAAC Technical Standards and Guidelines such that the data is representative of the adult population and its quality allows for international comparisons (OECD, 2022).

Respondents go through a background questionnaire and a tablet-based assessment of three key cognitive skills. This study uses the scores of literacy and numeracy skills. Each of them is assessed on a 500-point scale. The data set provides ten plausible values for each skill and respondent. We use piaactools Stata package to obtain unbiased estimates of the descriptive statistics of skills. All other estimates are obtained using final replication weights.

This study also uses information from the background questionnaire to calculate intergenerational mobility and to capture explanatory variables, including the five personality traits: extraversion, agreeableness, conscientiousness, negative emotionality and open-mindedness. Table A1 in  Appendix provides a description of all the variables involved in the study. It is worth mentioning that, although cognitive and noncognitive skills are measured in adulthood, a large body of evidence [4] shows that these skills reflect relatively stable traits rooted in early-life endowments and family background. Cognitive ability and personality traits exhibit substantial heritability and high rank-order stability over the life cycle. Consequently, adult skill measures partly capture pre-education characteristics that are themselves shaped by parental education, rather than being solely outcomes of educational attainment.

There were 31 countries participating in the second cycle of PIAAC, out of which 28 countries implemented the Big Five module. Due to lack of access to key information for the analysis, the total number of countries that we are able to incorporate in the study is 23. Three other restrictions in our sample were limiting it to those aged 25–65 to exclude respondents who continue studying, excluding respondents in the “doorstep interview” since they do not report parental information and excluding foreign-born adults. The latter aims to avoid distortion in our sample since the measurement of educational attainment often differs significantly between native and immigrant populations. As a result, we are left with 72% of the sample in the selected countries. Table A2 in  Appendix displays descriptive statistics of all the variables by country.

With our sample definition, we are left with a total sample size of 88,893 individuals for the 23 countries. Men and women are equally represented across countries, and in some, women make up to 60% of the sample (Ireland, Latvia, Lithuania). In general, a larger share of the sample of both children and parents is concentrated in the secondary education level. They are more or less equally distributed across age groups, although in some countries, there is a larger share of respondents aged 55–64.

A key decision when measuring intergenerational mobility is how to define parental education. While some studies show different results when comparing mothers versus fathers’ education (Hu and Qian, 2023), we adopt a widely used approach that considers the highest level of education attained by either parent. This composite measure captures the educational background of the most advantaged parent and aligns with the dominance principle commonly applied in sociological research (Erikson, 1984).

We rely on four measures that reflect two conceptual approaches to mobility: origin-dependence and positional mobility. The origin-dependence perspective assesses the strength of association between parents’ and children’s educational levels using regression and correlation coefficients. To make these measures more interpretable as indicators of mobility (rather than persistence), we follow Van der Weide et al. (2024) and use their complements – 1-BETA and 1-COR – so that higher values indicate greater mobility. By contrast, the positional approach captures changes in educational rank across generations. We construct indicators of upward and downward mobility based on whether individuals attain higher or lower education levels than their most educated parent. This is applied in studies like Oberdabernig and Schneebaum (2017) and Liu and Ding (2020).[5]

All four measures are based on harmonized three-level education variables for both generations, using the International Standard Classification of Education (ISCED). For parents, PIAAC provides separate information for mothers and fathers in three categories: less than upper secondary, upper/post-secondary nontertiary and tertiary. These are combined into a single indicator reflecting the highest level attained by either parent. For children, we construct a comparable three-level variable from the detailed education data available in PIAAC.

To understand the difference in the probability of intergenerational mobility between males and females, we apply the Oaxaca–Blinder decomposition technique (Blinder, 1973; Oaxaca, 1973). To carry out this exercise, we select the two positional measures of intergenerational mobility. Hence, we are looking to decompose the difference between daughters and sons in the probability of having higher (upward) or lower (downward) education than the most educated parent.

The decomposition method is used to analyze differences in an outcome variable between two groups by separating the observed gap into two components. The explained component (also called the endowment effect) captures the part of the difference attributable to variations in the distribution of observable characteristics across the two groups. This reflects how differences in endowments, such as cognitive and noncognitive skills, contribute to the overall gap. The unexplained component accounts for differences in the returns to these characteristics. This represents factors such as structural inequalities, discrimination or unobserved heterogeneity, which are not directly linked to the distribution of explanatory variables. It should be noted that the results of this decomposition are descriptive and do not allow for a causal interpretation.

Given the nature of our variables of intergenerational mobility, we will follow the approach by Yun (2004), who proposes an application of the Oaxaca–Blinder decomposition for nonlinear models. The approach starts by estimating a logit model for males and females separately in each country in our sample, as represented by:

(1)

where Λ is the logistic function linking the probability of upward (or downward) mobility (Y=1) to the covariates included in X. The mobility gap between females and males is then decomposed into:

(2)

where for i individuals, Λ(Xβ)_=1/NiN(Xiβ^).

We use the standard Oaxaca command by Jann (2008), which has been extended for the application of this approach. As covariates in X we include, apart from cognitive and noncognitive skills, the respondent’s age and retrospective information about the respondent’s household when he was 14, following the literature (e.g. Chetty et al., 2014) as listed in Tables 1 and 2.

For the detailed decomposition, the variables are grouped as follows: age (age groups in ten-year bands), household background (books at home, parental occupation and number of siblings at home when the respondent was 14), cognitive skills (numeracy and literacy scores) and noncognitive skills (the Big 5 scores). Scores for numeracy and literacy in the decomposition are introduced as the average of the ten plausible values provided by PIAAC[6].

In Table 1, we present evidence on gender differences in educational mobility, cognitive skills and noncognitive skills. In terms of dependence measures (1-BETA and 1-COR), men exhibit higher mobility in over half of the countries – most notably Croatia, Latvia and Austria – while women lead in Italy, Finland and New Zealand. However, this higher mobility among men reflects weaker associations between their and their parents’ education, not necessarily greater upward movement.

When we turn to positional mobility (downward and upward), the patterns shift. Women are more likely to surpass their parents educationally in 21 countries, while men are more prone to downward mobility in 20 countries, with particularly stark differences in Estonia and Lithuania. This upward mobility among women is usually matched by a downward trend among men, although it is not always the case, e.g. Poland. These findings echo recent research highlighting how men are increasingly disadvantaged in educational attainment.

Turning to the gender gaps in cognitive skills. These reveal a consistent male advantage in numeracy in 21 countries, averaging 3.3% (8.9 points), and reaching twice that in Switzerland and the UK. By contrast, literacy gaps favor women in 17 countries, but the average difference is smaller – around 1.2% (3 points). These patterns mirror disparities in educational attainment, particularly in countries like Finland and Estonia, where women’s advantage in literacy aligns with higher tertiary attainment. Notably, numeracy gaps are more pronounced and more consequential in shaping educational trajectories.

Regarding the gender differences in noncognitive skills, we observe that women score higher in agreeableness and conscientiousness in most countries, while men score higher in emotional stability across all. Differences in open-mindedness and extraversion are less consistent, with insignificant gender gaps in nearly half the countries. These results are nuanced and highly country- and trait-specific. For instance, France, Hungary and Italy show marked gender gaps in emotional stability but not in other traits. As argued by Rammstedt et al. (2025), this reflects broader cultural differences in personality development across societies. Overall, while some patterns in cognitive and noncognitive skills are broadly shared, others are shaped by context-specific factors that influence educational outcomes in gendered ways.

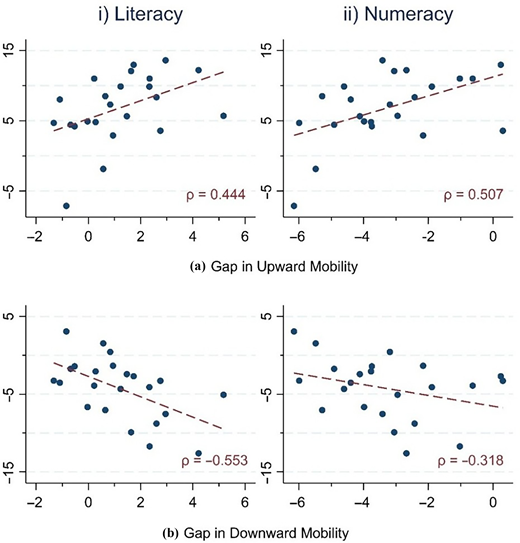
Figure 1 plots the relationship between the measures of intergenerational mobility and the disparities in literacy and numeracy skills, respectively. With respect to the gap in upward mobility, we observe a positive association, while the oppositive is observed for the gap in downward mobility. This entails that the comparative advantage for women in educational mobility increases in countries where the female advantage in literacy skills is higher and the male advantage in numeracy is lower. These patterns support prior studies documenting that cognitive skills are associated with intergenerational mobility in different ways. Specifically, Aucejo and James (2021) show that literacy-related skills, namely, verbal proficiency, disproportionately influence the gender gap in university enrolment and completion. Our results may shed light on how this in turn affects intergenerational mobility prospects for women. On the other hand, we also see that the smaller male advantage in numeracy may enable pathways for women’s educational mobility.

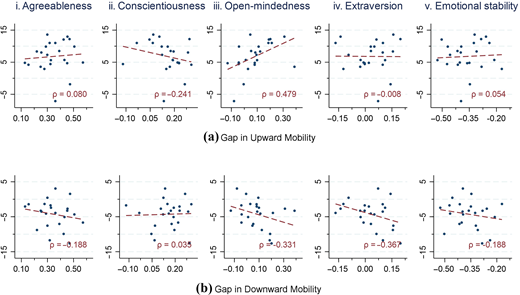
We now turn our attention to Figure 2, which plots the relationship between the measures of intergenerational mobility and the Big Five traits. Prior research shows that compared to cognitive skills, noncognitive skills present lower correlations with indicators of educational achievement (Rammstedt et al., 2024). This includes educational mobility (Mood et al., 2012). Our results show that the trait most associated with the female advantage in upward mobility is open-mindedness (positively), followed by a negative association with conscientiousness (top Panel A); while the trait that stands out with the male disadvantage in downward mobility is extraversion and, to a similar extent, open-mindedness (Panel B).

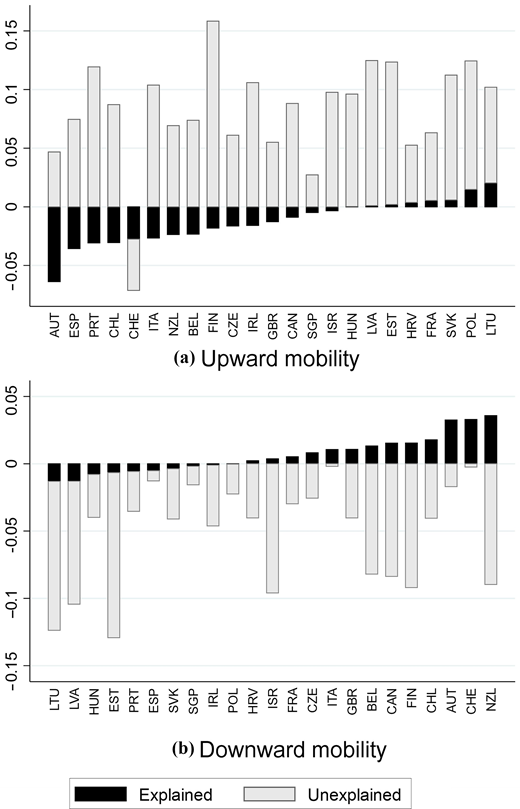
Figure 3 summarizes the decomposition of the gender gap in upward and downward mobility. This provides insights into whether the observed differences arise from the distribution of characteristics (explained part) or from differences in the returns to those characteristics (unexplained part). The analysis of upward mobility confirms a significant gap in 19 countries, favoring women in 18 of them. By contrast, downward mobility shows a statistically significant male disadvantage in 17 countries. In both cases, gender gaps are shaped by a combination of both explained and unexplained components.

For upward mobility, the explained part accounts for a smaller portion – ranging from 1% (Hungary, Latvia) to around 50%–60% in Spain and Switzerland. The direction of the explained component varies across countries: in most, it is negative, indicating that the distribution of characteristics decreases women’s advantage. Spain stands out as a notable example of this. By contrast, countries like Lithuania and Poland show a positive explained component, where the distribution of endowments reinforces women’s higher mobility. Still, in all cases, the differential returns to characteristics continue to play an important role.

In the case of downward mobility, males are more likely to achieve lower education levels than their parents in most countries. The explained part varies widely – from 1% (Poland) to 40% (New Zealand) – and can either reinforce or mitigate the male disadvantage. Austria, Italy and Switzerland stand out as the only countries where the explained component outweighs the unexplained part in absolute terms. In others, it contributes in different directions: for example, it reduces the male disadvantage in Switzerland and New Zealand but reinforces it in several others.

This tells us that in absence of differences in the rewards to endowments, endowments will decrease the female advantage in mobility in favor of males. In other words, the observed gender gaps cannot be fully accounted for by differences in characteristics alone. Rather, the unexplained component – which likely reflects structural or institutional factors, differential treatment or unobserved characteristics – remains a dominant driver in most countries. Its positive sign in the case of upward mobility indicates that women receive higher returns to their endowments than men, while in downward mobility, the consistently negative unexplained component reinforces the male disadvantage. These patterns highlight that even when women and men present similar observable traits, their outcomes diverge substantially due to how these traits are valued. Figure S1 in the Supplementary material presents the confidence intervals for the estimated explained and unexplained parts of the gap.

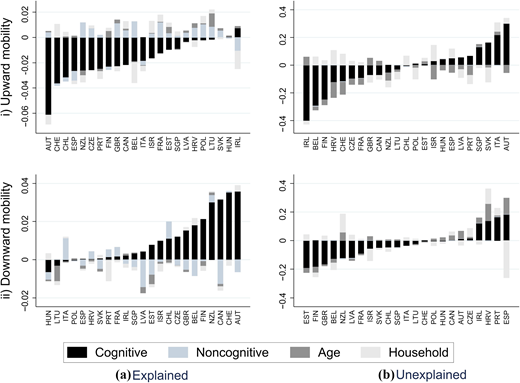
Figure 4 presents the contribution of grouped covariates to the explained (Panel A) and unexplained (Panel B) components of the gender gap in both upward and downward mobility. Numerical details are available in  AppendixTables 3 and 4. In both types of mobility, cognitive skills emerge as the most influential factor across countries, followed by noncognitive skills.

Within the explained component, their contribution is not only consistently high but also generally opposed to the sign of the gap. That is, negative for upward mobility and positive for downward mobility, indicating that they counterbalance the female advantage in both measures. For both measures, the role of cognitive skills outweighs that of noncognitive.

However, the contribution of noncognitive skills to the explained part of the measures of mobility differ. While for most countries noncognitive skills appear to reinforce the female advantage for upward mobility, there are exceptions for downward mobility. These exceptions are Italy and Chile, and Portugal and France to a lesser extent, where noncognitive skills not only predict a lower probability of downward mobility for males, but they are larger than the contribution of cognitive skills, hence resulting in smaller disadvantages for these countries.

In the unexplained component (Panel B), cognitive skills again stand out as the main factor shaping gender disparities in both upward and downward mobility, followed by household characteristics. By contrast, the role of noncognitive skills is negligible in this component.

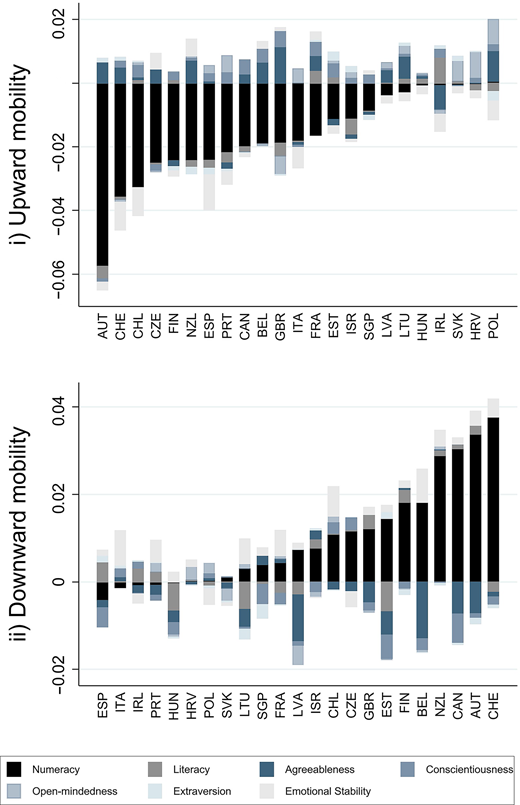
To delve deeper into the role of cognitive and noncognitive skills to the gender gaps in mobility, Figure 5 (detailed in Tables A3 and A4) presents the contribution of these skills to the explained part of the disparities in both upward and downward mobility. Within the category of cognitive skills, it is numeracy proficiency that consistently drives the effect both.

In the case of upward mobility, numeracy skills always display a statistically significant and negative sign, while displaying a positive sign for downward mobility, aligning to Figure 1. The separate regressions (Tables S1 and S2 in the Supplementary material) show that numeracy skills contribute positively to the upward mobility of both men and women, but with a slightly stronger effect for men. This coheres our descriptive findings and explains why countries with larger gender gaps in numeracy proficiency (in favor of men), such as Switzerland, the UK and Austria, tend to display the smallest female advantage in upward mobility. Conversely, in countries where men’s advantage in numeracy is smaller or null – such as the Slovak Republic, Poland and Lithuania – women enjoy the greatest upward mobility advantage. However, in parallel, we observe that in countries where men have a greater numeracy advantage – Switzerland, Austria, the UK, Czech Republic – they face a lower risk of downward mobility compared to women (separate regressions in Supplementary material Tables S3 and S4). By contrast, in countries where this advantage is smaller or reversed – Poland, Croatia, Slovak Republic, Lithuania – men experience a greater risk of downward mobility.

These cross-sectional patterns suggest that gender gaps in numeracy and mobility tend to move together in complex rather than uniform ways. While these correlations should not be interpreted causally, they nonetheless point to a potential linkage worth further examination. In this context, policies that influence numeracy skill development could shape these patterns in different directions: efforts to narrow numeracy gaps may be associated with an increase in women’s relative mobility advantage, whereas leaving numeracy gaps unaddressed may coincide with an improvement in men’s mobility. Delaney and Devereux (2021) show that numeracy-oriented interventions have been effective in improving boys’ school performance, which resonates with the correlational patterns documented here.

The contribution of literacy proficiency is also complex. While the decomposition shows a small to null role, the regressions (on Tables S1 and S2) show that literacy is positively associated with women’s upward mobility but negatively associated with men’s. This echoes prior research by Aucejo and James (2021), pointing to the relevance of literacy for women’s educational attainment. However, since our decomposition uses pooled coefficients, the opposing effects for men and women attenuate the overall contribution of literacy to gender disparities in upward mobility.

Turning to the role of noncognitive skills. In the case of upward mobility, Poland stands out as the country where all Big Five traits are significant contributors to the explained part of the gap. In most other countries, open-mindedness is the main contributor, followed by conscientiousness, both favoring the female advantage. This is in line with the descriptive results presented in Figure 2 for conscientiousness, while the contribution of open-mindedness becomes relevant only after controlling for a range of characteristics. Importantly, Figure 5 allows us to see that the contribution of noncognitive skills to the gap surpasses that of literacy skills in most countries.

Regarding downward mobility, the most influential noncognitive contributors to men’s disadvantage are agreeableness and conscientiousness. These findings are consistent with the evidence that women tend to score significantly higher in these traits than men (Rammstedt et al., 2025). In general, we observe that noncognitive skills favor women’s mobility prospects.

Comparing panels (i) and (ii), we see that the contribution of certain noncognitive skills can be as large as that of cognitive skills, depending on the outcome measure and the country, concurring with existing research by Rammstedt et al. (2017) and Rammstedt et al. (2024). All in all, noncognitive skills appear more relevant for downward mobility as its role is comparable or even stronger than that of numeracy for downward mobility in about half of the countries. In the rest of the countries, where numeracy dominates, the contribution of noncognitive skills still exceeds that of literacy.

We have conducted robustness checks by replacing the combination of parental education with the father’s education and the mother’s education, respectively, to measure upward and downward mobility. With these alternative measures of mobility, we have then performed the Oaxaca decomposition. The results are qualitatively the same in that cognitive skills are the main contributor to the gap, followed by noncognitive skills; within cognitive skills, it is numeracy the one driving the effect. Furthermore, when comparing literacy to noncognitive skills, the latter are usually more relevant to the gap. These results are available upon request to the authors.

Through different measures of intergenerational mobility, this study shows that women hold an advantage in educational intergenerational mobility across 23 high-income countries. Despite daughters’ educational attainment is more dependent on their parents compared to sons, given the trends of the gender gap in educational attainment (Narayan et al., 2018) and that mother-child associations are stronger than father–child (Hu and Qian, 2023), this would often reflect the intergenerational transmission of high educational attainment for women. Furthermore, when they experience intergenerational mobility, daughters are more likely to surpass the attainment of their most educated parent, while sons are more likely to have lower attainment than their parents. We also report the well-known gender differences in cognitive and noncognitive skills and their contribution to the gender differences in intergenerational mobility. Three results stand out from this analysis.

First, as is the case for other adult outcomes, cognitive skills are in most countries more important than noncognitive skills for intergenerational mobility. These are more important than household characteristics when the respondent was a teen, which is usually a prominent determinant of mobility levels (Chetty et al., 2014). Furthermore, our results reveal a dual role of numeracy skills in shaping the gendered pathways to educational mobility. The descriptive and decomposition results point that countries where males hold a larger numeracy advantage, their relative risk of downward mobility is lower, while their relative disadvantage in upward mobility is reduced. These patterns suggest the complex relationship of cognitive skills with adult outcomes. Not only they contribute differently to these measures of mobility, but they differ in their association with other outcomes such as STEM participation (Encinas-Martín and Cherian, 2023). This complexity in turn underscores a challenge for policy design as addressing gaps in numeracy may not yield uniform benefits across outcomes and countries.

Second, when breaking down our results, we find that despite having a smaller explanatory power compared to numeracy, the role of noncognitive skills is more heterogeneous. First, they are more relevant to the gender gap in intergenerational mobility than household characteristics and literacy across most countries. Importantly, in some countries, they can be as important as numeracy for downward mobility. Third, they act in favor of the female advantage in educational mobility. This finding supports the cost-related explanation for the “boy problem” of lower attainment, where women’s superior noncognitive skills imply lower costs of schooling (Delaney and Devereux, 2021), allowing them to perform better, and as suggested by our results, achieve intergenerational gains. The finding is relevant to policy making as there is evidence suggesting that these skills are not as hereditary as cognitive skills, and that they are malleable to some extent (Anger, 2011); hence, there is room for building this trait. Our findings point to the relative importance of conscientiousness and open-mindedness for upward mobility, in addition to agreeableness for downward mobility. Regarding conscientiousness especially, there is broad evidence of effective interventions, modifying it in desirable ways for enhanced educational outcomes (Kim et al., 2016).

Third, we find that there is a sizable portion of the gender gap in mobility that the characteristics included in our analysis are not able to explain, which has also been found in the context of explaining the gap in wages (Paccagnella, 2015). This unexplained component actually acts in favor of women’s advantage, which calls for further analysis of other characteristics that may contribute to explain the gap. This includes individual information such as educational aspirations, and contextual information such as gender equality and social policy indicators. Evidence shows that the latter have a role in the differences in intergenerational mobility among natives and migrants, for instance Shapira (2012). Since this component of the gender gap in mobility refers to the structure of the returns to education, this finding may also back up the cost-related explanation for the “boy problem,” where women’s higher educational attainment is motivated not only by the differences in the distribution of their characteristics but also by the differences in how their characteristics are rewarded and values in the education system. Therefore, future work could also expand on this by exploring what is behind the rewarding structure. For instance, specific policies that motivate women’s attainment such as affirmative action policies.

To close up, it is important to acknowledge that this study is descriptive in nature and does not allow for causal claims. Establishing causality would require longitudinal data that track individuals’ skills and outcomes over time. These data are essential to disentangle questions like whether individuals with higher cognitive skills are more likely to exceed their parents’ educational attainment, or whether attaining higher education than one’s parents subsequently contributes to the development of cognitive skills. Evidence from research linking childhood data from PISA with adulthood data from PIAAC – for instance Borgonovi et al. (2021) – further underscores the value of a longitudinal perspective since the disparities in numeracy skills tends to widen with age.

The supplementary material for this article can be found online.

[1.]

Breen and Goldthorpe (1997) stated that one potential explanation is related to the fact that women in earlier cohorts were more likely to have maintained their intergenerational status through marriage than through gainful employment. On the contrary, for women in younger cohorts, education and the improved labor market outcomes associated with it could be reflected in higher upward mobility rates, closing the gap with men. However, Nennstiel and Becker (2023) found that the relative mobility patterns of men and women appeared to be very similar.

[2.]

Lundborg et al. (2018) find strong evidence on the effect of parental education on cognitive skills and noncognitive skills on children’s education, suggesting that a major part of the transmission of education across generations runs through improved capacities of children. The findings by Mendez and Zamarro (2018) also demonstrate that the intergenerational transmission of certain noncognitive skills plays a prominent role in determining individuals’ final educational level.

[3.]

Plomin and Deary (2015) demonstrate that genetic factors explain a large share of variance in adult cognitive ability. Deary et al. (2007, 2014) find evidence of the early emergence and persistence of skills differences among children. In particular, they found that childhood IQ is a very good predictor of adult IQ and educational outcomes with remarkable stability over the life cycle. Regarding noncognitive skills, Soto et al. (2011) find that big five traits show a high stability from young adulthood onwards. Last, the role of family background to shape both cognitive and noncognitive skills long before educational choices has also been highlighted by Cunha and Heckman (2007) and Duncan and Magnuson (2012), among others.

[4.]

For the whole sample, the proportion of immobility (those son/daughters with the same level of studies of his/her most educated parent) is 52.6% for men and 48.7% for women, implying that women are more mobile than men. This difference comes from a higher proportion of women who have experienced upwards mobility than men, but also because of a lower downward mobility in relative terms. It is worth noting that, by definition, the sum of the values of the gender gap for immobility, upward and downward mobility is equal to zero.

[5.]

Although the use of average plausible values for skills in large-scale assessments does not capture the imputation uncertainty that arises from multiple plausible value draws and may understate standard errors of estimates presented here, the OECD (2009) notes that this effect is relatively small in large samples. In fact, Jerrim et al. (2017), among others, refer to this as a nonsubstantial impact.

[6.]

Although it is difficult to look at how much of the total gender gap in mobility is explained by skills because the contribution can vary in direction and magnitude, our results suggest that this could range from total gap is composed of 20% to 85% depending on the country.
Almlund
,
M.
,
Duckworth
,
A.L.
,
Heckman
,
J.J.
, and
Kautz
,
T.
(
2011
), “Personality psychology and economics”,
Handbook of the Economics of Education
,
4
, pp.
1
-
181
, doi: .
Anger
,
S.
(
2011
), “
The intergenerational transmission of cognitive and non-cognitive skills during adolescence and young adulthood
”,
SSRN Electronic Journal
.
Aucejo
,
E.
and
James
,
J.
(
2021
), “
The path to college education: the role of math and verbal skills
”,
Journal of Political Economy
, Vol.
129
No.
10
, pp.
2905
-
2946
, doi: .
Barro
,
R.
and
Lee
,
J.-W.
(
2013
), “
A new data set of educational attainment in the world, 1950-2010
”,
Journal of Development Economics
, Vol.
104
, pp.
184
-
198
.
Battisti
,
M.
,
Fedorets
,
A.
and
Kinne
,
L.
(
2023
), “
Cognitive skills among adults: an impeding factor for gender convergence?
”,
SSRN Electronic Journal
.
Bertrand
,
M.
(
2011
), “
New perspectives on gender
”,
Handbook of Labor Economics
, Vol.
4
, pp.
1543
-
1590
.
Blinder
,
A.S.
(
1973
), “
Wage discrimination: Reduced form and structural estimates
”,
The Journal of Human Resources
, Vol.
8
No.
4
, pp.
436
-
455
, doi: .
Borgonovi
,
F.
,
Choi
,
Á.
and
Paccagnella
,
M.
(
2021
), “
The evolution of gender gaps in numeracy and literacy between childhood and young adulthood
”,
Economics of Education Review
, Vol.
82
, p.
102119
, doi: .
Breen
,
R.
and
Goldthorpe
,
J.H.
(
1997
), “
Explaining educational differentials: towards a formal rational action theory
”,
Rationality and Society
, Vol.
9
No.
3
, pp.
275
-
305
, doi: .
Chetty
,
R.
,
Hendren
,
N.
,
Kline
,
P.
and
Saez
,
E.
(
2014
), “
Where is the land of opportunity? The geography of intergenerational mobility in the United States
”,
The Quarterly Journal of Economics
, Vol.
129
No.
4
, pp.
1553
-
1623
, doi: .
Cornwell
,
C.
,
Mustard
,
D.B.
and
Van Parys
,
J.
(
2013
), “
Noncognitive skills and the gender disparities in test scores and teacher assessments: evidence from primary school
”,
Journal of Human Resources
, Vol.
48
No.
1
, pp.
236
-
264
, doi: .
Cunha
,
F.
and
Heckman
,
J.
(
2007
), “
The technology of skill formation
”,
American Economic Review
, Vol.
97
No.
2
, pp.
31
-
47
, doi: .
Deary
,
I.J.
,
Strand
,
S.
,
Smith
,
P.
and
Fernandes
,
C.
(
2007
), “
Intelligence and educational achievement
”,
Intelligence
, Vol.
35
No.
1
, pp.
13
-
21
, doi: .
Delaney
,
J.M.
, and
Devereux
,
P.J.
(
2021
), “The economics of gender and educational achievement: Stylized facts and causal evidence”, In
Oxford Research Encyclopedia of Economics and Finance
, doi: .
Duncan
,
G.J.
and
Magnuson
,
K.
(
2012
), “
Socioeconomic status and cognitive functioning: moving from correlation to causation”, Duncan, G.J., Magnuson, K. (2012), “socioeconomic status and cognitive functioning: moving from correlation to causation
”,
WIREs Cognitive Science
, Vol.
3
No.
3
, pp.
377
-
386
.
Duong
,
K.
(
2024
), “
What really matters for global intergenerational mobility?
”,
Plos One
, Vol.
19
No.
6
, p.
e0302173
, doi: .
Edwards
,
R.
,
Gibson
,
R.
,
Harmon
,
C.
and
Schurer
,
S.
(
2022
), “
First-in-their-family students at university: Can non-cognitive skills compensate for social origin?
”,
Economics of Education Review
, Vol.
91
, p.
102318
, doi: .
Encinas-Martín
,
M.
, and
Cherian
,
M.
(
2023
),
Gender, Education and Skills: The Persistence of Gender Gaps in Education and Skills (OECD Skills Studies)
,
OECD Publishing
, doi: .
Erikson
,
R.
(
1984
), “
Social class of men, women and families
”,
Sociology
, Vol.
18
No.
4
, pp.
500
-
514
, doi: .
Flinn
,
C.J.
,
Todd
,
P.E.
and
Zhang
,
W.
(
2025
), “
Labor market returns to personality: a job search approach to understanding gender gaps
”,
Journal of Political Economy
, Vol.
133
No.
4
, pp.
1169
-
1234
, doi: .
Hanushek
,
E.A.
,
Schwerdt
,
G.
,
Wiederhold
,
S.
and
Woessmann
,
L.
(
2015
), “
Returns to skills around the world: Evidence from PIAAC
”,
European Economic Review
, Vol.
73
, pp.
103
-
130
, doi: .
Heckman
,
J.J.
and
Kautz
,
T.
(
2012
), “
Hard evidence on soft skills
”,
Labour Economics
, Vol.
19
No.
4
, pp.
451
-
464
, doi: .
Heckman
,
J.J.
,
Stixrud
,
J.
and
Urzua
,
S.
(
2006
), “
The effects of cognitive and noncognitive abilities on labor market outcomes and social behavior
”,
Journal of Labor Economics
, Vol.
24
No.
3
, pp.
411
-
482
, doi: .
Hu
,
Y.
and
Qian
,
Y.
(
2023
), “
Gender, education expansion and intergenerational educational mobility around the world
”,
Nature Human Behaviour
, Vol.
7
No.
4
, pp.
583
-
595
, available at: Link to Cycle 2 PIAAC technical standards and guidelinesLink to a pdf of the cited article.
Jann
,
B.
(
2008
), “
The Blinder–Oaxaca decomposition for linear regression models
”,
The Stata Journal
, Vol.
8
No.
4
, pp.
453
-
479
.
Jerrim
,
J.
,
Lopez-Agudo
,
L.A.
,
Marcenaro-Gutierrez
,
O.D.
and
Shure
,
N.
(
2017
), “
What happens when econometrics and psychometrics collide? An example using the PISA data
”,
Economics of Education Review
, Vol.
61
, pp.
51
-
58
.
Kim
,
L.E.
,
Poropat
,
A.E.
, and
MacCann
,
C.
(
2016
), “Conscientiousness in education: Its conceptualization, assessment, and utility”,
Psychosocial Skills and School Systems in the 21st Century
,
Springer
, pp.
155
-
185
.
Leone
,
T.
(
2021
), “
The gender gap in intergenerational mobility
”,
World Development Perspectives
, Vol.
21
, p.
100286
, doi: .
Liu
,
Q.
and
Ding
,
R.
(
2020
), “Does poverty matter or inequality? An international comparative analysis on the intergenerational education persistence”, In
Education and Mobilities: Ideas, People and Technologies
,
Springer
, pp.
187
-
205
.
Lundborg
,
P.
,
Nordin
,
M.
and
Rooth
,
D.O.
(
2018
), “
The intergenerational transmission of human capital: the role of skills and health
”,
Journal of Population Economics
, Vol.
31
No.
4
, pp.
1035
-
1065
, doi: .
Mendez
,
I.
and
Zamarro
,
G.
(
2018
), “
The intergenerational transmission of noncognitive skills and their effect on education and employment outcomes
”,
Journal of Population Economics
, Vol.
31
No.
2
, pp.
521
-
560
, doi: .
Mood
,
C.
,
Jonsson
,
J.O.
and
Bihagen
,
E.
(
2012
), “Socioeconomic persistence across generations: Cognitive and noncognitive processes”, In
J.
Ermisch
,
M.
Jäntti
, and
T.
Smeeding
(Eds),
From Parents to Children
,
Russell Sage Foundation
, pp.
53
-
85
.
Narayan
,
A.
,
Van der Weide
,
R.
,
Cojocaru
,
A.
,
Lakner
,
C.
,
Redaelli
,
S.
,
Mahler
,
D.G.
, …
Thewissen
,
S.
(
2018
),
Fair Progress?: Economic Mobility across Generations around the World
,
World Bank Publications
.
Nennstiel
,
R.
and
Becker
,
R.
(
2023
), “
Gendered intergenerational educational mobility patterns converge in the cohort sequence: evidence from Switzerland using administrative data
”,
Frontiers in Sociology
, Vol.
8
, p.
1172553
, doi: .
Oaxaca
,
R.
(
1973
), “
Male-female wage differentials in urban labor markets
”,
International Economic Review
, Vol.
14
No.
3
, pp.
693
-
709
, doi: .
Oberdabernig
,
D.
and
Schneebaum
,
A.
(
2017
), “
Catching up? The educational mobility of migrants’ and natives’ children in Europe
”,
Applied Economics
, Vol.
49
No.
37
, pp.
3701
-
3728
, doi: .
OECD
(
2022
), “
Cycle 2 PIAAC technical standards and guidelines
”,
available at:
Link to Cycle 2 PIAAC technical standards and guidelinesLink to a pdf of the cited article.
Paccagnella
,
M.
(
2015
), “
Skills and wage inequality: Evidence from PIAAC
”,
OECD Education Working Papers
, Vol.
114
, pp.
1
-
32
.
Palczyńska
,
M.
and
Świst
,
K.
(
2018
), “
Personality, cognitive skills and life outcomes: evidence from the Polish follow-up study to PIAAC
”,
Large-scale Assessments in Education
, Vol.
6
No.
1
, pp.
1
-
23
.
Plomin
,
R.
and
Deary
,
I.
(
2015
), “
Genetics and intelligence differences: five special findings
”,
Molecular Psychiatry
, Vol.
20
No.
1
, pp.
98
-
108
, doi: .
Rammstedt
,
B.
,
Danner
,
D.
and
Lechner
,
C.
(
2017
), “
Personality, competencies, and life outcomes: Results from the German PIAAC longitudinal study
”,
Large-Scale Assessments in Education
, Vol.
5
No.
1
, pp.
1
-
24
, doi: .
Rammstedt
,
B.
,
Lechner
,
C.M.
and
Danner
,
D.
(
2024
), “
Beyond literacy: the incremental value of noncognitive skills
”,
OECD Education Working Papers
, Vol.
311
, pp.
1
-
26
.
Rammstedt
,
B.
,
Roemer
,
L.
,
Roth
,
M.
,
Zabal
,
A.
and
Lechner
,
C.
(
2025
), “
Revisiting gender differences in personality: new evidence on big five domains and facets with large-scale samples from 27 nations
”.
Shapira
,
M.
(
2012
), “
An exploration of differences in mathematics attainment among immigrant pupils in 18 OECD countries
”,
European Educational Research Journal
, Vol.
11
No.
1
, pp.
68
-
95
, doi: .
Soto
,
C.J.
,
John
,
O.P.
,
Gosling
,
S.D.
and
Potter
,
J.
(
2011
), “
Age differences in personality traits from 10 to 65: big five domains and facets in a large cross-sectional sample
”,
Journal of Personality and Social Psychology
, Vol.
100
No.
2
, pp.
330
-
348
, doi: .
Torche
,
F.
(
2015
), “
Intergenerational mobility and gender in Mexico
”,
Social Forces
, Vol.
94
No.
2
, pp.
563
-
587
.
Van der Weide
,
R.
,
Lakner
,
C.
,
Mahler
,
D.G.
,
Narayan
,
A.
and
Gupta
,
R.
(
2024
), “
Intergenerational mobility around the world: a new database
”,
Journal of Development Economics
, Vol.
166
, p.
103167
, doi: .
Vera‐Toscano
,
E.
,
Rodrigues
,
M.
and
Costa
,
P.
(
2017
), “
Beyond educational attainment: the importance of skills and lifelong learning for social outcomes. Evidence for Europe from PIAAC
”,
European Journal of Education
, Vol.
52
No.
2
, pp.
217
-
231
, doi: .
Weisberg
,
Y.J.
,
DeYoung
,
C.G.
and
Hirsh
,
J.B.
(
2011
), “
Gender differences in personality across the ten aspects of the big five
”,
Frontiers in Psychology
, Vol.
2
, p.
178
, doi: .
Yun
,
M.S.
(
2004
), “
Decomposing differences in the first moment
”,
Economics Letters
, Vol.
82
No.
2
, pp.
275
-
280
, doi: .
Deary
,
I.J.
(
2014
), “
The stability of intelligence from childhood to old age
”,
Current Directions in Psychological Science
, Vol.
23
No.
4
, pp.
239
-
245
.
Hanushek
,
E.A.
,
Jacobs
,
B.
,
Schwerdt
,
G.
,
Van der Velden
,
R.
,
Vermeulen
,
S.
and
Wiederhold
,
S.
(
2021
),
The Intergenerational Transmission of Cognitive Skills: An Investigation of the Causal Impact of Families on Student Outcomes (No. w29450)
,
National Bureau of Economic Research
, doi: .
OECD
(
2009
),
PISA Data Analysis Manual: SPSS
, (second)
OECD Publishing
,
edition. Paris
.
OECD
(
2024
), “
Do adults have the skills they need to thrive in a changing world?: survey of adult skills 2023
”,
OECD Publishing
.
Vecchione
,
M.
,
Alessandri
,
G.
,
Barbaranelli
,
C.
and
Caprara
,
G.
(
2012
), “
Gender differences in the big five personality development: a longitudinal investigation from late adolescence to emerging adulthood
”,
Personality and Individual Differences
, Vol.
53
No.
6
, pp.
740
-
746
, doi: .

Published by Emerald Publishing Limited. This article is published under the Creative Commons Attribution (CC BY 4.0) licence. Anyone may reproduce, distribute, translate and create derivative works of this article (for both commercial and non-commercial purposes), subject to full attribution to the original publication and authors. The full terms of this licence maybe seen at Link to the terms of the CC BY 4.0 licenceLink to the terms of the CC BY 4.0 licence.

Supplementary data

Data & Figures

Figure 1.
Four scatter plots compare literacy and numeracy with gaps in upward mobility and downward mobility.The four-panel figure presents scatter plots for literacy and numeracy in relation to mobility gaps. The top left panel is labelled i literacy and the top right panel is labelled ii numeracy. Both top panels are grouped under the caption a gap in upward mobility. Each panel contains scattered points with a dashed trend line that increases from left to right. A correlation value appears in each panel with rho equals 0.444 for literacy and rho equals 0.507 for numeracy. The bottom two panels are grouped under the caption b gap in downward mobility. The bottom left panel corresponds to literacy and the bottom right panel corresponds to numeracy. Both bottom panels contain scattered points with a dashed trend line that decreases from left to right. Correlation values appear with rho equals minus 0.553 for literacy and rho equals minus 0.318 for numeracy.

Gender gaps in cognitive skills and in intergenerational mobility

Note(s): Positive (negative) values mean mobility (or the skill) is higher for women (men)

Figure 1.
Four scatter plots compare literacy and numeracy with gaps in upward mobility and downward mobility.The four-panel figure presents scatter plots for literacy and numeracy in relation to mobility gaps. The top left panel is labelled i literacy and the top right panel is labelled ii numeracy. Both top panels are grouped under the caption a gap in upward mobility. Each panel contains scattered points with a dashed trend line that increases from left to right. A correlation value appears in each panel with rho equals 0.444 for literacy and rho equals 0.507 for numeracy. The bottom two panels are grouped under the caption b gap in downward mobility. The bottom left panel corresponds to literacy and the bottom right panel corresponds to numeracy. Both bottom panels contain scattered points with a dashed trend line that decreases from left to right. Correlation values appear with rho equals minus 0.553 for literacy and rho equals minus 0.318 for numeracy.

Gender gaps in cognitive skills and in intergenerational mobility

Note(s): Positive (negative) values mean mobility (or the skill) is higher for women (men)

Close modal
Figure 2.
Ten scatter plots compare personality traits with gaps in upward mobility and downward mobility.The ten scatter plots are arranged in two rows and five columns. The top row is labelled a gap in upward mobility. The bottom row is labelled b gap in downward mobility. The five columns correspond to personality traits labelled agreeableness, conscientiousness, open-mindedness, extraversion, and emotional stability. Each panel contains scattered points and a dashed trend line. In the upward mobility row, the correlation values displayed are rho equals 0.080 for agreeableness, rho equals minus 0.241 for conscientiousness, rho equals 0.479 for open-mindedness, rho equals minus 0.008 for extraversion, and rho equals 0.054 for emotional stability. In the downward mobility row, the correlation values displayed are rho equals minus 0.188 for agreeableness, rho equals 0.035 for conscientiousness, rho equals minus 0.331 for open-mindedness, rho equals minus 0.367 for extraversion, and rho equals minus 0.188 for emotional stability.

Gender gap in noncognitive skills and in intergenerational mobility

Note(s): Positive (negative) values mean mobility (or the trait) is higher for women (men)

Figure 2.
Ten scatter plots compare personality traits with gaps in upward mobility and downward mobility.The ten scatter plots are arranged in two rows and five columns. The top row is labelled a gap in upward mobility. The bottom row is labelled b gap in downward mobility. The five columns correspond to personality traits labelled agreeableness, conscientiousness, open-mindedness, extraversion, and emotional stability. Each panel contains scattered points and a dashed trend line. In the upward mobility row, the correlation values displayed are rho equals 0.080 for agreeableness, rho equals minus 0.241 for conscientiousness, rho equals 0.479 for open-mindedness, rho equals minus 0.008 for extraversion, and rho equals 0.054 for emotional stability. In the downward mobility row, the correlation values displayed are rho equals minus 0.188 for agreeableness, rho equals 0.035 for conscientiousness, rho equals minus 0.331 for open-mindedness, rho equals minus 0.367 for extraversion, and rho equals minus 0.188 for emotional stability.

Gender gap in noncognitive skills and in intergenerational mobility

Note(s): Positive (negative) values mean mobility (or the trait) is higher for women (men)

Close modal
Figure 3.
Two bar charts compare the explained and unexplained components of upward mobility and downward mobility across countries.The two grouped bar charts compare mobility components across countries. The top chart is labelled a upward mobility. The bottom chart is labelled b downward mobility. Each chart displays vertical bars for multiple countries labelled along the horizontal axis using country abbreviations such as A U T, E S P, P R T, C H L, C H E, I T A, N Z L, B E L, F I N, C Z E, I R L, G B R, C A N, S G P, I S R, H U N, L V A, E S T, H R V, F R A, S V K, P O L, and L T U. Bars extend above or below the horizontal zero line. Two bar segments represent components labelled explained and unexplained. The upward mobility chart contains bars with positive and negative values across countries. The downward mobility chart contains bars with negative values for many countries and smaller positive values for some countries. A legend below the charts identifies the two components as explained and unexplained.

Overall decomposition of the gender gap in intergenerational mobility

Note(s): Oaxaca–Blinder decomposition of gender differences in mobility as females–males, for individuals aged 25–65. Covariables: age groups, books in household, parental occupation, number of siblings, numeracy scores, literacy scores, Big 5 scores

Figure 3.
Two bar charts compare the explained and unexplained components of upward mobility and downward mobility across countries.The two grouped bar charts compare mobility components across countries. The top chart is labelled a upward mobility. The bottom chart is labelled b downward mobility. Each chart displays vertical bars for multiple countries labelled along the horizontal axis using country abbreviations such as A U T, E S P, P R T, C H L, C H E, I T A, N Z L, B E L, F I N, C Z E, I R L, G B R, C A N, S G P, I S R, H U N, L V A, E S T, H R V, F R A, S V K, P O L, and L T U. Bars extend above or below the horizontal zero line. Two bar segments represent components labelled explained and unexplained. The upward mobility chart contains bars with positive and negative values across countries. The downward mobility chart contains bars with negative values for many countries and smaller positive values for some countries. A legend below the charts identifies the two components as explained and unexplained.

Overall decomposition of the gender gap in intergenerational mobility

Note(s): Oaxaca–Blinder decomposition of gender differences in mobility as females–males, for individuals aged 25–65. Covariables: age groups, books in household, parental occupation, number of siblings, numeracy scores, literacy scores, Big 5 scores

Close modal
Figure 4.
Four bar charts compare explained and unexplained components of upward mobility and downward mobility across countries.The four bar charts are arranged in two rows and two columns. The left column is labelled a explained and the right column is labelled b unexplained. The top row is labelled i upward mobility and the bottom row is labelled ii downward mobility. Each chart contains vertical bars for multiple countries listed along the horizontal axis using abbreviations such as A U T, C H E, C H L, E S P, N Z L, C Z E, P R T, F I N, G B R, C A N, B E L, I T A, I S R, F R A, E S T, S G P, L V A, H R V, P O L, L T U, S V K, H U N, and I R L. Bars extend above or below the horizontal zero line and are divided into segments representing cognitive, noncognitive, age, and household components. The upward mobility charts display bars with negative and positive values across countries. The downward mobility charts display bars that gradually increase from negative values toward positive values across the sequence of countries. A legend identifies the four components as cognitive, noncognitive, age, and household.

Detailed decomposition of the gender gap in intergenerational mobility

Note(s): Oaxaca–Blinder decomposition of gender differences in mobility as females–males. Covariables: cognitive (numeracy and literacy scores), noncognitive (Big 5 scores), age (age groups in ten-year bands), household (books in household, parental occupation, number of siblings)

Figure 4.
Four bar charts compare explained and unexplained components of upward mobility and downward mobility across countries.The four bar charts are arranged in two rows and two columns. The left column is labelled a explained and the right column is labelled b unexplained. The top row is labelled i upward mobility and the bottom row is labelled ii downward mobility. Each chart contains vertical bars for multiple countries listed along the horizontal axis using abbreviations such as A U T, C H E, C H L, E S P, N Z L, C Z E, P R T, F I N, G B R, C A N, B E L, I T A, I S R, F R A, E S T, S G P, L V A, H R V, P O L, L T U, S V K, H U N, and I R L. Bars extend above or below the horizontal zero line and are divided into segments representing cognitive, noncognitive, age, and household components. The upward mobility charts display bars with negative and positive values across countries. The downward mobility charts display bars that gradually increase from negative values toward positive values across the sequence of countries. A legend identifies the four components as cognitive, noncognitive, age, and household.

Detailed decomposition of the gender gap in intergenerational mobility

Note(s): Oaxaca–Blinder decomposition of gender differences in mobility as females–males. Covariables: cognitive (numeracy and literacy scores), noncognitive (Big 5 scores), age (age groups in ten-year bands), household (books in household, parental occupation, number of siblings)

Close modal
Figure 5.
Two stacked bar charts compare contributions of cognitive skills and personality traits to upward mobility and downward mobility across countries.The two stacked bar charts are arranged vertically. The top chart is labelled i upward mobility. The bottom chart is labelled ii downward mobility. Each chart displays stacked vertical bars for countries labelled along the horizontal axis using abbreviations such as A U T, C H E, C H L, C Z E, F I N, N Z L, E S P, P R T, C A N, B E L, G B R, I T A, F R A, E S T, I S R, S G P, L V A, L T U, H U N, I R L, S V K, H R V, and P O L. Bars extend above or below the horizontal zero line. Each bar is divided into segments labelled numeracy, literacy, agreeableness, conscientiousness, open-mindedness, extraversion, and emotional stability. In the upward mobility chart, many bars extend below the zero line and gradually approach or exceed the zero line across the sequence of countries. In the downward mobility chart, bars increase from near zero or slightly negative values toward larger positive values across the sequence of countries. A legend below the charts lists the seven components, representing cognitive skills and personality traits.

Contribution of cognitive and noncognitive skills to the explained part of the gender gap in downward mobility

Figure 5.
Two stacked bar charts compare contributions of cognitive skills and personality traits to upward mobility and downward mobility across countries.The two stacked bar charts are arranged vertically. The top chart is labelled i upward mobility. The bottom chart is labelled ii downward mobility. Each chart displays stacked vertical bars for countries labelled along the horizontal axis using abbreviations such as A U T, C H E, C H L, C Z E, F I N, N Z L, E S P, P R T, C A N, B E L, G B R, I T A, F R A, E S T, I S R, S G P, L V A, L T U, H U N, I R L, S V K, H R V, and P O L. Bars extend above or below the horizontal zero line. Each bar is divided into segments labelled numeracy, literacy, agreeableness, conscientiousness, open-mindedness, extraversion, and emotional stability. In the upward mobility chart, many bars extend below the zero line and gradually approach or exceed the zero line across the sequence of countries. In the downward mobility chart, bars increase from near zero or slightly negative values toward larger positive values across the sequence of countries. A legend below the charts lists the seven components, representing cognitive skills and personality traits.

Contribution of cognitive and noncognitive skills to the explained part of the gender gap in downward mobility

Close modal
Figure A1.
Multiple country line charts compare tertiary education enrolment for ages 25 to 34 between men and women over time.The multiple small line charts are arranged in rows under the title percentage of tertiary education enrolled 25 minus 34. Each panel is labelled with a country name, including Austria, Belgium, Canada, Chile, Croatia, Czech Republic, Estonia, Finland, France, Hungary, Ireland, Israel, Italy, Latvia, Lithuania, New Zealand, Poland, Portugal, Singapore, Slovakia, Spain, Switzerland, and the United Kingdom. Each chart contains two lines representing men and women. The horizontal axis indicates time from 1940 to 2020. The vertical axis represents the percentage of tertiary education enrolment. In most panels both lines gradually increase over time. Some panels display periods of slower change or short declines followed by increases. The legend identifies the two lines as men and women.

Gender differences in tertiary education enrolment in selected OECD countries

Source: Own elaboration from Barro and Lee (2013) data set

Figure A1.
Multiple country line charts compare tertiary education enrolment for ages 25 to 34 between men and women over time.The multiple small line charts are arranged in rows under the title percentage of tertiary education enrolled 25 minus 34. Each panel is labelled with a country name, including Austria, Belgium, Canada, Chile, Croatia, Czech Republic, Estonia, Finland, France, Hungary, Ireland, Israel, Italy, Latvia, Lithuania, New Zealand, Poland, Portugal, Singapore, Slovakia, Spain, Switzerland, and the United Kingdom. Each chart contains two lines representing men and women. The horizontal axis indicates time from 1940 to 2020. The vertical axis represents the percentage of tertiary education enrolment. In most panels both lines gradually increase over time. Some panels display periods of slower change or short declines followed by increases. The legend identifies the two lines as men and women.

Gender differences in tertiary education enrolment in selected OECD countries

Source: Own elaboration from Barro and Lee (2013) data set

Close modal
Figure A2.
Multiple country line charts compare tertiary education completion for ages 25 to 34 between men and women over time.The multiple small line charts are arranged in rows under the title percentage of tertiary education completed 25 minus 34. Each panel is labelled with a country name, including Austria, Belgium, Canada, Chile, Croatia, Czech Republic, Estonia, Finland, France, Hungary, Ireland, Israel, Italy, Latvia, Lithuania, New Zealand, Poland, Portugal, Singapore, Slovakia, Spain, Switzerland, and the United Kingdom. Each chart contains two lines representing men and women. The horizontal axis indicates time from 1940 to 2020. The vertical axis represents the percentage of tertiary education completion. In most panels, both lines gradually increase over time. Some panels display periods of slower change or short declines followed by increases. The legend identifies the two lines as men and women.

Gender differences in completing tertiary education in selected OECD countries

Source: Own elaboration from Barro and Lee (2013) data set

Figure A2.
Multiple country line charts compare tertiary education completion for ages 25 to 34 between men and women over time.The multiple small line charts are arranged in rows under the title percentage of tertiary education completed 25 minus 34. Each panel is labelled with a country name, including Austria, Belgium, Canada, Chile, Croatia, Czech Republic, Estonia, Finland, France, Hungary, Ireland, Israel, Italy, Latvia, Lithuania, New Zealand, Poland, Portugal, Singapore, Slovakia, Spain, Switzerland, and the United Kingdom. Each chart contains two lines representing men and women. The horizontal axis indicates time from 1940 to 2020. The vertical axis represents the percentage of tertiary education completion. In most panels, both lines gradually increase over time. Some panels display periods of slower change or short declines followed by increases. The legend identifies the two lines as men and women.

Gender differences in completing tertiary education in selected OECD countries

Source: Own elaboration from Barro and Lee (2013) data set

Close modal
Table 1.

Gender differences in measures of educational mobility, cognitive and noncognitive skills

CountryMeasures of mobilityCognitive skillsNoncognitive skills
1-BETA1-CORDownwardUpwardLiteracyNumeracyAgreeabl.Consc.Extrav.Emot. S.Open-m.
Austria−0.115***−0.042***1.54*−1.86 1.50 −15.52***0.47***0.26***0.14***−0.35***0.00 
Belgium−0.006−0.052−6.66***4.91**−0.10 −11.80***0.57***0.22***−0.01 −0.40***−0.04 
Canada0.068*−0.005*−7.05***8.50***1.80***−14.90***0.39***0.18***0.03 −0.42***0.05 
Chile0.0260.029−2.07 4.81**0.59*−8.11***0.13***0.23***0.02 −0.35***0.08 
Croatia−0.092***−0.077***−3.28***3.58 6.92***0.76 0.25***0.17***−0.03 −0.28***0.39***
Czech Republic−0.079*−0.041*−1.74***4.43***−1.80*−13.71***0.32***−0.12*0.00*−0.47***−0.04 
Estonia−0.004−0.015−12.62***12.21***11.44***−7.66***0.47***0.29***0.20***−0.28***0.20***
Finland0.057*0.025*−7.55***13.61***8.71***−10.27***0.30***0.07*0.16***−0.32***0.05 
France−0.005−0.009−2.43**5.65***3.80***−11.09***0.33***0.19***0.11***−0.53***0.10***
Hungary−0.046*−0.018*−4.10***9.86***5.74***−4.88***0.29***0.16***0.03 −0.47***0.11***
Ireland0.054−0.012*−4.33***9.88***3.21 −12.13***0.51***0.12***0.05 −0.39***−0.04 
Israel0.020−0.119−8.79***8.35***6.35**−6.08***0.22***0.20***0.16***−0.31***0.12***
Italy0.0700.0540.43 7.30**2.05 −7.98***0.30***0.12**−0.09**−0.46***0.09**
Latvia−0.055*−0.076*−9.91***12.08***3.99***−8.14 0.42***0.05***0.06***−0.50***0.19***
Lithuania−0.043−0.040**−11.73***11.01***5.47**−2.52***0.32***0.07***0.10***−0.24***0.19***
New Zealand0.0310.028−5.08**5.70***13.59**−7.80***0.43***0.19***−0.03 −0.21***0.01 
Poland0.011−0.027−2.69***12.97***4.02**0.56 0.45***0.11***−0.14***−0.26***0.31***
Portugal−0.0640.015−3.53***8.03***−2.60 −10.90***0.25***0.28***0.10**−0.40***0.09*
Singapore−0.045**−0.053**−1.35**2.91 2.40 −5.97***0.28***0.15***−0.12***−0.17***0.03 
Slovak Republic−0.0360.009−3.91***11.00***0.57 −1.65 0.36***−0.03 −0.17***−0.32***0.21***
Spain−0.0200.006−1.42 4.21**−1.34 −9.77***0.16***0.30***0.10***−0.41***0.08*
Switzerland−0.044−0.0673.07**−7.12***−2.38 −18.54***0.36***0.13***0.07**−0.40***−0.08 
UK0.027−0.035−3.27 4.70 −3.70**−16.77***0.45***0.23***0.00 −0.36***−0.13***
Note(s):

Significance level ***ρ < 0.01, **ρ < 0.05, *ρ < 0.1

Table A1.

Definition of variables

VariableVariable definition
Respondent’s educationRespondent’s education level, where 1: has not attained upper secondary; 2: has attained secondary or post-secondary, nontertiary; 3: has attained tertiary
Parental educationHighest education level reached by either parent/guardian, where 1: has not attained upper secondary; 2: has attained secondary or post-secondary, nontertiary; 3: has attained tertiary
Upward mobilityDummy variable equal to 1 if respondent reaches a higher education than that of the highest educated parent/guardian
Downward mobilityDummy variable equal to 1 if respondent reaches a lower education than that of the highest educated parent/guardian
AgeRespondent’s age grouped in 1:25–34; 2:35–44; 3:45–54; 4:55–64
BooksDummy variable equal to 1 if respondent reports having more than 100 books at home at age 14
Parental occupationHighest occupational category by either parent/guardian, where 1: Skilled occupations; 2: Semi-skilled white-collar occupations; 3: Semi-skilled blue-collar occupations; 4: Elementary occupations
N. siblingsNumber of siblings reported by respondent at age 14
LiteracyAverage of plausible values 1–10 of literacy
NumeracyAverage of plausible values 1–10 of numeracy
Big 5Standardized scores of each Big 5 trait as reported by PIAAC (mean = 0, SD ≈ 1)
Table A2.

Descriptive statistics of variables

GenderAUTBELCANCHLHRVCZEESTFINFRAHUNIRLISRITALVALTUNZLPOLPRTSGPSVKESPCHEGBR
Males                       
Education levels                       
Primary7.813.510.925.410.13.312.78.214.211.821.916.238.211.313.321.98.651.39.011.836.33.714.4
Secondary54.938.643.740.266.272.849.250.146.059.135.940.243.752.352.839.068.526.436.163.421.944.643.7
Tertiary37.447.945.434.423.723.938.141.739.729.042.343.618.136.434.039.122.922.354.924.941.851.741.9
Parental education                       
Neither parent has upper secondary20.126.716.344.932.23.014.524.034.625.942.832.365.314.621.733.118.174.349.917.560.111.926.2
At least one parent has secondary53.340.737.236.850.376.145.245.640.751.132.930.527.952.740.527.972.713.931.666.520.159.046.4
At least one parent has tertiary26.732.646.518.317.520.940.330.424.723.024.237.26.732.837.839.19.211.818.516.019.829.127.4
Age                       
Age 25–3422.122.925.527.523.021.723.624.122.422.220.633.619.223.023.527.322.816.726.422.618.524.825.1
Age 35–4421.823.224.027.125.326.628.123.525.025.527.126.721.926.924.520.330.122.821.427.822.621.421.5
Age 45–5424.224.021.622.824.428.226.023.225.329.726.622.628.425.225.424.323.528.922.025.329.623.424.7
Age 55 plus32.029.928.922.527.323.622.329.127.222.625.717.130.624.926.728.123.631.630.224.329.330.528.7
Books                       
Books > 10030.028.337.09.812.253.163.950.733.148.426.436.181.846.373.662.284.482.291.074.371.255.863.8
Parental OCC            18.253.726.437.815.617.89.025.728.844.236.2
Skilled19.228.232.614.414.615.427.322.622.515.923.432.6           
Semi-skilled white collar18.920.516.517.522.821.912.724.821.015.016.522.516.823.919.526.511.318.628.116.418.633.227.4
Semi-skilled blue collar46.738.241.042.743.651.748.943.341.553.547.436.821.314.710.815.29.221.424.116.020.723.426.1
Elementary15.213.29.925.519.011.011.19.215.115.712.78.237.844.345.446.368.740.332.951.041.334.231.3
Number of siblings1.81.82.02.51.51.41.51.91.91.42.83.01.71.31.62.31.91.92.31.92.01.81.8
Cognitive                       
Literacy263.3285.3278.2213.5251.0264.3271.1294.6258.2245.7259.9243.6245.5244.1233.5262.6232.1237.9254.7254.1253.4281.9278.8
Numeracy283.1296.1282.1215.1253.1279.1286.2300.5269.1257.9263.2251.0250.2266.3245.4264.3236.8247.8276.1261.7260.7301.4279.8
Noncognitive                    
Agreeableness−0.282−0.234−0.180−0.024−0.108−0.130−0.198−0.136−0.169−0.101−0.160−0.063−0.151−0.181−0.157−0.231−0.227−0.088−0.157−0.140−0.066−0.167−0.199
Conscientiousness−0.080−0.021−0.031−0.060−0.0150.140−0.1120.016−0.0080.0060.043−0.0350.0060.040−0.0060.019−0.023−0.0480.0140.088−0.076−0.056−0.034
Extraversion−0.065−0.0070.0030.009−0.0040.003−0.085−0.095−0.052−0.029−0.086−0.0740.063−0.020−0.0630.0250.075−0.0970.0440.090−0.076−0.027−0.026
Emotional stability0.2220.2220.1920.1630.1310.2460.1720.2000.2490.2360.2320.1590.2280.2740.1130.1460.1190.2060.1250.1930.1880.2540.168
Open-mindedness−0.070−0.001−0.041−0.043−0.230−0.011−0.115−0.022−0.099−0.097−0.087−0.069−0.068−0.112−0.136−0.023−0.200−0.126−0.092−0.109−0.072−0.0080.009
N1,3581,2983,6391,4761,4991,6542,3491,6202,2521,7441,0681,9531,0972,2881,9601,1022,0538251,6101,9701,9921,8091,528
Females                       
Education levels                       
Primary14.19.88.323.210.75.37.33.913.312.513.67.933.79.77.419.95.246.59.99.732.06.011.3
Secondary51.327.139.639.254.966.831.937.740.847.836.634.442.737.342.632.259.723.833.856.521.654.444.1
Tertiary34.763.152.137.534.427.960.958.445.939.749.957.823.653.050.047.935.129.856.333.846.339.644.6
Parental education                       
Neither parent has upper secondary20.727.520.850.130.95.515.724.935.429.846.231.966.015.425.439.920.477.351.019.760.712.328.7
At least one parent has secondary56.435.837.833.450.775.345.049.141.550.028.531.226.755.240.723.770.113.632.666.119.759.646.2
At least one parent has tertiary22.936.741.416.518.419.239.226.023.220.125.336.97.229.433.936.49.59.216.514.219.628.125.2
Age                       
Age 25–3422.623.624.727.621.720.422.922.821.722.220.431.618.622.021.724.922.416.426.521.717.124.325.3
Age 35–4420.422.823.124.524.626.528.524.025.023.827.228.320.825.821.523.527.622.419.827.322.722.021.5
Age 45–5424.423.421.123.023.828.325.221.025.429.325.722.828.826.025.923.524.228.621.424.729.424.624.7
Age 55 plus32.630.331.124.930.024.723.432.127.824.826.617.331.926.230.928.225.832.632.326.330.829.128.5
Books                       
Books > 10065.470.163.491.384.242.534.347.463.947.769.163.381.141.672.558.083.083.291.068.870.956.661.0
Parental OCC34.629.936.68.715.857.565.752.636.152.330.936.718.958.427.542.017.016.89.031.229.143.439.0
Skilled                       
Semi-skilled white collar20.332.428.913.214.814.026.021.620.115.125.630.918.423.619.227.010.114.325.916.220.429.928.2
Semi-skilled blue collar17.719.319.818.820.822.212.923.520.216.616.521.819.813.311.219.210.018.425.915.718.425.923.4
Elementary48.035.840.539.947.448.949.844.543.252.145.636.337.643.743.438.767.943.130.751.241.832.333.8
Number of siblings1.91.82.12.51.51.41.51.92.01.52.83.01.71.41.62.42.02.12.51.82.01.81.8
Cognitive                       
Literacy264.8285.2280.0214.1257.9262.5282.5303.3262.0251.4263.1249.9247.6248.1238.9276.2236.1235.3257.1254.7252.1279.5275.1
Numeracy267.5284.3267.2207.0253.8265.4278.5290.2258.1253.0251.1244.9242.2258.2242.9256.5237.4236.9270.1260.0250.9282.8263.1
Noncognitive                    
Agreeableness0.1910.3380.2110.1050.1410.1940.2710.1640.1580.1880.3470.1560.1490.2440.1600.2000.2260.1660.1200.2210.0900.1940.252
Conscientiousness0.1850.1990.1460.1690.1570.0220.1810.0850.1830.1640.1650.1600.1300.0860.0600.2080.0840.2370.1640.0550.2290.0780.195
Extraversion0.078−0.0170.0350.029−0.0330.0000.1130.0630.0590.002−0.0350.081−0.0310.0430.036−0.001−0.0640.001−0.079−0.0770.0220.045−0.029
Emotional stability−0.125−0.181−0.224−0.186−0.151−0.227−0.113−0.121−0.277−0.233−0.162−0.151−0.229−0.229−0.126−0.066−0.139−0.191−0.046−0.132−0.225−0.142−0.194
Open-mindedness−0.075−0.0440.0120.0380.158−0.0550.0860.0240.0000.014−0.1280.0530.0260.0780.051−0.0110.110−0.041−0.0630.1040.008−0.087−0.120
n1,6061,3574,3632,1021,7662,4202,7441,7852,4651,9341,4761,9321,1543,3153,2761,5882,1711,1541,5262,4402,3131,8232,039
N2,9642,6558,0023,5783,2654,0745,0933,4054,7173,6782,5443,8852,2515,6035,2362,6904,2241,9793,1364,4104,3053,6323,567
Table A3.

Detailed Oaxaca decomposition of upward mobility

VariableAUTBELCANCHLHRVCZEESTFINFRAHUNIRLISRITALVALTUNZLPOLPRTSGPSVKESPCHEGBR
Probability                       
Females 0.322***(0.012)0.426***(0.013)0.338***(0.013)0.484***(0.015)0.384***(0.013)0.214***(0.010)0.395***(0.009)0.505***(0.012)0.487***(0.011)0.411***(0.011)0.509***(0.016)0.432***(0.013)0.464***(0.016)0.403***(0.011)0.376***(0.010)0.402***(0.023)0.421***(0.012)0.425***(0.014)0.647***(0.013)0.358***(0.012)0.468***(0.012)0.320***(0.012)0.433***(0.013)
Males 0.339***(0.014)0.375***(0.013)0.259***(0.012)0.427***(0.017)0.331***(0.014)0.169***(0.011)0.272***(0.009)0.365***(0.011)0.423***(0.011)0.315***(0.011)0.419***(0.018)0.338***(0.013)0.387***(0.016)0.279***(0.012)0.274***(0.012)0.356***(0.024)0.297***(0.011)0.337***(0.017)0.625***(0.013)0.246***(0.012)0.429***(0.013)0.392***(0.012)0.391***(0.015)
Difference −0.017(0.018)0.050***(0.018)0.079***(0.018)0.057**(0.023)0.053***(0.019)0.045***(0.015)0.123***(0.013)0.140***(0.016)0.063***(0.016)0.096***(0.015)0.090***(0.024)0.094***(0.018)0.077***(0.023)0.125***(0.016)0.102***(0.016)0.046(0.033)0.124***(0.016)0.089***(0.022)0.022(0.018)0.112***(0.018)0.039**(0.017)−0.071***(0.017)0.042**(0.020)
Explained −0.064***(0.010)−0.023***(0.009)−0.009(0.009)−0.031***(0.008)0.004(0.008)−0.016***(0.006)0.002(0.008)−0.018**(0.009)0.005(0.009)0.000(0.007)−0.016(0.013)−0.003(0.007)−0.027***(0.009)0.001(0.008)0.020***(0.006)−0.024(0.021)0.015***(0.005)−0.031***(0.007)−0.005(0.006)0.006(0.006)−0.036***(0.007)−0.028***(0.009)−0.013(0.011)
Unexplained 0.047**(0.020)0.074***(0.020)0.088***(0.019)0.087***(0.024)0.049**(0.021)0.061***(0.015)0.121***(0.015)0.158***(0.018)0.058***(0.018)0.096***(0.017)0.106***(0.026)0.098***(0.019)0.104***(0.024)0.124***(0.018)0.082***(0.017)0.069*(0.036)0.110***(0.018)0.119***(0.023)0.027(0.020)0.106***(0.019)0.075***(0.018)−0.044**(0.019)0.055**(0.023)
Explained part                       
Age 35–44 −0.001(0.001)0.000(0.000)−0.001***(0.000)−0.002*(0.001)0.000(0.000)0.000*(0.000)0.000(0.000)0.001***(0.000)0.000**(0.000)0.000(0.007)0.001*(0.001)0.001*(0.000)0.000(0.000)0.000(0.002)0.000(0.001)−0.001(0.001)−0.001**(0.001)0.000(0.000)−0.001**(0.000)0.000(0.000)−0.000***(0.000)0.000(0.000)0.000*(0.000)
Age 45–54 0.001**(0.000)−0.002***(0.000)−0.002***(0.001)0.001***(0.000)0.000(0.000)−0.000**(0.000)−0.001(0.001)−0.005***(0.001)−0.002***(0.001)0.000(0.002)−0.002***(0.001)−0.001**(0.000)0.000(0.000)0.001(0.003)0.001***(0.000)−0.003(0.002)0.000(0.000)0.000(0.000)−0.001***(0.000)0.000(0.000)0.000(0.000)0.001**(0.000)−0.002***(0.000)
Age 55 plus 0.000***(0.000)0.002***(0.000)0.004***(0.001)0.002**(0.001)0.003***(0.001)0.000(0.000)0.006(0.004)0.009***(0.001)0.002***(0.001)0.001(0.023)0.002***(0.001)0.000**(0.000)−0.001(0.000)0.001(0.006)0.010***(0.001)0.000**(0.000)0.002***(0.000)−0.002*(0.001)0.001***(0.001)0.002***(0.000)0.001***(0.000)−0.001***(0.000)0.004***(0.001)
Books (yes) −0.006***(0.001)−0.002***(0.001)0.000**(0.000)0.001***(0.000)−0.004***(0.001)−0.001(0.001)−0.001(0.001)−0.002***(0.000)−0.005***(0.002)0.000(0.010)−0.010***(0.002)0.001***(0.000)−0.000***(0.000)−0.001(0.007)−0.000***(0.000)−0.003***(0.001)0.001**(0.000)0.001***(0.000)0.000*(0.000)−0.001(0.001)0.000***(0.000)0.001***(0.000)−0.003***(0.001)
Semi-skilled white −0.001***(0.000)−0.003***(0.000)0.004***(0.001)0.004***(0.001)−0.005***(0.001)0.000***(0.000)0.000(0.000)−0.004***(0.000)−0.001***(0.000)0.001(0.022)0.001***(0.000)−0.004***(0.001)−0.002***(0.001)−0.001(0.006)0.001***(0.000)0.006***(0.001)0.002***(0.000)−0.006***(0.001)0.003***(0.001)−0.000***(0.000)−0.004***(0.001)0.005***(0.001)−0.004***(0.001)
Semi-skilled blue 0.002***(0.000)−0.008***(0.001)−0.000***(0.000)−0.010***(0.001)0.009***(0.002)−0.004***(0.001)0.004(0.003)0.005***(0.000)0.007***(0.002)−0.001(0.024)−0.003***(0.000)0.001***(0.000)0.000**(0.000)0.000(0.002)−0.005***(0.001)−0.014***(0.003)−0.001***(0.000)0.004***(0.001)−0.004***(0.001)−0.000**(0.000)0.001***(0.000)−0.005***(0.001)0.006***(0.001)
Elementary −0.003***(0.001)−0.003***(0.000)0.002***(0.001)0.009***(0.001)−0.005***(0.001)0.006***(0.001)0.000(0.000)0.004***(0.000)0.005***(0.002)0.001(0.015)−0.003***(0.001)0.010***(0.003)0.000(0.000)0.003(0.014)0.008***(0.001)0.007***(0.002)0.003***(0.000)0.006***(0.002)0.003***(0.001)0.001***(0.000)0.001***(0.000)0.010***(0.001)−0.001***(0.000)
N. of siblings 0.001(0.001)0.000(0.000)−0.001(0.001)0.000(0.000)0.000(0.001)0.000(0.000)0.000(0.000)−0.000***(0.000)0.000(0.001)0.000(0.006)0.001(0.001)0.002***(0.000)−0.002***(0.001)0.000(0.002)0.000(0.000)−0.001*(0.001)0.001**(0.000)−0.011***(0.002)0.002*(0.001)−0.000**(0.000)−0.001***(0.000)0.000(0.000)−0.000*(0.000)
Literacy score −0.004***(0.001)0.000(0.000)−0.002(0.001)0.001(0.001)−0.002(0.003)0.000(0.001)0.002(0.003)0.001(0.003)0.004***(0.002)0.002(0.033)0.008**(0.004)−0.005(0.003)0.000(0.000)0.000(0.002)0.001(0.002)−0.002(0.005)−0.003**(0.001)−0.003*(0.002)0.000(0.001)0.001**(0.000)−0.002**(0.001)−0.001(0.002)−0.004(0.004)
Numeracy score −0.058***(0.007)−0.019***(0.006)−0.020**(0.008)−0.033***(0.007)−0.000**(0.000)−0.025***(0.005)−0.011(0.012)−0.024***(0.005)−0.016*(0.009)−0.001(0.019)−0.001(0.007)−0.011**(0.006)−0.018***(0.006)−0.004(0.018)−0.003*(0.002)−0.024*(0.013)0.001***(0.000)−0.022***(0.006)−0.009**(0.004)−0.001(0.001)−0.024***(0.005)−0.036***(0.010)−0.019*(0.011)
Agreeableness 0.007(0.005)0.007(0.005)0.003(0.003)0.001(0.002)0.000(0.002)0.004(0.003)−0.002(0.004)−0.002(0.003)0.005(0.003)0.001(0.018)−0.008(0.007)−0.001(0.002)−0.001(0.003)0.004(0.019)0.007***(0.003)0.007(0.008)0.010**(0.004)−0.002(0.003)−0.001(0.002)0.000(0.004)0.001(0.001)0.005(0.004)0.011*(0.006)
Conscientiousness −0.001(0.003)0.004*(0.002)0.004***(0.001)0.004(0.003)0.001(0.002)−0.002*(0.001)0.004(0.004)0.002***(0.001)0.004**(0.002)0.000(0.004)0.003*(0.002)0.002(0.002)−0.001(0.001)0.000(0.002)0.001(0.001)0.001(0.002)0.002**(0.001)0.003(0.003)0.003*(0.001)0.000(0.000)0.002(0.003)0.002*(0.001)0.005(0.003)
Extraversion 0.001(0.002)0.000(0.000)0.000(0.000)0.000*(0.000)0.000(0.000)0.000(0.000)0.003(0.002)−0.001(0.001)0.001(0.001)0.000(0.003)0.001(0.001)0.002(0.001)0.000(0.002)0.000(0.001)0.001(0.001)−0.002(0.001)−0.003**(0.001)−0.001(0.000)−0.001(0.001)0.001(0.001)−0.002**(0.001)0.001*(0.001)0.000(0.000)
Emot. S. −0.002(0.004)0.002(0.004)−0.001(0.003)−0.009**(0.004)−0.002(0.003)0.005(0.004)−0.002(0.003)−0.002(0.003)0.002(0.005)−0.002(0.047)−0.005(0.005)−0.001(0.003)−0.006(0.006)−0.002(0.009)−0.002(0.002)0.005(0.005)−0.006**(0.002)−0.004(0.004)0.001(0.001)−0.002(0.003)−0.011***(0.004)−0.009**(0.004)0.001(0.004)
Open-mindedness 0.000*(0.000)−0.001(0.000)0.000(0.000)0.001(0.001)0.008*(0.005)−0.000*(0.000)0.001(0.002)0.000(0.000)0.000(0.001)0.001(0.011)−0.001(0.001)0.002(0.001)0.005***(0.001)0.002(0.009)0.003*(0.002)0.001(0.001)0.008***(0.002)0.005***(0.001)0.000(0.000)0.007***(0.002)0.003***(0.000)−0.001(0.001)−0.006***(0.002)
Unexplained part                       
Age 35–44 0.002(0.012)−0.002(0.015)0.024(0.016)0.013(0.017)−0.008(0.018)0.005(0.010)0.014(0.012)0.005(0.013)−0.006(0.012)0.002(0.012)0.029(0.021)−0.030**(0.014)0.021(0.016)0.007(0.014)0.006(0.012)0.020(0.018)0.005(0.014)−0.004(0.017)0.018(0.011)0.007(0.014)−0.004(0.012)−0.011(0.013)0.012(0.014)
Age 45–54 −0.025**(0.013)−0.007(0.015)−0.003(0.013)0.007(0.017)−0.033**(0.017)−0.017(0.011)0.001(0.011)−0.014(0.012)−0.021*(0.012)−0.013(0.014)−0.002(0.021)−0.036***(0.012)0.009(0.020)−0.015(0.014)−0.011(0.013)−0.038*(0.022)−0.007(0.012)−0.038*(0.021)−0.012(0.015)0.000(0.013)−0.013(0.016)−0.032**(0.015)0.011(0.016)
Age 55 plus −0.031*(0.017)−0.014(0.019)0.008(0.019)−0.019(0.016)−0.068***(0.018)−0.027***(0.010)0.004(0.010)−0.028(0.017)−0.015(0.013)−0.024**(0.012)0.032(0.021)−0.032***(0.010)−0.006(0.023)−0.022(0.014)−0.012(0.013)−0.038(0.023)−0.018(0.012)−0.026(0.023)0.009(0.019)−0.024*(0.013)−0.034**(0.016)−0.047**(0.020)0.028(0.018)
Books (yes) 0.020(0.014)−0.009(0.015)0.003(0.017)−0.011(0.008)−0.006(0.014)−0.005(0.016)0.013(0.019)−0.013(0.019)0.017(0.013)0.013(0.018)−0.018(0.017)−0.004(0.018)0.011(0.013)−0.012(0.021)−0.014(0.012)0.001(0.029)−0.008(0.009)−0.013(0.014)0.000(0.007)−0.018(0.012)−0.005(0.013)0.022(0.020)0.004(0.019)
Semi-skilled white −0.008(0.011)0.019(0.014)0.000(0.010)0.025(0.016)0.052*(0.029)0.002(0.011)0.002(0.007)0.014(0.013)0.008(0.011)0.004(0.011)0.001(0.013)0.039**(0.015)0.028*(0.017)−0.005(0.009)0.001(0.008)−0.006(0.015)−0.012(0.008)0.008(0.017)0.002(0.013)−0.013(0.010)0.005(0.012)−0.007(0.014)−0.031**(0.014)
Semi-skilled blue 0.038(0.028)0.042(0.026)0.007(0.022)0.019(0.033)0.090(0.057)0.003(0.023)0.011(0.020)0.012(0.023)0.003(0.020)0.008(0.035)−0.001(0.029)0.008(0.021)0.035(0.029)−0.021(0.023)0.006(0.026)0.009(0.034)−0.071(0.050)0.001(0.033)0.008(0.016)−0.028(0.029)0.017(0.023)0.012(0.018)−0.006(0.018)
Elementary 0.003(0.010)0.010(0.010)0.007(0.008)0.002(0.023)0.040(0.024)−0.002(0.007)−0.002(0.005)−0.007(0.007)−0.005(0.009)−0.002(0.012)0.006(0.011)0.009(0.008)0.009(0.020)−0.007(0.010)0.003(0.015)−0.002(0.013)−0.017*(0.010)0.017(0.019)−0.007(0.011)−0.015(0.011)0.001(0.012)−0.001(0.008)0.000(0.010)
N. of siblings −0.016(0.029)−0.001(0.034)−0.048(0.035)0.030(0.050)−0.071**(0.035)0.032(0.023)−0.002(0.018)0.025(0.029)−0.003(0.026)−0.020(0.022)−0.012(0.062)0.062(0.060)−0.020(0.039)−0.014(0.020)−0.047**(0.023)−0.046(0.059)0.027(0.027)−0.077*(0.039)−0.021(0.047)−0.030(0.029)0.049(0.030)0.055(0.035)−0.017(0.036)
Literacy score 0.198(0.261)0.109(0.354)−0.013(0.301)0.341(0.304)−0.175(0.295)−0.099(0.188)0.131(0.209)0.433(0.271)0.220(0.247)0.042(0.239)−0.128(0.393)−0.189(0.220)−0.120(0.303)−0.474**(0.208)0.208(0.228)0.130(0.475)−0.009(0.182)0.312(0.300)0.244(0.250)0.357(0.281)−0.020(0.261)0.101(0.327)−0.174(0.386)
Numeracy score 0.103(0.270)−0.403(0.333)−0.059(0.281)−0.349(0.279)0.051(0.307)−0.001(0.187)−0.121(0.215)−0.683***(0.260)−0.315(0.224)0.002(0.220)−0.274(0.336)0.220(0.203)0.339(0.296)0.528**(0.212)−0.239(0.215)−0.186(0.417)0.019(0.163)−0.246(0.268)−0.112(0.246)−0.195(0.266)0.072(0.263)−0.219(0.328)0.101(0.333)
Agreeableness 0.001(0.001)−0.004(0.003)0.000(0.001)0.000(0.001)0.000(0.001)0.001(0.001)−0.001(0.001)0.000(0.000)0.000(0.000)0.000(0.001)0.000(0.004)0.001(0.002)0.000(0.001)0.000(0.001)0.000(0.000)0.000(0.002)0.000(0.001)−0.002(0.001)0.000(0.000)0.000(0.001)0.000(0.000)−0.001(0.001)−0.002(0.001)
Conscientiousness 0.002(0.001)−0.002(0.002)0.001(0.001)−0.002(0.002)0.002(0.003)−0.001(0.002)0.000(0.000)0.001(0.001)−0.001(0.002)0.001(0.002)0.000(0.004)−0.004*(0.002)−0.002(0.002)−0.001(0.001)0.000(0.001)0.003(0.006)0.000(0.001)−0.002(0.003)0.004(0.002)0.000(0.002)−0.001(0.001)0.000(0.000)−0.002(0.003)
Extraversion −0.000*(0.000)0.000(0.000)−0.001(0.001)0.000(0.001)−0.001(0.000)0.000(0.000)0.000(0.000)0.000(0.000)−0.001**(0.000)0.000*(0.000)−0.001(0.001)0.000(0.000)0.000(0.000)0.000(0.000)0.000(0.000)−0.004(0.003)0.000(0.001)−0.001(0.001)0.000(0.000)0.000(0.000)0.000(0.000)0.000(0.000)0.000(0.001)
Emot. S. −0.001(0.001)0.000(0.001)0.000(0.001)0.000(0.001)0.001(0.002)0.000(0.001)0.001(0.001)0.002(0.001)0.000(0.001)0.001(0.001)0.002(0.002)0.000(0.001)0.000(0.001)−0.001(0.002)0.000(0.001)0.000(0.004)0.001(0.001)0.000(0.002)−0.001(0.001)0.000(0.001)0.000(0.001)−0.002(0.002)0.002(0.001)
Open-mindedness −0.001(0.001)0.000(0.000)0.000(0.000)0.000(0.001)0.001(0.001)0.000(0.000)0.000(0.000)0.000(0.000)0.000(0.001)−0.001(0.001)−0.001(0.002)0.000(0.001)0.000(0.000)0.000(0.000)0.000(0.001)0.000(0.001)−0.001(0.001)0.001(0.002)0.002(0.001)0.000(0.000)−0.001(0.000)0.000(0.001)0.000(0.000)
Intercept −0.238(0.182)0.335*(0.185)0.161(0.166)0.031(0.178)0.175(0.180)0.171(0.107)0.071(0.113)0.411**(0.172)0.177(0.136)0.082(0.133)0.472**(0.207)0.053(0.156)−0.202(0.185)0.159(0.130)0.182(0.130)0.227(0.224)0.201(0.124)0.189(0.193)−0.106(0.135)0.067(0.148)0.010(0.156)0.087(0.213)0.128(0.188)

Note(s): Significance level *** p < 0.01, ** p < 0.05, *p < 0.1

Table A4.

Detailed Oaxaca decomposition of downward mobility

VariableAUTBELCANCHLHRVCZEESTFINFRAHUNIRLISRITALVALTUNZLPOLPRTSGPSVKESPCHEGBR
Probability                       
Females 0.154***(0.010)0.077***(0.008)0.148***(0.011)0.087***(0.008)0.076***(0.007)0.113***(0.008)0.129***(0.006)0.084***(0.007)0.086***(0.007)0.084***(0.006)0.074***(0.010)0.077***(0.008)0.058***(0.008)0.103***(0.008)0.113***(0.007)0.155***(0.016)0.040***(0.005)0.021***(0.005)0.018***(0.004)0.069***(0.006)0.082***(0.007)0.139***(0.010)0.107***(0.009)
Males 0.139***(0.011)0.146***(0.010)0.217***(0.014)0.110***(0.011)0.114***(0.010)0.130***(0.010)0.258***(0.009)0.160***(0.010)0.110***(0.008)0.124***(0.008)0.121***(0.013)0.170***(0.010)0.050***(0.008)0.207***(0.012)0.237***(0.012)0.209***(0.023)0.063***(0.006)0.056***(0.009)0.034***(0.005)0.110***(0.009)0.095***(0.008)0.108***(0.008)0.136***(0.012)
Difference 0.016(0.015)−0.069***(0.013)−0.068***(0.018)−0.023(0.014)−0.038***(0.012)−0.017(0.012)−0.129***(0.011)−0.077***(0.013)−0.024**(0.010)−0.040***(0.010)−0.046***(0.016)−0.092***(0.013)0.009(0.012)−0.104***(0.014)−0.124***(0.014)−0.054**(0.027)−0.022***(0.008)−0.035***(0.010)−0.016**(0.006)−0.041***(0.011)−0.013(0.010)0.031**(0.013)−0.029**(0.015)
Explained 0.033***(0.010)0.013(0.010)0.015(0.012)0.018***(0.006)0.002(0.006)0.008(0.006)−0.007(0.009)0.015(0.010)0.005(0.007)−0.008(0.005)−0.001(0.009)0.004(0.007)0.011*(0.006)−0.013(0.010)−0.013*(0.007)0.036*(0.021)0.000(0.003)−0.006(0.004)−0.002(0.002)−0.004(0.004)−0.005(0.004)0.033***(0.008)0.011(0.009)
Unexplained −0.017(0.020)−0.082***(0.017)−0.084***(0.022)−0.040**(0.017)−0.040***(0.014)−0.026*(0.014)−0.123***(0.014)−0.092***(0.017)−0.030**(0.012)−0.032***(0.011)−0.045**(0.018)−0.096***(0.014)−0.002(0.014)−0.091***(0.016)−0.111***(0.015)−0.090**(0.041)−0.022**(0.009)−0.029***(0.011)−0.014**(0.006)−0.037***(0.011)−0.007(0.011)−0.002(0.017)−0.040**(0.017)
Explained part                       
Age 35–44 0.001(0.000)0.000(0.000)0.000(0.000)0.000(0.001)0.000(0.000)0.000(0.000)0.000(0.000)−0.001***(0.000)0.000(0.000)0.001**(0.000)0.000(0.000)−0.001(0.001)0.000*(0.000)0.001(0.000)0.000(0.001)0.000(0.001)−0.001(0.011)0.000(0.000)0.001(0.001)0.000(0.000)0.000(0.000)−0.000***(0.000)0.000(0.000)
Age 45–54 −0.000*(0.000)0.001*(0.000)0.001***(0.000)−0.000**(0.000)0.000(0.000)0.000(0.000)0.001***(0.000)0.002***(0.000)0.000**(0.000)0.000**(0.000)0.000(0.004)0.001(0.000)−0.000*(0.000)−0.001**(0.000)−0.000**(0.000)0.002(0.002)0.000(0.007)0.001(0.001)0.001(0.001)0.000(0.000)0.000(0.000)−0.001***(0.000)0.000(0.000)
Age 55 plus −0.000*(0.000)−0.001***(0.000)−0.003***(0.001)−0.001***(0.001)−0.001(0.001)0.000(0.000)−0.006***(0.001)−0.004***(0.001)−0.001***(0.000)−0.001***(0.000)0.001(0.015)0.000(0.000)−0.001**(0.000)−0.003***(0.001)−0.008***(0.001)−0.000*(0.000)0.001(0.017)−0.002(0.001)−0.001(0.002)−0.001***(0.000)−0.002*(0.001)0.000***(0.000)−0.001**(0.000)
Books (yes) 0.002**(0.001)0.000(0.000)0.000(0.000)−0.000**(0.000)0.000(0.000)0.001*(0.001)0.001**(0.000)0.001**(0.000)0.001**(0.001)0.003***(0.001)−0.001(0.015)0.000(0.000)0.000(0.000)0.002*(0.001)0.000(0.000)0.000(0.000)0.000(0.007)−0.001(0.000)0.000(0.000)0.002**(0.001)0.000(0.000)−0.000***(0.000)0.001***(0.000)
Semi-skilled white 0.000*(0.000)0.000(0.000)−0.002**(0.001)−0.001*(0.000)0.001(0.001)−0.000***(0.000)0.000(0.000)0.001***(0.000)0.000(0.000)0.000(0.000)0.000(0.000)0.001*(0.001)0.000(0.000)0.001**(0.000)−0.000*(0.000)−0.002(0.001)0.000(0.008)0.001(0.001)−0.002(0.003)0.000(0.000)0.001(0.001)−0.001***(0.000)0.002**(0.001)
Semi-skilled blue −0.001**(0.000)0.002***(0.001)0.000***(0.000)0.002***(0.001)−0.003(0.003)0.005***(0.001)−0.002***(0.000)−0.002***(0.000)−0.002***(0.000)0.001***(0.000)0.000(0.007)−0.000*(0.000)−0.000**(0.000)0.001***(0.000)0.002***(0.000)0.006**(0.003)0.000(0.009)−0.002(0.002)0.002(0.003)0.000*(0.000)−0.000*(0.000)0.002***(0.000)−0.002***(0.001)
Elementary 0.001***(0.000)0.001***(0.000)−0.001**(0.000)−0.002***(0.001)0.002(0.002)−0.006***(0.001)0.000(0.000)−0.002***(0.001)−0.001***(0.000)−0.001***(0.000)−0.001(0.009)−0.004(0.003)0.000(0.000)−0.003***(0.001)−0.003***(0.001)−0.004**(0.002)0.001(0.020)−0.004(0.003)−0.002(0.004)−0.001***(0.000)−0.001*(0.000)−0.003***(0.001)0.001***(0.000)
N. of siblings 0.000(0.001)0.000(0.000)0.001(0.001)0.000(0.000)−0.001(0.001)0.000(0.000)0.000(0.000)0.000**(0.000)0.000(0.000)0.001**(0.000)0.000(0.004)0.000(0.000)0.000(0.000)0.000(0.001)0.000(0.000)0.000(0.000)−0.001(0.013)−0.004(0.003)0.000(0.001)0.000(0.000)0.000(0.000)0.000(0.000)0.000(0.000)
Literacy score 0.002**(0.001)0.000(0.000)0.001(0.001)0.000(0.001)0.000(0.001)0.000(0.001)−0.007*(0.004)0.003(0.003)−0.003**(0.001)−0.006***(0.002)0.003(0.043)0.002(0.002)0.000(0.000)−0.003*(0.002)−0.006**(0.003)0.001(0.005)−0.001(0.019)0.002(0.002)−0.001(0.001)0.000(0.000)0.005**(0.002)−0.002**(0.001)0.003(0.002)
Numeracy score 0.034***(0.007)0.018***(0.006)0.030***(0.010)0.011**(0.004)0.000(0.000)0.012**(0.005)0.014***(0.004)0.018***(0.006)0.004(0.003)0.000(0.001)−0.001(0.010)0.008(0.006)−0.001(0.003)0.007(0.006)0.003*(0.002)0.029**(0.015)0.000(0.007)−0.001(0.005)0.004(0.010)0.001*(0.001)−0.004(0.004)0.038***(0.008)0.012(0.009)
Agreeableness −0.007*(0.004)−0.013***(0.004)−0.007**(0.004)−0.002*(0.001)−0.001(0.001)−0.002(0.002)−0.005(0.004)0.000(0.003)0.001(0.002)−0.003(0.002)−0.002(0.021)0.002(0.002)0.001(0.002)−0.011**(0.004)−0.004(0.003)0.000(0.008)0.001(0.012)−0.002(0.003)0.002(0.006)−0.001(0.003)−0.002(0.001)−0.001(0.002)−0.005(0.003)
Conscientiousness −0.001(0.002)−0.002(0.002)−0.007***(0.002)0.002(0.002)0.000(0.001)0.003***(0.001)−0.005**(0.002)−0.001**(0.001)−0.003**(0.001)−0.003**(0.001)0.002(0.022)−0.002(0.002)0.002**(0.001)−0.001**(0.000)0.000(0.001)0.000(0.002)0.001(0.018)−0.001(0.003)−0.004(0.009)0.000(0.000)−0.004(0.003)−0.002**(0.001)−0.002(0.002)
Extraversion −0.001(0.001)0.000(0.000)0.000(0.000)0.000(0.000)0.000(0.000)0.000(0.000)0.002(0.002)−0.001(0.001)0.000(0.001)0.000(0.000)0.000(0.002)0.000(0.001)0.001(0.001)0.000(0.001)−0.002**(0.001)0.000(0.001)−0.001(0.012)0.000(0.000)−0.003(0.006)0.000(0.001)0.002(0.001)0.000(0.000)0.000(0.000)
Emot. S 0.003(0.003)0.008*(0.004)0.001(0.005)0.007**(0.003)0.002(0.003)−0.003(0.004)0.001(0.002)0.002(0.003)0.006(0.004)0.002(0.003)−0.002(0.028)0.000(0.002)0.008*(0.005)0.001(0.006)0.006***(0.002)0.004(0.003)−0.004(0.072)0.005(0.006)0.002(0.004)−0.001(0.003)0.001(0.004)0.004(0.003)0.002(0.003)
Open-mindedness (0.000)−0.001**(0.000)0.000(0.001)0.001**(0.001)0.003(0.004)0.000(0.000)0.000(0.002)0.000(0.000)0.001(0.001)−0.001(0.001)0.000(0.004)−0.001(0.001)0.000(0.001)−0.004*(0.002)0.001(0.002)0.001(0.001)0.002(0.049)0.002(0.002)0.000(0.001)−0.003*(0.002)0.000(0.000)0.000(0.000)−0.001(0.001)
Unexplained part                       
Age 35–44 0.002(0.012)−0.016*(0.008)0.003(0.011)0.004(0.012)0.035(0.044)−0.003(0.016)−0.021**(0.008)−0.015*(0.008)−0.005(0.006)−0.004(0.008)−0.003(0.015)−0.004(0.010)0.002(0.033)−0.006(0.009)−0.015*(0.008)0.016(0.019)0.002(0.005)0.000(0.014)0.005(0.004)−0.001(0.007)0.016(0.055)−0.001(0.006)0.012(0.013)
Age 45–54 0.030(0.024)0.000(0.009)0.006(0.010)0.000(0.012)0.019(0.029)−0.009(0.018)−0.008(0.008)−0.020**(0.009)−0.001(0.006)0.014(0.010)−0.006(0.016)0.008(0.009)−0.001(0.013)0.002(0.009)0.010(0.010)0.012(0.026)0.005(0.004)0.010(0.022)0.007(0.006)0.003(0.006)0.048(0.162)−0.001(0.008)−0.014(0.013)
Age 55 plus 0.018(0.022)−0.012(0.011)0.024(0.016)0.000(0.011)0.066(0.072)0.022(0.021)0.000(0.010)−0.005(0.013)−0.001(0.007)0.010(0.009)0.043*(0.025)0.023***(0.008)0.000(0.011)−0.006(0.011)−0.001(0.013)0.031(0.026)0.005(0.005)−0.002(0.023)−0.003(0.006)0.000(0.008)0.047(0.162)−0.003(0.024)−0.008(0.015)
Books (yes) −0.027(0.023)−0.030***(0.010)0.009(0.014)−0.001(0.005)0.034(0.034)−0.030(0.032)0.006(0.018)−0.023(0.015)0.004(0.007)−0.019(0.016)0.004(0.013)−0.006(0.011)0.008(0.109)0.008(0.015)0.003(0.009)0.027(0.028)−0.002(0.003)−0.011(0.015)0.001(0.002)0.003(0.006)−0.022(0.079)0.001(0.008)−0.024(0.019)
Semi-skilled white 0.000(0.011)−0.002(0.007)−0.009(0.008)−0.003(0.010)−0.013(0.024)0.017(0.017)0.008*(0.005)0.000(0.008)−0.003(0.005)0.005(0.006)0.004(0.010)−0.013*(0.008)0.004(0.061)0.004(0.006)−0.001(0.005)−0.010(0.015)−0.001(0.002)0.014(0.016)0.005(0.004)−0.002(0.004)−0.020(0.066)−0.001(0.004)0.015(0.014)
Semi-skilled blue 0.014(0.030)0.004(0.013)−0.006(0.016)−0.026(0.017)0.073(0.095)0.054(0.053)0.008(0.014)−0.003(0.017)−0.004(0.010)0.009(0.018)−0.011(0.021)0.002(0.013)0.010(0.144)0.017(0.014)−0.013(0.015)0.036(0.033)−0.006(0.012)0.023(0.043)0.006(0.005)−0.007(0.012)−0.053(0.165)−0.003(0.026)−0.004(0.015)
Elementary 0.006(0.013)−0.005(0.006)0.000(0.007)−0.017(0.013)0.057(0.072)0.006(0.012)0.013**(0.005)0.011(0.007)0.000(0.005)0.002(0.008)0.001(0.010)−0.002(0.007)0.004(0.064)0.015**(0.008)−0.007(0.012)0.022(0.017)−0.002(0.003)0.022(0.033)0.002(0.003)−0.008(0.005)−0.039(0.124)0.000(0.001)0.022(0.014)
N. of siblings −0.026(0.035)−0.015(0.022)0.030(0.030)0.021(0.034)−0.047(0.069)0.011(0.032)0.006(0.016)−0.013(0.022)0.012(0.014)−0.010(0.016)−0.023(0.053)−0.065*(0.039)−0.008(0.117)−0.004(0.014)0.029(0.018)0.053(0.058)−0.017(0.011)0.000(0.045)−0.012(0.014)0.002(0.016)−0.125(0.413)0.002(0.017)0.019(0.032)
Literacy score 0.113(0.266)−0.085(0.186)0.272(0.274)−0.337*(0.186)0.199(0.490)0.220(0.317)−0.237(0.172)−0.308(0.219)−0.159(0.130)0.061(0.157)0.261(0.337)0.081(0.161)−0.114(1.580)0.164(0.169)−0.112(0.196)−0.745(0.574)0.046(0.059)0.335(0.400)−0.024(0.064)0.103(0.121)0.279(1.064)0.019(0.146)−0.096(0.345)
Numeracy score −0.099(0.243)−0.044(0.171)−0.267(0.257)0.288(0.188)−0.061(0.448)−0.204(0.315)0.043(0.175)0.124(0.211)0.067(0.119)−0.067(0.145)−0.139(0.268)−0.139(0.140)0.081(1.119)−0.288*(0.165)0.087(0.185)0.620(0.540)−0.052(0.057)−0.169(0.259)−0.024(0.054)−0.155(0.109)−0.096(0.516)−0.027(0.209)−0.072(0.297)
Agreeableness −0.001(0.002)0.002(0.003)0.000(0.001)0.002*(0.001)−0.003(0.003)−0.002(0.002)0.001(0.001)0.000(0.001)0.000(0.000)−0.001(0.001)0.002(0.004)0.001(0.002)0.000(0.001)−0.004**(0.001)0.000(0.001)−0.001(0.002)−0.001(0.000)0.000(0.003)0.000(0.000)0.001(0.001)−0.001(0.002)0.000(0.000)0.003(0.002)
Conscientiousness 0.001(0.002)0.000(0.002)−0.002(0.001)0.000(0.002)0.004(0.006)0.003(0.003)−0.001(0.001)0.000(0.001)0.001(0.001)0.000(0.001)−0.002(0.003)0.001(0.002)0.000(0.003)−0.001(0.001)0.001(0.001)−0.004(0.008)0.000(0.000)0.003(0.006)0.000(0.001)0.000(0.001)0.004(0.013)0.000(0.000)0.001(0.003)
Extraversion 0.000(0.000)0.000(0.000)−0.001(0.001)−0.001(0.001)0.001(0.001)0.000(0.000)0.000(0.001)0.000(0.000)0.001**(0.000)0.000(0.000)0.000(0.000)0.000(0.000)0.000(0.001)0.000(0.000)0.000(0.000)−0.001(0.003)0.000(0.000)0.000(0.000)0.000(0.000)0.000(0.000)0.000(0.001)0.000(0.000)0.000(0.000)
Emot. S 0.000(0.001)0.000(0.001)0.001(0.001)0.001(0.001)0.000(0.002)−0.001(0.001)0.000(0.000)0.000(0.001)0.001(0.000)0.000(0.000)0.000(0.001)0.001(0.001)0.000(0.002)0.000(0.001)0.000(0.000)0.002(0.004)0.000(0.000)−0.002(0.002)0.000(0.000)0.000(0.000)0.000(0.001)0.000(0.002)0.001(0.001)
Open-mindedness 0.003(0.002)0.000(0.000)0.000(0.000)0.001(0.001)−0.004(0.003)0.000(0.001)−0.001(0.000)0.000*(0.000)0.000(0.000)0.000(0.000)0.002(0.002)0.000(0.001)0.000(0.003)0.000(0.000)0.000(0.000)0.000(0.001)0.000(0.000)0.003(0.003)0.000(0.000)0.000(0.000)0.000(0.001)0.000(0.001)0.000(0.000)
Intercept −0.050(0.163)0.119(0.090)−0.145(0.133)0.029(0.107)−0.400(0.512)−0.110(0.186)0.059(0.089)0.161(0.121)0.059(0.059)−0.032(0.081)−0.179(0.189)0.016(0.099)0.011(0.168)0.007(0.088)−0.093(0.101)−0.147(0.200)0.001(0.035)−0.256(0.300)0.023(0.032)0.023(0.058)−0.046(0.262)0.012(0.092)0.104(0.149)

Note(s): Significance level ***p < 0.01, ** p < 0.05, *p < 0.1

Supplements

Supplementary data

References

Almlund
,
M.
,
Duckworth
,
A.L.
,
Heckman
,
J.J.
, and
Kautz
,
T.
(
2011
), “Personality psychology and economics”,
Handbook of the Economics of Education
,
4
, pp.
1
-
181
, doi: .
Anger
,
S.
(
2011
), “
The intergenerational transmission of cognitive and non-cognitive skills during adolescence and young adulthood
”,
SSRN Electronic Journal
.
Aucejo
,
E.
and
James
,
J.
(
2021
), “
The path to college education: the role of math and verbal skills
”,
Journal of Political Economy
, Vol.
129
No.
10
, pp.
2905
-
2946
, doi: .
Barro
,
R.
and
Lee
,
J.-W.
(
2013
), “
A new data set of educational attainment in the world, 1950-2010
”,
Journal of Development Economics
, Vol.
104
, pp.
184
-
198
.
Battisti
,
M.
,
Fedorets
,
A.
and
Kinne
,
L.
(
2023
), “
Cognitive skills among adults: an impeding factor for gender convergence?
”,
SSRN Electronic Journal
.
Bertrand
,
M.
(
2011
), “
New perspectives on gender
”,
Handbook of Labor Economics
, Vol.
4
, pp.
1543
-
1590
.
Blinder
,
A.S.
(
1973
), “
Wage discrimination: Reduced form and structural estimates
”,
The Journal of Human Resources
, Vol.
8
No.
4
, pp.
436
-
455
, doi: .
Borgonovi
,
F.
,
Choi
,
Á.
and
Paccagnella
,
M.
(
2021
), “
The evolution of gender gaps in numeracy and literacy between childhood and young adulthood
”,
Economics of Education Review
, Vol.
82
, p.
102119
, doi: .
Breen
,
R.
and
Goldthorpe
,
J.H.
(
1997
), “
Explaining educational differentials: towards a formal rational action theory
”,
Rationality and Society
, Vol.
9
No.
3
, pp.
275
-
305
, doi: .
Chetty
,
R.
,
Hendren
,
N.
,
Kline
,
P.
and
Saez
,
E.
(
2014
), “
Where is the land of opportunity? The geography of intergenerational mobility in the United States
”,
The Quarterly Journal of Economics
, Vol.
129
No.
4
, pp.
1553
-
1623
, doi: .
Cornwell
,
C.
,
Mustard
,
D.B.
and
Van Parys
,
J.
(
2013
), “
Noncognitive skills and the gender disparities in test scores and teacher assessments: evidence from primary school
”,
Journal of Human Resources
, Vol.
48
No.
1
, pp.
236
-
264
, doi: .
Cunha
,
F.
and
Heckman
,
J.
(
2007
), “
The technology of skill formation
”,
American Economic Review
, Vol.
97
No.
2
, pp.
31
-
47
, doi: .
Deary
,
I.J.
,
Strand
,
S.
,
Smith
,
P.
and
Fernandes
,
C.
(
2007
), “
Intelligence and educational achievement
”,
Intelligence
, Vol.
35
No.
1
, pp.
13
-
21
, doi: .
Delaney
,
J.M.
, and
Devereux
,
P.J.
(
2021
), “The economics of gender and educational achievement: Stylized facts and causal evidence”, In
Oxford Research Encyclopedia of Economics and Finance
, doi: .
Duncan
,
G.J.
and
Magnuson
,
K.
(
2012
), “
Socioeconomic status and cognitive functioning: moving from correlation to causation”, Duncan, G.J., Magnuson, K. (2012), “socioeconomic status and cognitive functioning: moving from correlation to causation
”,
WIREs Cognitive Science
, Vol.
3
No.
3
, pp.
377
-
386
.
Duong
,
K.
(
2024
), “
What really matters for global intergenerational mobility?
”,
Plos One
, Vol.
19
No.
6
, p.
e0302173
, doi: .
Edwards
,
R.
,
Gibson
,
R.
,
Harmon
,
C.
and
Schurer
,
S.
(
2022
), “
First-in-their-family students at university: Can non-cognitive skills compensate for social origin?
”,
Economics of Education Review
, Vol.
91
, p.
102318
, doi: .
Encinas-Martín
,
M.
, and
Cherian
,
M.
(
2023
),
Gender, Education and Skills: The Persistence of Gender Gaps in Education and Skills (OECD Skills Studies)
,
OECD Publishing
, doi: .
Erikson
,
R.
(
1984
), “
Social class of men, women and families
”,
Sociology
, Vol.
18
No.
4
, pp.
500
-
514
, doi: .
Flinn
,
C.J.
,
Todd
,
P.E.
and
Zhang
,
W.
(
2025
), “
Labor market returns to personality: a job search approach to understanding gender gaps
”,
Journal of Political Economy
, Vol.
133
No.
4
, pp.
1169
-
1234
, doi: .
Hanushek
,
E.A.
,
Schwerdt
,
G.
,
Wiederhold
,
S.
and
Woessmann
,
L.
(
2015
), “
Returns to skills around the world: Evidence from PIAAC
”,
European Economic Review
, Vol.
73
, pp.
103
-
130
, doi: .
Heckman
,
J.J.
and
Kautz
,
T.
(
2012
), “
Hard evidence on soft skills
”,
Labour Economics
, Vol.
19
No.
4
, pp.
451
-
464
, doi: .
Heckman
,
J.J.
,
Stixrud
,
J.
and
Urzua
,
S.
(
2006
), “
The effects of cognitive and noncognitive abilities on labor market outcomes and social behavior
”,
Journal of Labor Economics
, Vol.
24
No.
3
, pp.
411
-
482
, doi: .
Hu
,
Y.
and
Qian
,
Y.
(
2023
), “
Gender, education expansion and intergenerational educational mobility around the world
”,
Nature Human Behaviour
, Vol.
7
No.
4
, pp.
583
-
595
, available at: Link to Cycle 2 PIAAC technical standards and guidelinesLink to a pdf of the cited article.
Jann
,
B.
(
2008
), “
The Blinder–Oaxaca decomposition for linear regression models
”,
The Stata Journal
, Vol.
8
No.
4
, pp.
453
-
479
.
Jerrim
,
J.
,
Lopez-Agudo
,
L.A.
,
Marcenaro-Gutierrez
,
O.D.
and
Shure
,
N.
(
2017
), “
What happens when econometrics and psychometrics collide? An example using the PISA data
”,
Economics of Education Review
, Vol.
61
, pp.
51
-
58
.
Kim
,
L.E.
,
Poropat
,
A.E.
, and
MacCann
,
C.
(
2016
), “Conscientiousness in education: Its conceptualization, assessment, and utility”,
Psychosocial Skills and School Systems in the 21st Century
,
Springer
, pp.
155
-
185
.
Leone
,
T.
(
2021
), “
The gender gap in intergenerational mobility
”,
World Development Perspectives
, Vol.
21
, p.
100286
, doi: .
Liu
,
Q.
and
Ding
,
R.
(
2020
), “Does poverty matter or inequality? An international comparative analysis on the intergenerational education persistence”, In
Education and Mobilities: Ideas, People and Technologies
,
Springer
, pp.
187
-
205
.
Lundborg
,
P.
,
Nordin
,
M.
and
Rooth
,
D.O.
(
2018
), “
The intergenerational transmission of human capital: the role of skills and health
”,
Journal of Population Economics
, Vol.
31
No.
4
, pp.
1035
-
1065
, doi: .
Mendez
,
I.
and
Zamarro
,
G.
(
2018
), “
The intergenerational transmission of noncognitive skills and their effect on education and employment outcomes
”,
Journal of Population Economics
, Vol.
31
No.
2
, pp.
521
-
560
, doi: .
Mood
,
C.
,
Jonsson
,
J.O.
and
Bihagen
,
E.
(
2012
), “Socioeconomic persistence across generations: Cognitive and noncognitive processes”, In
J.
Ermisch
,
M.
Jäntti
, and
T.
Smeeding
(Eds),
From Parents to Children
,
Russell Sage Foundation
, pp.
53
-
85
.
Narayan
,
A.
,
Van der Weide
,
R.
,
Cojocaru
,
A.
,
Lakner
,
C.
,
Redaelli
,
S.
,
Mahler
,
D.G.
, …
Thewissen
,
S.
(
2018
),
Fair Progress?: Economic Mobility across Generations around the World
,
World Bank Publications
.
Nennstiel
,
R.
and
Becker
,
R.
(
2023
), “
Gendered intergenerational educational mobility patterns converge in the cohort sequence: evidence from Switzerland using administrative data
”,
Frontiers in Sociology
, Vol.
8
, p.
1172553
, doi: .
Oaxaca
,
R.
(
1973
), “
Male-female wage differentials in urban labor markets
”,
International Economic Review
, Vol.
14
No.
3
, pp.
693
-
709
, doi: .
Oberdabernig
,
D.
and
Schneebaum
,
A.
(
2017
), “
Catching up? The educational mobility of migrants’ and natives’ children in Europe
”,
Applied Economics
, Vol.
49
No.
37
, pp.
3701
-
3728
, doi: .
OECD
(
2022
), “
Cycle 2 PIAAC technical standards and guidelines
”,
available at:
Link to Cycle 2 PIAAC technical standards and guidelinesLink to a pdf of the cited article.
Paccagnella
,
M.
(
2015
), “
Skills and wage inequality: Evidence from PIAAC
”,
OECD Education Working Papers
, Vol.
114
, pp.
1
-
32
.
Palczyńska
,
M.
and
Świst
,
K.
(
2018
), “
Personality, cognitive skills and life outcomes: evidence from the Polish follow-up study to PIAAC
”,
Large-scale Assessments in Education
, Vol.
6
No.
1
, pp.
1
-
23
.
Plomin
,
R.
and
Deary
,
I.
(
2015
), “
Genetics and intelligence differences: five special findings
”,
Molecular Psychiatry
, Vol.
20
No.
1
, pp.
98
-
108
, doi: .
Rammstedt
,
B.
,
Danner
,
D.
and
Lechner
,
C.
(
2017
), “
Personality, competencies, and life outcomes: Results from the German PIAAC longitudinal study
”,
Large-Scale Assessments in Education
, Vol.
5
No.
1
, pp.
1
-
24
, doi: .
Rammstedt
,
B.
,
Lechner
,
C.M.
and
Danner
,
D.
(
2024
), “
Beyond literacy: the incremental value of noncognitive skills
”,
OECD Education Working Papers
, Vol.
311
, pp.
1
-
26
.
Rammstedt
,
B.
,
Roemer
,
L.
,
Roth
,
M.
,
Zabal
,
A.
and
Lechner
,
C.
(
2025
), “
Revisiting gender differences in personality: new evidence on big five domains and facets with large-scale samples from 27 nations
”.
Shapira
,
M.
(
2012
), “
An exploration of differences in mathematics attainment among immigrant pupils in 18 OECD countries
”,
European Educational Research Journal
, Vol.
11
No.
1
, pp.
68
-
95
, doi: .
Soto
,
C.J.
,
John
,
O.P.
,
Gosling
,
S.D.
and
Potter
,
J.
(
2011
), “
Age differences in personality traits from 10 to 65: big five domains and facets in a large cross-sectional sample
”,
Journal of Personality and Social Psychology
, Vol.
100
No.
2
, pp.
330
-
348
, doi: .
Torche
,
F.
(
2015
), “
Intergenerational mobility and gender in Mexico
”,
Social Forces
, Vol.
94
No.
2
, pp.
563
-
587
.
Van der Weide
,
R.
,
Lakner
,
C.
,
Mahler
,
D.G.
,
Narayan
,
A.
and
Gupta
,
R.
(
2024
), “
Intergenerational mobility around the world: a new database
”,
Journal of Development Economics
, Vol.
166
, p.
103167
, doi: .
Vera‐Toscano
,
E.
,
Rodrigues
,
M.
and
Costa
,
P.
(
2017
), “
Beyond educational attainment: the importance of skills and lifelong learning for social outcomes. Evidence for Europe from PIAAC
”,
European Journal of Education
, Vol.
52
No.
2
, pp.
217
-
231
, doi: .
Weisberg
,
Y.J.
,
DeYoung
,
C.G.
and
Hirsh
,
J.B.
(
2011
), “
Gender differences in personality across the ten aspects of the big five
”,
Frontiers in Psychology
, Vol.
2
, p.
178
, doi: .
Yun
,
M.S.
(
2004
), “
Decomposing differences in the first moment
”,
Economics Letters
, Vol.
82
No.
2
, pp.
275
-
280
, doi: .
Deary
,
I.J.
(
2014
), “
The stability of intelligence from childhood to old age
”,
Current Directions in Psychological Science
, Vol.
23
No.
4
, pp.
239
-
245
.
Hanushek
,
E.A.
,
Jacobs
,
B.
,
Schwerdt
,
G.
,
Van der Velden
,
R.
,
Vermeulen
,
S.
and
Wiederhold
,
S.
(
2021
),
The Intergenerational Transmission of Cognitive Skills: An Investigation of the Causal Impact of Families on Student Outcomes (No. w29450)
,
National Bureau of Economic Research
, doi: .
OECD
(
2009
),
PISA Data Analysis Manual: SPSS
, (second)
OECD Publishing
,
edition. Paris
.
OECD
(
2024
), “
Do adults have the skills they need to thrive in a changing world?: survey of adult skills 2023
”,
OECD Publishing
.
Vecchione
,
M.
,
Alessandri
,
G.
,
Barbaranelli
,
C.
and
Caprara
,
G.
(
2012
), “
Gender differences in the big five personality development: a longitudinal investigation from late adolescence to emerging adulthood
”,
Personality and Individual Differences
, Vol.
53
No.
6
, pp.
740
-
746
, doi: .

Languages

or Create an Account

Close Modal
Close Modal