


Pedestrian crossing intention prediction based on computer vision plays a pivotal role in enhancing the safety of autonomous driving and advanced driver assistance systems. In this paper, we present a novel multi-modal pedestrian crossing intention prediction framework leveraging the transformer model. By integrating diverse sources of information and leveraging the transformer’s sequential modeling and parallelization capabilities, our system accurately predicts pedestrian crossing intentions. We introduce a novel representation of traffic environment data and incorporate lifted 3D human pose and head orientation data to enhance the model’s understanding of pedestrian behavior. Experimental results demonstrate the state-of-the-art accuracy of our proposed system on benchmark datasets.
1 Introduction
In the era of automation and artificial intelligence, automotive technologies are developing toward autonomous driving. In addition to bringing convenience to human life, autonomous driving or ADAS (Advanced Driver Assistance Systems) can also significantly improve safety. Vehicles equipped with such systems can reduce accidents caused by human mistakes or careless driving behaviors.
In systems aimed at road safety, safeguarding vulnerable road users, especially pedestrians, emerges as a critical objective. In contrast to individuals protected by the sturdy framework of a vehicle, pedestrians are significantly more vulnerable in traffic environment, emphasizing the importance of accurately predicting their movements. However, predicting pedestrian behavior poses a formidable challenge due to the unpredictable nature of their movements and the constraints of available data.
In recent years, considerable attention has been devoted to Pedestrian Crossing Intention Prediction, which is to predict whether pedestrians intend to cross the road by analyzing various factors such as pedestrian images, postures, behaviors, and surrounding environmental cues. The ultimate goal is to predict pedestrians’ crossing intentions a few seconds before they initiate the crossing. Figure 1 depicts an example of the task.
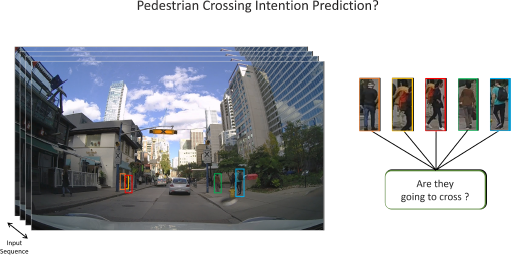
The system needs to determine whether the pedestrians on the road will cross in front of the ego-vehicle.
The system needs to determine whether the pedestrians on the road will cross in front of the ego-vehicle.
In the early stages, research in this field was relatively scarce. Rasouli et al. [24] proposed the JAAD dataset, which provided a clear direction and reference standard for predicting pedestrian crossing behavior and annotations on pedestrian behavior. Later, the same group of authors released the PIE dataset [22], which fixed several shortcomings of the JAAD dataset. The information about pedestrians and surrounding traffic was richer. Since then, the number and diversity of related studies have increased.
Compared with vision-based pedestrian intention prediction in the past, some works have focused on including additional information related to pedestrians, such as human pose, trajectory, bounding box movement. Therefore, multi-modal methods combine multiple types of information into the prediction model. Besides the information about pedestrians themselves, surrounding environment data has also been introduced into the prediction system, including ego-vehicles speed, surrounding environment images and traffic status.
However, some additional information still has not been exploited in this task. Both JAAD and PIE datasets provide rich road environment information that has not been fully utilized. In addition, with the introduction of the Transformer [33], it becomes a more suitable model architecture for predicting pedestrian crossing intention because of the advantage of being parallelizable for better computational efficiency and the ability to model the temporal information of sequential data. Moreover, a benchmark for evaluating pedestrian action prediction [13] has been released. This evaluation standard solves the problem of inconsistent standards for comparing previous methods. However, we have observed that the testing environment in several previous works may not necessarily follow the benchmark settings.
In this paper, We explore different information cues and develop a novel information fusion model based on the Transformer architecture to propose an accurate pedestrian crossing intention prediction model that could handle more complex scenarios and provide reliable performance while following the Benchmark [13] settings.
The main contributions of this paper are summarized as follows:
We propose a multi-modal method based on the transformer architecture and uses nine different types of input data for predicting pedestrian crossing intention that achieves state-of-the-art performance.
In a novel way, we are the first to combine traffic light, crosswalk, and road sign data into new traffic awareness data. This has been demonstrated in our experiments to improve the accuracy of our method.
Our method uses lifted 3D human pose and 3D head orientation information to provide 3D pedestrian information for the model, which allows it be adapted to a wide variety of scenarios.
2 Related Work
There have been many related studies on pedestrian crossing intention prediction in the past. Initially, the most intuitive and simple way based on vision was to directly analyze the possibility of pedestrians crossing the road through a single image from the driver’s view [24, 32, 13]. However, the information from a single image provides very limited and insufficient information to make an accurate prediction.
2.1 Sequential Modeling
Later, most methods used a sequence of data for the prediction [27, 22, 20, 23]. These methods began to consider the changes in various features of pedestrians over a period of time. Through these changes, we can analyze pedestrian motion information such as movement speed, movement direction, speed change, which are related to the possible future location of pedestrians. Because these methods use sequence data as input data and require the processing of temporal problems, RNN models were introduced into this field. RNN models continuously pass current time step information backward so that the model can retain information from previous time steps and has the ability to predict future pedestrian states or possible events based on contextual information, thus improving prediction accuracy.
2.2 Exploration of Novel Inputs
Since then, many representative trajectory-based methods have been developed [12, 3, 2, 5]. These methods determine the likelihood of a pedestrian crossing by analyzing the pedestrian’s past trajectory and predicting the pedestrian’s future direction based on this information, thus completing a more complex task of pedestrian trajectory prediction and enhancing the reliability of the model in determining the intention of pedestrian crossing through explicit future trajectories of pedestrians.
The results of the Trajectory-based method showed the feasibility of using pedestrian motion information. Subsequently, people have tried discovering more information about pedestrians from different angles of pedestrian images. For example, in Rozenberg et al. [26], Manh and Alaghband [17], Wang et al. [35], and Xue et al. [38], the authors attempted to determine pedestrian trajectories and appearance information from an eagle-view perspective. Eagle-view images can prevent pedestrians from being blocked by other objects on roads, and because of the unique angle of view, distance information that was difficult to express in 2D images can be expressed more concretely through eagle-view images. Furthermore, social states based on target pedestrians and surrounding pedestrians or relationships of target pedestrians with other objects [37, 34, 2, 38] have been extended to consolidate further the accuracy of future trajectory or behavior prediction results of pedestrians.
In addition to the works based on using pedestrian motion, there have also been some works that enhance the prediction through the image and visual aspects. First, they not only use the image of the pedestrian itself but also consider the surrounding images of the pedestrian into the prediction model [23, 22, 40, 13]. Furthermore, some methods attempt to add semantic segmentation information [40, 31] so that the model can clearly know the boundaries of various elements on the road, and the model can more accurately analyze the road appearance and traffic conditions where the target pedestrian is located.
In addition, some works have focused on using human pose information due to the posture and behavior of pedestrians are closely related to the problem. In previous works, Rasouli et al. [23] and Piccoli et al. [20] used Openpose tool [6] to generate 2D human poses for pedestrians in PIE dataset, so that the pose data can be obtained in a more realistic way. Later, to provide richer information on pedestrian posture, Quintero Mínguez et al. [21] and Kim et al. [11] introduced 3D human poses as input data. However, these data are captured by 3D cameras or through eagle-view video, which is infeasible for practical applications.
In contrast to human pose, head pose is less used in pedestrian crossing intention prediction. There were some works exploring this type of information. For example, Kooij et al. [12] Schulz and Stiefelhagen [29], Schulz et al. [28] and Sui et al. [31] segment the pedestrian’s head or body orientation into eight discrete and fixed directions. However, they only focus on a single dimension of the horizontal rotation of the pedestrian. Others use 3D cameras to capture head orientation [29] or directly extract features of pedestrian head images using CNN neural networks, but such information may not be accessible for the model to understand and clarify. In Perdana et al. [19], they first introduced 3D head orientation information as input to their prediction model. However, this method mainly relies on head direction to determine pedestrian crossing intention and does not consider multiple different pedestrian features.
In addition to pedestrians themselves, the environment around pedestrians and traffic information are also very critical. In Rasouli et al. [22], it proposed a pedestrian intention prediction dataset and used ego-vehicle speed as input data. They also mentioned that in their dataset, vehicle speed critically influences whether pedestrians will cross the road. Since then, vehicle speed information can be seen in most literature. Yang et al. [39] weighted the presence of traffic lights or crosswalks in the frame and the distance between the target pedestrian and ego-vehicle to calculate a value as input information, which also created a novel type of input data. However, we found that although the PIE and JAAD datasets provide a wealth of information about the traffic environment, much of the previous methods did not consider this, and there is still room to explore how this information can be used.
2.3 The Rise of the Transformer Model
Transformer has been widely used in many different tasks, mainly because of its powerful attention mechanism that allows the model to focus on important information. Moreover, it has a parallel computation architecture, making it suitable for real-time computing. Recently, some pedestrian crossing intention prediction methods have begun to use transformer architecture [33] and achieved great performance [16, 31].
3 Proposed Method
The pedestrian crossing prediction model needs to predict in advance before the pedestrians start to cross the road. This time advance is called TTE, which refers to the interval between the last frame of the model observation time and the start of the pedestrian crossing; TTE is set to 30 to 60 frames in this work, i.e., 1 to 2 seconds, and the observation time is 16 frames, about 0.53 seconds.
3.1 Module Architecture
The illustration of the overall system and processing flow can be found in Figure 2. According to Figure 2, We can first notice that the proposed system consists of two parts - the Feature Pre-processing Module and the Prediction Module. The Feature Pre-processing Module is responsible for converting or extracting the original input data so that various types of data can be used to help the model train in the most effective way. The Prediction Module is responsible for the actual part of performing pedestrian intention prediction. More information on these two modules will be introduced in the following sections.
3.1.1 Feature Pre-processing Module
To predict the pedestrian crossing intention, we rely on several different types of data as a basis for model prediction. Each data has different relationship with the target pedestrian and can be used to determine whether the pedestrian wants to cross the road under different circumstances. In addition, exploring the novel input data is also one of the main contributions of this work.
We include some input data that differs from previous studies, including unique Traffic Awareness Data composed of the traffic light, sign, and crosswalk status; 3D human pose data; Ego-Vehicle Turning data; and Pedestrian 3D head orientation data. Some data that are more commonly found in previous literature are also included, such as Pedestrian bounding box image, Pedestrian surrounding image, bounding box keypoint coordinate and Ego-vehicle speed. The Feature Pre-processing Module plays an important role in generating the various types of data mentioned above.
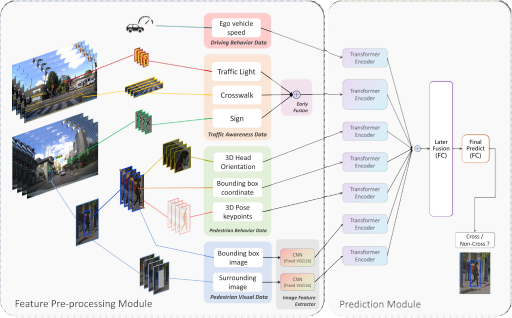
Our transformation or extraction method can be divided into two main categories: one category is when the required data does not exist in the dataset, such as pedestrian head orientation, in which case we need additional extraction models to derive specific new features from images in the dataset; the other category is to extract, reorganize or transform the format of existing data to generate different representative to help models training.
3.1.2 Traffic Awareness Data
The traffic awareness data can help the model understand the surrounding traffic conditions in which the pedestrian is located. It consists of three different types of information: The traffic light state for the lane where the ego-vehicle is located, the presence of specific signs, and the presence of crosswalks in the current frame. These three data types are represented in a unique way to provide road environment traffic information.
Traffic Light State The status of traffic lights is very critical for pedestrians to decide whether to cross the road or not. Many advanced driver assistance systems can easily detect the status of traffic lights at intersections, so it is highly feasible to use this information in real-world scenarios. In our method, we directly use the traffic light status provided by the dataset as training data. The way it is presented in the dataset is a single-digit number, where 1 represents a red light, 2 represents a yellow light, and 3 represents a green light.
Road Sign Road signs mark the right-of-way and the order of passage among road users. Whether it is a pedestrian or a passing vehicle, they will refer to the road signs to take corresponding and appropriate actions. In other words, road signs become a valuable reference when predicting whether pedestrians are going to cross the road.
For example, at an intersection with a stop sign, vehicles generally slow down or stop, and pedestrians will prefer to cross the road. The road sign information is available in both the PIE dataset and JAAD dataset. Road signs data have the following types and labels: 0 is the blue pedestrian sign, 1 is the yellow pedestrian sign, 2 is the white pedestrian sign, 3 is pedestrian text, 4 is stop sign, 5 is bus stop, 6 is train stop, 7 is construction sign, 8 is others. In JAAD dataset, there are two types of road sign information: pedestrian sign and stop sign, which are represented by 1 or 0, respectively, to indicate their existence.
Crosswalk The presence of a crosswalk at an intersection is an essential basis for pedestrians to decide whether to cross or not. JAAD dataset provides information on the presence of crosswalks for each frame. Where label 1 represents when the crosswalk is present in the current frame and 0 when it is not. In PIE dataset, crosswalk information is provided with more detail such as its bounding box.
Traffic Awareness Data fusion After experimenting with the above three kinds of data, we found that early fusion of these data into a new data format similar to a one-hot array was more effective for training than directly inputting the data into the model. The model can digest the information more effectively and learn the correlation between them, reflected in better training results. The following steps transform the unique format fusion data mentioned above:
First, for the Traffic light state, using a 3-dimensional array to express the state of red, yellow, and green lights instead of using the dataset format of 1, 2, and 3 to express them resulted in better model performance. For example, an array of [0, 0, 1] represents the current state as the green light. The first to third dimensions represent the states of red, yellow, and green light, respectively. The values of each dimension have two states - 1 or 0, representing whether the corresponding light is on or off.
In real scenarios, there are many different types of road signs. Using detailed road sign types as training data provides more information to the model. However, it could provide more redundant and irrelevant information to the model. This is reflected in the poor performance of the training results. Instead, we select the signs directly related to the pedestrian crossing and use the existing state of these signs in the current frame as input data. For example, When a stop sign appears, vehicles on the road will tend to slow down or stop. Or, if a pedestrian sign is present, vehicles will tend to yield to pedestrians. Therefore, we represent the information of specific road signs as a 1-dimensional array. When the road sign value is 1, it represents a stop sign or pedestrian sign in the current frame. When the value is 0, it means the opposite.
The situation of crosswalk data is similar to sign data in that pedestrians are generally more willing to cross the road in places with crosswalks, so it is also one of the factors to consider as needed. When the crosswalk attribute is 1 represents the crosswalk sign is present in the current frame and 0 when it is not.
After some transformation of the above data, we can merge them by concatenating to create a 5-dimensional array, which contains the status of the traffic information of pedestrians surrounding environment such as traffic lights, street signs, and crosswalks. Therefore, we call it “Traffic Awareness Data”.
3.1.3 Pedestrian Behavior Data
3D Head Orientation From the discussion in the previous chapter, we can find that, in addition to the human pose, the pedestrian’s head pose and direction are also features worth observing. By detecting the pedestrian’s head orientation, we know whether the target pedestrian is looking at the driver or seeing the vehicle. We can compute the pedestrian’s head movement information during the observation time through a sequence of consecutive head turns, such as whether the pedestrian is nodding or swinging his/her head to check for incoming vehicles.
In this work, we choose the head orientation estimation method proposed in Hempel et al. [10] to generate the 3D head orientation. We need to first find the head position of the pedestrian in the bounding box through the object detection method “RetinaNet” [14] before we can generate the 3D orientation data through the head orientation estimation method 6DRepNet [10].
3D Pedestrian Human Pose The 2D human pose data is provided in the dataset by applying the tool Openpose to extract 18 key points 2D skeleton coordinates of each pedestrian and represent each keypoint with the corresponding 2D image coordinate. Since 3D skeleton information may provide richer information for the model, we use the method proposed by Chen et al. [8] to lift 2D skeletons data to 3D skeletons data. The 3D human pose information provides richer human posture information for the prediction model. Pedestrian Bounding Box Human bounding box coordinates are a piece of important information for observing the movement of pedestrians. The bounding box coordinates allow us to know the location of pedestrians, and the difference between the coordinates allows us to observe the amount and direction of pedestrians” movement. This information could help us determine whether pedestrians are likely to cross in front of the ego-vehicle based on their movement direction and speed.
3.1.4 Driving Behavior Data
Ego-Vehicle Speed When we are pedestrians and see a vehicle approaching from afar, we often judge whether it is appropriate to cross the road based on the vehicle speed. Because if the vehicle wants to give way to pedestrians, it will generally slow down early. If the vehicle speed is still high when approaching pedestrians, it means that the driver did not intend to stop or did not notice the pedestrians. It is clear that pedestrians’ crossing intentions also depend on the vehicle speed. To obtain vehicle speed, it is generally necessary to connect to the OBD interface on the vehicle for real-time monitoring or use GPS devices to record speed. Both of these data are available in the datasets, and we use GPS speed in our experiments.
3.1.5 Pedestrian Appearance Data
Pedestrian Bounding Box Image Much of the input information mentioned above, such as the road information around the pedestrians, the speed of the vehicle, or the pedestrian posture information, can be obtained from the “images” seen by human road users. Therefore, images provide the most critical and core information. In addition, pedestrians” appearance information can provide many details and even complement other input data, such as pedestrians” behavior, distance, and orientation. However, due to the current neural network’s understanding ability of image input, it is not easy to rely only on simple images as input data to make the model understand all situations. This also reflects why our method needs to introduce so many different forms of input data.
Pedestrian Surround Image Besides the pedestrian appearance information, the surrounding environment around pedestrians is also vital information, which can provide a lot of additional information, such as the location where pedestrians stand, the interaction between pedestrians and surrounding objects, or whether there are specific objects around them. Especially the location where pedestrians are standing is very intuitive auxiliary information. Pedestrians standing on the sidewalk far away from the road are naturally different from those walking on the edge of the road in terms of the possibility of crossing the road. The way to generate this information follows the setting of the benchmark dataset. It is cropped and obtained by expanding 1.5 times according to the size of the pedestrian bounding box and filling the original pedestrian bounding box area with gray pixels to present a rectangle with a hollow center. This makes the model pay more attention to visual information in the surrounding environment and avoid being disturbed by pedestrians’ appearance.
Image Feature Extractor The above two types of visual information are mainly composed of images. If the information of these images is not extracted preliminarily, the model training will be quite difficult because the model’s understanding of image information is quite shallow. Therefore, an Image Feature Extractor is needed. VGG16 is a vast convolution neural network mainly designed to deal with image information because the amount and complexity of image information are generally quite large, which is also why VGG series models are so deep.
Pedestrian bounding box image and surround image will be fed to the feature extractor, respectively, to generate 512-dimensional image features, and these two 512-dimensional image features will be used as the training data for subsequent models.
3.1.6 Prediction Module
Here, we introduce the model flow for the proposed pedestrian crossing intention prediction method. The specific process diagram can refer to the Prediction Module part on the right side of Figure 2.
After the Data Pre-processing Module in the previous section generates all the data we need, the Prediction Module will take over the work of pedestrian crossing intention prediction. The input data will first enter different branches to encode temporal information and extract features in each sequence through the Attention mechanism in Transformer Encoder. So that it can observe the target pedestrian’s possible crossing intention through changes in input data within different time steps, just like the primary decision strategy that human drivers adopt when judging whether pedestrians will cross the road. Then, the information processed by Transformer blocks will enter the Later Fusion stage. The Later Fusion stage is responsible for merging data from different types, comprehensively referencing changes in different data under different conditions, and further condensing and extracting these features for the final prediction layer to make the final prediction. The Fusion stage mainly has two steps: integrate different features together through Concatenate, then reduce dimensionality and extract them through a Fully Connected Layer. In the Final Prediction stage, the fusion feature will be integrated again through a Fully Connected Layer and passed through an Activation Function to give the final prediction result.
3.1.7 Transformer Encoder
Next, we will introduce the Transformer Encoder block that is mainly used in the proposed model. Transformer is a deep learning architecture [33]. Its initial task was to solve the bottleneck encountered in the NLP (Nature Language Processing) field when processing sequence information. One of its major features is that it can analyze and model the information from different time steps in a sequence at the same time through a novel architecture and the power of self-attention. Transformer does not need to pass hidden state data progressively like traditional RNNs to resolve information from different time steps. Instead, it can simultaneously perform similarity analysis and modeling of data from different time steps in the sequence, allowing the model to analyze which time step of data in the entire sequence are related and assign higher weights to the more critical features, i.e., focusing on the most important part of information. Moreover, Transformer has a computational advantage that can be parallelized for processing. Such characteristics and advantages are particularly suitable for use in the pedestrian crossing intention prediction task.
The original Transformer architecture includes both the Encoder and Decoder parts. Because of the language-translation task in the original paper, besides converting the input language into features with semantic information through Encoder, it must also convert or says “restore” the semantic information extracted by Encoder into another completely different language system. This restoration requires the parsing ability of the Decoder to reconstruct features into human-readable language. However, we do not need to reconstruct features into specific complex information in pedestrian crossing intention prediction. Therefore, our method uses only the Encoder part to model input information and assist classification.
Next, we will introduce the functions and principles of each module in Transformer Encoder. Referring to Figure 3, we can explain Transformer Encoder’s main parts by dividing it into three parts: Input Embedding and Positional Encoding, Multi-Head Self Attention, and the Feed Forward Network.
Input Embedding and Positional Encoding In the original Transformer [33] developed for NLP, the embedding layer is used to convert the original words into numerical features that the model can process. This embedding layer is generally a neural network that has been trained with a large amount of word data, which can map human language into another dimension space. In our method, the role of the embedding layer is to map and extract information from various data related to pedestrians. Therefore, the embedding layer is replaced by a learnable fully connected layer.
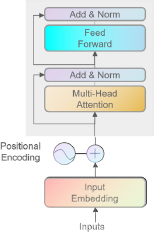
The subsequent positional encoding is a crucial step in Transformer [33] because it helps Transformer identify the order relationship between a series of sequence inputs. Positional encoding adds a unique position code to each time step of data so that each time step has its meaning of different position relationships. Positional encoding combines a particular value generated by unique sine or cosine functions with the original data through an addition operation, as shown in Equation 1.
Multi-Head Self Attention The Self-Attention mechanism proposed in Vaswani et al. [33] is an essential component of the Transformer. This mechanism will calculate the attention weight by performing a weighted linear combination of the input data with positional encoding to obtain the attention-weighted output. Here we will briefly describe how it is calculated.
First, we need to obtain three matrices representing different meanings, i.e. query Q, value V, and key K, through three linear transformations of the input data that has already been fused with Positional encoding, as shown in Equation 2.
Next, we compare Q with the target K to determine which part of Q and K has a higher correlation, so that the model will pay more attention to this part in the training. As for how to determine and calculate correlations, see the calculation formula of Self Attention Weight in Equation 3.
As we can see, Q and K are subjected to dot product operation, which mathematically calculates the similarity. The more similar parts in the matrix will have larger numerical values. Since Q, K, and V were all linearly transformed from the same input data, comparing Q and K for similarity can also be regarded as comparing the same input sequence at different time steps. At this point, we can see the importance of input data at different time periods in the entire sequence.
Next, the matrix QKT is standardized by and normalized by the SoftMax function. Finally, V is then multiplied by the attention weight matrix to obtain the weighted output.
Feed-Forward Network After obtaining the attention-weighted output, the Feed Forward Network [33] will process the feature again to ensure that information can be correctly extracted and utilized. It consists of two Fully connected layers and the output is obtained after being processed by the activation function ReLU.
Residual Connection and Layer Normalization Note that after the output of Multi-Head Self Attention [33] and Feed Forward Network [33], the residual connection and layer normalization will be applied. Residual connection adds the output feature from the previous layer here to ensure that the original information will not be lost during propagation in deep learning networks, causing problems like gradient vanishing. Layer normalization normalizes the output feature, making the distribution of each feature dimension more stable and speeding up model convergence.
3.1.8 Multi-modal Fusion and Final Prediction
After the transformer encoder block has processed the data from each branch, we need to fuse different sources of features. Here, a simple and effective fusion method is used to concatenate the features from different sources directly, and then a fully connected layer is applied for fusion and dimensionality reduction to extract the important information further. Finally, the output after fusion will be subjected to another fully connected layer for final prediction, thereby obtaining the prediction result for the pedestrian crossing intention.
3.1.9 Loss Function
In this paper, we chose to use Focal loss as our loss function instead of Cross Entropy which is commonly used in this field. This loss function was proposed in RetinaNet [14], which is used for generating 3D Head Orientation. This paper proposes a seemingly simple yet quite effective way to deal with the fact that models tend to bias towards easy samples in training data and ignore hard samples. This will cause the model to make mistakes when more complex or uncommon data appear.
Focal loss [14] reduces the weight of easy samples and forces the model to pay more attention to hard samples. To be more specific, the focal loss is given in the following equation.
where
4 Experimental Results
In this section, we will discuss the evaluation of our proposed method through experiments on the public JAAD and PIE datasets.
4.1 Datasets
Following the pedestrian crossing intention prediction benchmark, both the Joint Attention Autonomous Driving (JAAD) Dataset and Pedestrian Intention Estimation (PIE) datasets are included in the evaluation of the model.
JAAD [24] is a pedestrian crossing and behavior annotation dataset, and it contains 391K pedestrian samples with bounding box annotations and over 300 video clips from 5 to 15 seconds in length, collected from urban scenes in North America and Europe. Besides the labeling of crossing and pedestrian bounding boxes, they annotated some of the pedestrian samples with crossing intentions and also included data on the behavior of their ego-vehicle drivers. Moreover, the contextual information of the road in each frame is included, which provides additional data on the current environmental information and the pedestrians.
PIE dataset [22] includes 56 video clips from 4 to 10 minutes, totaling over 6 hours. There are 740K pedestrian samples with bounding box annotations, almost twice the amount of the JAAD dataset. PIE dataset focuses on pedestrian action prediction, so accurate vehicle information directly collected from the vehicle OBD (On-Board Diagnostics) system, spatial annotations for traffic environment, and pedestrian intention are added to support this task.
4.2 Implementation Details
The adjustment of hyperparameters can significantly affect the training results. In our implementation, there are two types of parameter settings to be aware of - Data sampling parameters for the data interface and the hyperparameters for training the transformer model.
According to previous literature [13, 30, 23, 15, 18] and our experiments, several important testing parameters need to be considered for pedestrian crossing intention prediction. We assume that the duration of a pedestrian appearing in a complete video clip is about 10 seconds. We cannot use the entire 10-second sequence as input data to evaluate and compare with other methods because the pedestrian crossing prediction model is sensitive to parameters like “observation time” and “Time-To-Event (TTE)”. These two constraints must be strictly defined and set. The concept of TTE and observation time can refer to Figure 4.
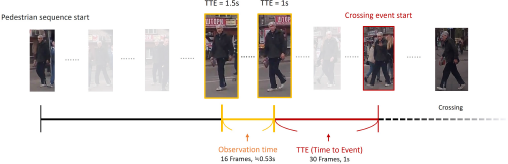
The yellow part indicates the range where the model can observe and make predictions. This range must be prior to the time “TTE” before the pedestrian starts to cross the road.
The yellow part indicates the range where the model can observe and make predictions. This range must be prior to the time “TTE” before the pedestrian starts to cross the road.
The impact of these two parameters on model training has been investigated in many previous papers [13, 30, 23]. Based on previous literature, the longer the observation time, the better the training results are generally reflected, as the model has more information to make the prediction. Shorter TTEs also generally result in better accuracy, as pedestrian behavior and other information are closer to actual crossing conditions. However, many methods still take different settings, making it difficult to make a fair comparison. We use the same setting as the benchmark [13] in our experiments. The observation time is set to 16 frames of the original 30-frame-per-second video clip, which is approximately 0.53 seconds. The TTE is set to a range of 30 to 60 frames, i.e., between 1 and 2 seconds before the event.
4.2.1 Training Details and Hyperparameters
The Prediction Module in our method is based on the transformer encoder model [33], whose architecture can be adjusted with several hyperparameters depending on the training dataset and application scenario. We are primarily concerned with the following four hyperparameters in the Transformer Encoder. The one controls the dimension of input embedding and output of multi-head self-attention, the dimension in the feed-forward network, the number of layers of the transformer encoder, and the number of heads of the multi-head self-attention.
The hyperparameter settings we apply to each data branch are listed below in the order mentioned above. Bounding box and surrounding image: 128, 128, 1, 4. 3D pose: 128, 64, 2, 4. 3D head orientation: 128, 64, 1, 4. Bounding box: 128, 128, 1, 4. Ego-vehicle speed: 128, 128, 1, 4. Traffic perception data: 128, 128, 1, 4.
The hyperparameters that are relevant to the training process are listed below. The batch size is set to 128, and the numbers of Epochs for PIE, JAAD All, JAAD Beh datasets: 70, 60, 60. The learning rate is set to 0.001 in our experiments. The output dimensions of the two FC layers for fusion and final prediction are 128 and 1, respectively. Furthermore, we use Adam optimizer and apply the same class weights as in the benchmark method [13] to mitigate the problem of imbalance between crossing and non-crossing samples.
4.3 Experimental Comparisons
The comparisons of the evaluation results of our proposed method with other state-of-the-art baselines on the benchmark datasets [13] are shown in Table 1. This benchmark covers two different datasets, PIE and JAAD. JAAD is divided into two subsets, the complete JAAD dataset (JAAD all) and JAAD behavioral data (JAAD beh), so there are three branches of evaluation data.
The JAAD beh branch includes a large number of pedestrians who show signs of imminent crossing or are making crossing movements. As a result, the crossing pedestrian samples are much more compared to the non-crossing samples. JAAD all dataset adds more than 2000 pedestrian samples that did not cross and were far from the road compared to JAAD beh. The behaviour of these pedestrians is more consistent and there is a clearer lack of intention to cross. These additional samples increase the number of non-crossing pedestrians by a factor of 15, making the number of non-crossing samples in this subset much larger than the number of crossing samples.
Pedestrian crossing intention prediction accuracy for different methods on three public datasets.
| Method | PIE | JAAD all | JAAD beh | ||||||||||||
|---|---|---|---|---|---|---|---|---|---|---|---|---|---|---|---|
| ACC | AUC | F1 | Predskιn | Recall | ACC | AUC | F1 | Precision | Recall | ACC | AUC | F1 | Precision | Recall | |
| SFGRU ([23]) | 0.82 | 0.79 | 0.69 | 0.67 | 0.7 | 0.84 | 0.84 | 0.65 | 0.54 | 0.84 | 0.51 | 0.45 | 0.63 | 0.61 | 0.64 |
| I3D ([7]) | 0.81 | 0.83 | 0.72 | 0.60 | 0.9 | 0.84 | 0.8 | 0.63 | 0.55 | 0.73 | 0.62 | 0.51 | 0.75 | 0.65 | 0.88 |
| TrouSPI-Net ([9]) | 0.88 | 0.87 | 0.80 | 0.77 | 0.84 | 0.82 | 0.77 | 0.58 | 0.49 | 0.70 | 0.64 | 0.55 | 0.76 | 0.65 | 0.91 |
| MultiRNN ([4]) | 0.83 | 0.8 | 0.71 | 0.69 | 0.73 | 0.79 | 0.79 | 0.58 | 0.45 | 0.79 | 0.61 | 0.5 | 0.74 | 0.64 | 0.86 |
| D. Yang. et al. ([40]) | - | - | - | - | - | 0.83 | 0.82 | 0.63 | 0.51 | 0.81 | 0.62 | 0.54 | 0.74 | 0.65 | 0.85 |
| PCPA ([13]) | 0.87 | 0.86 | 0.77 | - | - | 0.85 | 0.86 | 0.68 | - | - | 0.58 | 0.5 | 0.71 | - | - |
| IntFormer ([16]) | 0.89 | 0.92 | 0.81 | - | - | 0.86 | 0.78 | 0.62 | - | - | 0.59 | 0.54 | 0.69 | - | - |
| Yu Yao. et al. ([41]) | 0.84 | 0.90 | 0.88 | 0.96 | - | 0.87 | 0.70 | 0.92 | 0.66 | - | - | - | - | - | - |
| BiPed ([25]) | 0.91 | 0.90 | 0.85 | 0.82 | - | 0.83 | 0.79 | 0.60 | 0.52 | - | - | - | - | - | - |
| Ours | 0.91 | 0.89 | 0.84 | 0.84 | 0.85 | 0.89 | 0.78 | 0.66 | 0.72 | 0.61 | 0.68 | 0.63 | 0.76 | 0.71 | 0.81 |
Each of the above three datasets has different data distributions and characteristic biases, as well as problems with data imbalances, and these factors will have many implications for the evaluation results. The above introduction can help the reader to understand the characteristics of each data branch and to have a further understanding of the performance of each indicator.
As shown in Table 1, our proposed method achieves the best results in accuracy in the experimental results on all three datasets. For the remaining evaluation metrics, although not all of them appear to be best achieved by our method, it is clear that our method achieves the best ACC performance for all three datasets, and it provides better overall accuracy and generalization capability across the three datasets.
We can see from the table that the best results for different metrics in the three different datasets are generally achieved by different methods. Some methods appear to have achieved a significant lead in specific metrics but usually have lower performance in some other metrics. For example, in the PIE comparison, I3D achieves a recall of 0.9 but a precision of 0.6, compared to 0.85 and 0.84 from our method, which has a better balance, and this is reflected in the AUC and F1. Our method achieved the top three scores for all the PIE metrics in these methods. For JAAD beh, our method outperforms all the methods that provide JAAD beh scores. Only the recall did not reach the highest score, obtained by TrouSPI-Net, but the precision of TrouSPI-Net was only 0.65, compared to 0.71 for our method.
In JAAD All, our method leads in accuracy and precision but does not perform as well on other metrics as it does on other datasets. It might be the significant gaps between crossing and non-crossing samples. This behavior can be observed in the decreasing Recall scores of our method. Improving the scores on JAAD All and suppressing the impact of unbalanced positive and negative samples will be an area that our method needs to consider carefully in the future. Despite this, our approach strikes a balance between the three datasets, maintaining a certain standard for JAADall while achieving the State-of-the-art standard of PIE and JAAD Beh. If we adjust our model architecture and the combination of input data according to the bias of different datasets, our method will achieve better results.
4.4 Ablation Study
In this section, we perform several experiments to verify the effects provided by the various components and different features in our method and their influence on the training results.
4.4.1 Combination of Different Features
This experiment shows how the different combinations of input data affect the training results of our method. Due to space limitations, we cannot list all possible combinations. In Table 2, we show the performance of the proposed method by using different combinations of features in the experiments on the three datasets. Previous studies [1, 16, 13] have pointed out that the PIE and JAAD datasets are more sensitive to specific input data. This means that we can achieve good baseline results with only certain specific input data with these two datasets. Furthermore, as suggested in Lorenzo et al. [16], adding the ego-vehicle speed will significantly improve the prediction results. As shown in Table 2, the overall performance of the model improved significantly after adding bounding boxes and ego-vehicle speed. It even surpassed our best score in Section 4.3 and was ahead of other methods after fusing our proposed Traffic Awareness data. However, as mentioned in previous sections, we chose to incorporate more information to support the stability of the model in a variable scenario in order to maintain the generalization and balance of all datasets. This ensures that the scores on the PIE datatset are comparable to SOTA and also takes into account the performance of the model in other datasets.
4.4.2 Comparison of Different Fusion Methods
We performed some experiments on the architecture and fusion method of the model to verify the effectiveness of our current approach. In addition to the Later Fusion method used in our method, we compare three different solutions. The results are shown in Table 3.
The first is a hierarchical fusion method inspired by Rasouli et al. [23], which helps the model to integrate and analyze the input information more deeply by progressively fusing different inputs, so that data inputted later can be encoded together with the features of data inputted earlier. In the second method, Early fusion is used to fuse data before it enters the Transformer encoder block, and the number of Transformer encoder blocks is reduced to decrease the complexity of the model. Finally, based on the proposed method, we replace the Fully connected layer of later fusion with channel attention in CBAM [36], hoping that the channel attention mechanism can enable the model to adapt to different environments and automatically adjust the weights of different input information to optimize the training results.
We conduct experiments on different combinations of input data to verify the contribution of each input feature. Note that “B” is Bounding box coordinates, “TA” is Traffic Awareness data, “LB” is Local Bounding box image, “LS” is Local Surrounding image, “S” is ego-vehicle Speed, “H” is 3D Head orientation, and “P” is 3D human Pose.
| Features | PIE | JAAD all | JAAD beh | ||||||||||||
|---|---|---|---|---|---|---|---|---|---|---|---|---|---|---|---|
| ACC | AUC | F1 | Precision | Recall | ACC | AUC | F1 | Precision | Recall | ACC | AUC | F1 | Precision | Recall | |
| B | 0.87 | 0.85 | 0.78 | 0.76 | 0.81 | 0.83 | 0.74 | 0.55 | 0.51 | 0.60 | 0.64 | 0.62 | 0.71 | 0.71 | 0.71 |
| TA | 0.85 | 0.77 | 0.69 | 0.82 | 0.59 | 0.79 | 0.50 | 0.09 | 0.19 | 0.06 | 0.61 | 0.50 | 0.75 | 0.62 | 0.93 |
| LB, LS | 0.71 | 0.61 | 0.43 | 0.49 | 0.38 | 0.86 | 0.75 | 0.60 | 0.62 | 0.58 | 0.63 | 0.53 | 0.75 | 0.64 | 0.90 |
| LB, LS, B | 0.88 | 0.86 | 0.79 | 0.76 | 0.83 | 0.88 | 0.73 | 0.60 | 0.70 | 0.52 | 0.63 | 0.62 | 0.68 | 0.71 | 0.65 |
| B, S | 0.90 | 0.89 | 0.82 | 0.79 | 0.85 | 0.84 | 0.77 | 0.59 | 0.55 | 0.65 | 0.61 | 0.57 | 0.70 | 0.68 | 0.72 |
| B, S, TA | 0.92 | 0.89 | 0.85 | 0.86 | 0.84 | 0.83 | 0.78 | 0.59 | 0.51 | 0.70 | 0.62 | 0.57 | 0.71 | 0.68 | 0.75 |
| B, S, TA, H | 0.91 | 0.89 | 0.84 | 0.84 | 0.85 | 0.83 | 0.78 | 0.59 | 0.51 | 0.71 | 0.63 | 0.62 | 0.68 | 0.71 | 0.65 |
| LB, LS, B, S, TA, H, P | 0.91 | 0.89 | 0.84 | 0.84 | 0.85 | 0.89 | 0.78 | 0.66 | 0.72 | 0.61 | 0.68 | 0.63 | 0.76 | 0.71 | 0.81 |
Comparison of different fusion methods
| Fusion Method | PIE | JAAD all | JAAD beh | ||||||||||||
|---|---|---|---|---|---|---|---|---|---|---|---|---|---|---|---|
| ACC | AUC | F1 | Precision | Recall | ACC | AUC | F1 | Precision | Recall | ACC | AUC | F1 | Precision | Recall | |
| Hierarchical | 0.91 | 0.89 | 0.84 | 0.84 | 0.83 | 0.88 | 0.75 | 0.62 | 0.72 | 0.54 | 0.67 | 0.58 | 0.77 | 0.67 | 0.91 |
| Eearly Fusion | 0.86 | 0.81 | 0.73 | 0.79 | 0.68 | 0.87 | 0.78 | 0.63 | 0.62 | 0.64 | 0.64 | 0.54 | 0.76 | 0.64 | 0.93 |
| Later Fusion + CH Att | 0.90 | 0.88 | 0.83 | 0.84 | 0.82 | 0.88 | 0.79 | 0.66 | 0.68 | 0.63 | 0.64 | 0.56 | 0.75 | 0.66 | 0.87 |
| Later Fusion + FC | 0.91 | 0.89 | 0.84 | 0.84 | 0.85 | 0.89 | 0.78 | 0.66 | 0.72 | 0.61 | 0.68 | 0.63 | 0.76 | 0.71 | 0.81 |
Among these four fusion schemes, the scheme of combining Later fusion with the fully connected layer gives the most satisfactory results. In the hierarchical and channel attention scheme, it is theoretically possible to increase the depth of the model to provide more information and understanding of complex scenarios.
However, since these data sets are relatively sparse and the Transformer tends to perform weakly when there is not enough data, these two more complex models tend to overfit as they rapidly converge to the training set during training. Early fusion, on the other hand, renders poor results due to the fact that the input data is fused before the features are extracted by the encoders. This approach is not able to learn complex scenes well due to the lack of model complexity, which can be observed in the reduced accuracy on PIE dataset with more diverse sample types.
4.4.3 Comparison of Traffic Awareness Feature Fusions
We represent the status of traffic lights, road signs and crosswalks in a special format and integrate them using concatenant operations, so that this information brings about a visible improvement to the model training. In this section, we show how different fusion strategies for the information on traffic lights, road signs, and crosswalks affect the training results. As shown in Table 4, we test five different fusion strategies. At the beginning of the study, when we were exploring the feasibility of the traffic light, road sign and crosswalk data, we train each of the three types of information as three separate branches as input to the encoder, but this strategy contributes almost negligibly to the training results, i.e. the “No fusion” row in Table 4. We then attempt to fuse these data, which are more relative to pedestrian crossing intentions, in the hope that the model could use this information to learn more comprehensively and discriminate between different complex scenarios while reducing the number of transformer encoders and the possibility of overfitting.
Comparison of different traffic-aware feature fusion strategies. “T” is Traffic light, “S” is Sign, “C” is Crosswalk. Where “T+SC” means Traffic is a single branch without fusion, while Sign and Crosswalk are fused. “TS+C” means Traffic and Sign are fused, Crosswalk is a single branch. “TC+S” means Traffic and Crosswalk are fused, Sign is a single branch. “No fusion” means each data is a different kind of three branches without fusion. “TCS Early Fusion” is the proposed method with three data fusions.
| TA Fusion Strategy | PIE | JAAD all | JAAD beh | ||||||||||||
|---|---|---|---|---|---|---|---|---|---|---|---|---|---|---|---|
| ACC | AUC | F1 | Precision | Recall | ACC | AUC | F1 | Precision | Recall | ACC | AUC | F1 | Precision | Recall | |
| No Fusion | 0.90 | 0.87 | 0.83 | 0.85 | 0.80 | 0.88 | 0.77 | 0.64 | 0.70 | 0.59 | 0.66 | 0.56 | 0.77 | 0.66 | 0.94 |
| T + SC | 0.90 | 0.87 | 0.82 | 0.84 | 0.80 | 0.88 | 0.73 | 0.60 | 0.72 | 0.51 | 0.69 | 0.67 | 0.76 | 0.75 | 0.76 |
| TS + C | 0.90 | 0.87 | 0.82 | 0.85 | 0.78 | 0.89 | 0.72 | 0.59 | 0.79 | 0.47 | 0.70 | 0.66 | 0.78 | 0.73 | 0.83 |
| TC + S | 0.90 | 0.86 | 0.82 | 0.87 | 0.77 | 0.88 | 0.77 | 0.64 | 0.69 | 0.60 | 0.70 | 0.67 | 0.76 | 0.75 | 0.78 |
| TCS Early Fusion | 0.91 | 0.89 | 0.84 | 0.84 | 0.85 | 0.89 | 0.78 | 0.66 | 0.72 | 0.61 | 0.68 | 0.63 | 0.76 | 0.71 | 0.81 |
The fusion strategy also affects the final training result, so we compare the performance of two different strategies. The first is to fuse the three types of data and then input them to a single encoder, while the other is to separate the data into two encoders, with the first encoder inputting the concatenated data of the two types of information and the other inputting the remaining data. These two blending strategies resulted in four different combinations of the three input data, namely T+SC, TS+C, TC+S and TSC Early Fusion in Table 4. Our final solution, TSC Early Fusion, demonstrates the best results, maintaining a decent level of performance in all three datasets, but was not clearly biased towards certain datasets. For example, the TS+C and TC+S fusion strategies show excellent results in JAAD beh, but they did not provide improvement in PIE.
4.5 Qualitative Justification
Figure 5 depicts visualization of some results of the proposed method for the pedestrian crossing intention prediction task. The model can correctly predict the complex samples, such as pedestrians walking along the curb, pedestrians standing at the curb, pedestrians whose frames are blocked, and pedestrians who tend to move towards the road but do not cross the road in the end.
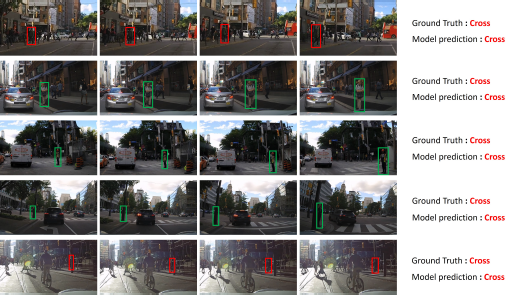
Some examples correctly predicted by our model. Red bounding boxes indicate pedestrian samples that cross the road, while green ones indicate samples that do not cross. The first and second rows show samples of pedestrians walking along the edge of the road. The third row shows the case of pedestrians standing on the roadside in place. The fourth and fifth rows show cases of occlusion and unclear images.
Some examples correctly predicted by our model. Red bounding boxes indicate pedestrian samples that cross the road, while green ones indicate samples that do not cross. The first and second rows show samples of pedestrians walking along the edge of the road. The third row shows the case of pedestrians standing on the roadside in place. The fourth and fifth rows show cases of occlusion and unclear images.
Furthermore, adding traffic awareness data, 3D pedestrian head orientation, and 3D human pose helps the model prediction in many cases. The cases shown in Figure 6 were previously incorrectly predicted by the model, but the introduction of these features fixes this problem. For example, the apparent traffic light status in the frame helps the model to determine more clearly whether a pedestrian will cross or not. Pedestrians also tend to cross the road more boldly due to the presence of crosswalks and pedestrian crossing signs or stop signs. With the help of these data, our method can better understand the current scene and make correct predictions.
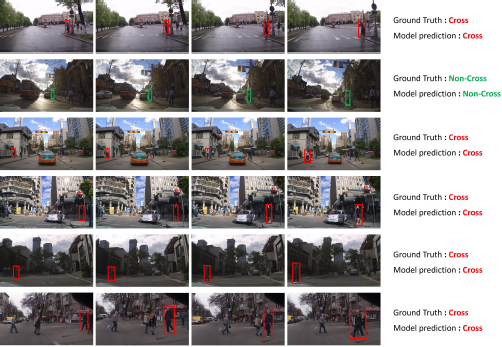
The additional features introduced in our method will help the model to predict more accurately in specific situations and improve the prediction of these cases that were misclassified by the model without using these features.
The additional features introduced in our method will help the model to predict more accurately in specific situations and improve the prediction of these cases that were misclassified by the model without using these features.
4.5.1 Discussion of Failure Case and Future Directions
In this section, we discuss the failure cases of this method and the problems we found in the dataset during our research. At the same time, we will also make recommendations on the future direction.
Among the failed cases, we found a condition that confuses the model and repeatedly occurs in incorrect cases. As shown in Figure 7, some cases occurs when the vehicle is about to turn and the direction of the vehicle initially driven is changed.
Another example is that when a vehicle turns exactly during the model observation time, the pedestrian’s bounding box trajectory moves rapidly horizontally, which is similar to the behavior of a fast-moving pedestrian trying to cross the road, and can easily lead to misjudgment by the model. We believe that knowing the future direction of the vehicle will help the model to distinguish these conditions more clearly. Although the direction of a vehicle cannot be predicted explicitly in advance, it can still be known from the vehicle’s directional lights, steering wheel rudder angle, navigational route, and even the predefined driving route of a self-driving car. Although this information can be obtained directly from the vehicle in a real-world scenario, it is difficult to extrapolate from the available information in the datasets used in our experiments.
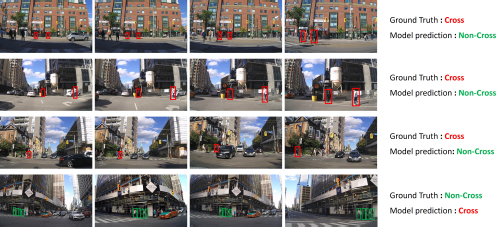
The cases in the first to third rows of the figure illustrate the impact of ego-vehicle turning on the prediction of the pedestrian crossing. The fourth column shows that when the model observes a pedestrian during the ego-vehicle turn, the pedestrian’s bounding box trajectory is similar to the samples moving rapidly to the right, making it easy to confuse the model with a fast-moving pedestrian trying to cross. Note that red bounding boxes indicate pedestrian samples that cross, while green ones indicate those that do not.
The cases in the first to third rows of the figure illustrate the impact of ego-vehicle turning on the prediction of the pedestrian crossing. The fourth column shows that when the model observes a pedestrian during the ego-vehicle turn, the pedestrian’s bounding box trajectory is similar to the samples moving rapidly to the right, making it easy to confuse the model with a fast-moving pedestrian trying to cross. Note that red bounding boxes indicate pedestrian samples that cross, while green ones indicate those that do not.
Some other failure cases include those when pedestrians are in dark or unclear areas of the image, when vehicles and pedestrians are stationary, when pedestrians are heavily obscured or highly crowded, and in the more specific cases where the traffic light status changes after the end of the observation time, causing the pedestrian behavior to change after the observation.
5 Conclusions
In this paper, we proposed a transformer-based system of predicting the pedestrians’ intention of crossing the road from multi-modal information. In this system, we explore how people determine the crossing intention of pedestrians from the perspective of human drivers and pedestrians themselves, and integrate the pieces of critical information into the input data as much as possible to help the model make accurate predictions. Ultimately, we select nine different types of information as input data.
To the best of our knowledge, we are the first to represent traffic light, road sign, crosswalk in a novel way and incorporate them into the training, which helps our model to achieve better training results and proves its importance and effectiveness through an ablation study. Furthermore, for the pedestrian posture information, we are the first to use the lifted 3D human pose and 3D head orientation information to help the model better understand the posture and behavior of pedestrians through richer information. Our experimental results show that the proposed model achieves state-of-the-art performance on the three subsets of benchmark datasets.
Finally, we perform several experiments to verify the effectiveness of various components and different input data of our method. At the same time, we have made recommendations for tackling the problems we have identified for future development.
The work was supported in part by funding from the National Science and Technology Council, Taiwan, under grants 111-2221-E-007-106-MY3 and 112-2634-F-007-002.
About the Authors
Ting-Wei Wang received his B.S. degree from National Yunlin University of Science and Technology and an M.S. degree in Information Systems and Applications from National Tsing Hua University, Taiwan, in 2021 and 2023, respectively. His research interests include computer vision and deep learning.
Shang-Hong Lai received the Ph.D. degree in electrical and computer engineering from the University of Florida, Gainesville, in 1995. After working at Siemens Corporate Research, Princeton, New Jersey, as a research scientist during 1995-1999, he joined the department of computer science, National Tsing Hua University (NTHU), Taiwan, where he is currently a Professor. Since 2018, he has been on leave from NTHU to join Microsoft AI R&D Center, Taipei, as a Principal Research Manager. He has authored more than 300 articles published in the related international journals and conferences. In addition, he has been awarded around 30 patents for his researches on computer vision and medical imaging. His research interests include computer vision, image processing, and machine learning. He was involved in the organization of several international conferences in computer vision and related areas, including ICCV, CVPR, ECCV, AAAI, ICML, WACV, ACCV, ICPR, ICIP, etc. Furthermore, he has also served as an associate editor for Pattern Recognition and Journal of Signal Processing Systems.

