


This paper maps research (2016 to 2025) on digital platform business models among platform-adopting small and medium-sized enterprises (SMEs) in emerging markets and explains why the field documents value creation far more thoroughly than value capture.
Following the preferred reporting items for systematic reviews and meta-analyses (PRISMA) 2020, 80 Scopus-indexed articles form the bibliometric sample, mapped with Bibliometrix and VOSviewer and coded against explicit business-model dimensions; one study added by citation searching brings the qualitative synthesis to 81.
Research concentrates on Indonesia and China and examines adopters (75 of 80) rather than builders. Coding reveals a creation-capture asymmetry: the reviewed studies generally report creation-side gains, yet none measures retained profit as a distinct outcome, cost structure is unreported in 63 and platform dependency in 49, and most evidence is cross-sectional. Adoption lenses reach entry, capability lenses reach conversion, and only governance lenses address how value is divided.
The review uses one database, supplemented by citation and hand-searching, and is scoped to platform adoption.
Managers should build digital capability before scaling platform use and scrutinize the commission and ranking terms that determine retained value. Operators and policymakers should govern platforms so that participation remains supportive rather than extractive.
The paper proposes the creation-capture asymmetry as an organizing lens and suggests that it partly reflects the theoretical lenses the field borrows.
1. Introduction
Digital platforms have transformed how firms create and capture value. Unlike pipeline firms, platform firms connect external producers and consumers, making the participant network their principal asset (Van Alstyne, Parker, & Choudary, 2016). This shifts attention to the business model: how a firm defines its value proposition and creates, delivers and captures value (Teece, 2010; Zott, Amit, & Massa, 2011). For small and medium-sized enterprises (SMEs) in emerging markets, which contribute up to a third of gross domestic product and nearly half of employment (Nugroho, Novitasari, & Timur, 2024), selling through marketplaces, social commerce, super-apps and cross-border platforms offers rapid access to markets, customers, logistics and finance (Nambisan, 2017; Singh, Munjal, Kundu, & Rangarajan, 2023). The same dependence, however, exposes them to commissions, algorithmic intermediation and regulatory imbalances that shift value toward the platform (Feng & Feng, 2025; Syahputra, Latumahina, & Shrestha, 2025).
A digital platform is a multi-sided infrastructure that mediates interactions between user groups and captures value through the rules and fees governing them (Van Alstyne et al., 2016). Platform adoption denotes an SME's use of a third-party platform as a channel or capability; a platform business model denotes the configuration through which the SME itself creates, delivers and captures value. Following Teece (2010), value creation is the value an SME generates for customers through the platform, and value capture is the share it retains after fees, competition and governance. The unit of analysis is the SME's business model, not the platform operator's.
Bibliometric analysis maps a knowledge base systematically (Aria & Cuccurullo, 2017; Donthu, Kumar, Mukherjee, Pandey, & Lim, 2021); combined with systematic synthesis, it can expose how emerging-market SMEs create and capture value. This study analyses 80 Scopus publications from 2016 to 2025 and addresses three research questions (RQs) (Figure 1, Section 3). RQ1: How has research on digital platform business models for SMEs in emerging markets evolved? RQ2: Which themes and theoretical perspectives explain how these SMEs create and capture value? RQ3: What synthesis and research agenda can advance understanding?
 The left column lists three research questions labeled RQ1, RQ2 and RQ3. The right column lists three research objectives labeled RO1, RO2 and RO3. Arrows connect each research question to its corresponding research objective.
Research questions and objectives of the study. Source: Authors' work
The left column lists three research questions labeled RQ1, RQ2 and RQ3. The right column lists three research objectives labeled RO1, RO2 and RO3. Arrows connect each research question to its corresponding research objective.Research questions and objectives of the study. Source: Authors' work
2. Literature review and research gap
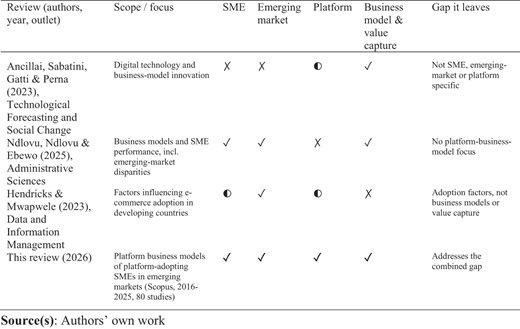
Research on this topic is growing but divided into areas that rarely connect: technology adoption (Vongsraluang & Bhatiasevi, 2017), firm capabilities and innovation (Xie, Han, Anderson, & Ribeiro-Navarrete, 2022), internationalization (Fan, Wang, & Ying, 2023) and platform governance (Mulyati & Murwadji, 2025). Recent reviews cover adjacent ground, namely digital technology and business-model innovation (Ancillai, Sabatini, Gatti, & Perna, 2023), business models and SME performance (Ndlovu, Ndlovu, & Ebewo, 2025) and e-commerce adoption in developing countries (Hendricks & Mwapwele, 2023), but none isolates the platform business model of emerging-market SMEs or distinguishes adopters from builders.
Table 1 shows that no prior review combines an SME focus, an emerging-market context, a platform focus and an explicit value-capture lens. This matters because adoption reviews (Hendricks & Mwapwele, 2023) treat platform use as the end point, while business-model reviews (Ancillai et al., 2023; Ndlovu et al., 2025) do not consider SMEs whose terms of capture are set by a third-party platform. This review extends them in three ways: it codes each study against explicit business-model dimensions, cross-tabulates theoretical lenses against the outcomes studies measure, and proposes an adopter-hybrid-builder typology and a governance-capability framework that locate where value capture is decided.
3. Materials and methods
The study follows the bibliometric-systematic literature review (B-SLR) approach (Marzi, Balzano, Caputo, & Pellegrini, 2025), combining bibliometric mapping with systematic synthesis. Analysis used the bibliometrix package in R (Aria & Cuccurullo, 2017) and VOSviewer (van Eck & Waltman, 2010).
3.1 Search strategy, screening and coding
The search combined three concept blocks in titles, abstracts and keywords, using OR within and AND between blocks: platform and e-commerce terms (for example, “digital platform*”, marketplace and “social commerce”), SME terms (SME, “small and medium-sized enterprise*” and MSME, for micro, small and medium-sized enterprises) and emerging-market terms (“emerging market*”, “emerging econom*” and named countries). The full string is given in Appendix A (Supplementary Material). Results were limited to English-language journal articles and reviews in their final publication stage, 2016 to 2025, a ten-year window ending with the last complete publication year before the search. Scopus was chosen because, for business and social-science research, it indexes a broader range of journals than Web of Science (Mongeon & Paul-Hus, 2016). Keywords were drawn from prior reviews and refined through pilot searches.
The search on 13 June 2026 returned 253 records; after removing one duplicate, 252 were screened. Studies were included if they concerned the digital platform business model of SMEs and their empirical context, not author affiliation, was a Morgan Stanley Capital International (MSCI) Emerging Markets economy. Title and abstract screening excluded 160 records; of 92 reports sought, six could not be retrieved, and six of the 86 assessed in full were excluded for ineligible samples, leaving 80 studies from 10 economies (Figure 2), following PRISMA 2020, Page et al. (2021), Haddaway, Page, Pritchard, and McGuinness, 2022. The author screened all records, using large language models (Claude, Anthropic; Gemini, Google) and Consensus only to pre-screen against the criteria, and verified every suggestion manually. A second human coder independently assessed a random subsample of 10 of the 86 full-text records (11.6%, within the 10–25% typical for reliability checks; O'Connor & Joffe, 2020), yielding 90% agreement and Cohen's κ = 0.74 (substantial agreement). Because ten records give an imprecise estimate, this is a check on the protocol rather than proof of reliability (Section 7). Figure 3 summarizes the resulting corpus.
 The flowchart starts with the identification of new studies via databases and registers, showing 253 records identified from databases and 0 from registers. One duplicate record was removed, leaving 252 records for screening. Title and abstract screening excluded 160 records. Of the 92 reports sought for retrieval, 6 could not be retrieved. 86 reports were assessed for eligibility, and 6 were excluded for ineligible samples, resulting in 80 new studies included in the review. The process also includes identification via other methods, with 15 records identified through citation searching, all of which were assessed for eligibility and 14 excluded for not meeting inclusion criteria. The flowchart details the steps and decisions in the study selection process, including the use of large language models for pre-screening and manual verification.
PRISMA framework. Source: Author's work using the PRISMA2020 tool (Haddaway et al., 2022)
The flowchart starts with the identification of new studies via databases and registers, showing 253 records identified from databases and 0 from registers. One duplicate record was removed, leaving 252 records for screening. Title and abstract screening excluded 160 records. Of the 92 reports sought for retrieval, 6 could not be retrieved. 86 reports were assessed for eligibility, and 6 were excluded for ineligible samples, resulting in 80 new studies included in the review. The process also includes identification via other methods, with 15 records identified through citation searching, all of which were assessed for eligibility and 14 excluded for not meeting inclusion criteria. The flowchart details the steps and decisions in the study selection process, including the use of large language models for pre-screening and manual verification.PRISMA framework. Source: Author's work using the PRISMA2020 tool (Haddaway et al., 2022)
 The table presents various metrics about a corpus of documents. The timespan covers from 2016 to 2025. There are 73 sources and 80 documents, with an annual growth rate of 34.07 percent. The corpus includes 259 authors, with 7 authors of single-authored documents. International co-authorship stands at 31.25 percent, and the average number of co-authors per document is 3.39. There are 331 author keywords and 5391 references. The average age of documents is 3.31 years, and the average citations per document is 24.93.
Main information about the corpus (Biblioshiny)
The table presents various metrics about a corpus of documents. The timespan covers from 2016 to 2025. There are 73 sources and 80 documents, with an annual growth rate of 34.07 percent. The corpus includes 259 authors, with 7 authors of single-authored documents. International co-authorship stands at 31.25 percent, and the average number of co-authors per document is 3.39. There are 331 author keywords and 5391 references. The average age of documents is 3.31 years, and the average citations per document is 24.93.Main information about the corpus (Biblioshiny)
Backward and forward citation searching on every included study and a hand-search of the 2016 to 2025 tables of contents of selected SME, information-systems, entrepreneurship and emerging-market journals yielded 15 further records, of which one met the criteria (Wang & Thai, 2026). The date limit fixes the bibliometric sample, but forward citation searching necessarily retrieves later work; this 2026 study met every substantive criterion, so it entered the qualitative synthesis only (flagged in Table 2), and excluding it changes no count, theme or conclusion. Bibliometric analyses therefore refer to 80 studies and the synthesis to 81.
Critical literature review of representative studies
| No. | Study | Focus and context | Method | Key finding |
|---|---|---|---|---|
| 1 | Aashish et al. (2025) | Platform capabilities and performance; craft-based SMEs, India | PLS-SEM; survey of 211 firms | Platform capabilities raise performance only indirectly, through business-model experimentation and competitive advantage |
| 2 | Huiping and Ao (2025) | Platform capability and digital innovation; manufacturing SMEs, China | Survey; SEM | The effect runs mainly through organisational resilience and is inverted U-shaped, so capability can be over-extended |
| 3 | Srisomwongse et al. (2025) | Capabilities and export intensity; SME exporters, Thailand | Survey of 174 exporters | Intensive platform use is associated with lower export intensity, indicating an over-reliance risk |
| 4 | Syahputra et al. (2025) | Shopee's bundling of in-house logistics; Indonesia | Normative legal analysis | Platform self-preferencing can restrict market access for rival providers and disadvantage SME sellers |
| 5 | Nayak, Nayak, and Joshi (2025) | Drivers of platform adoption; start-up entrepreneurs, India | PLS-SEM; about 700 entrepreneurs | Platform adoption shapes antecedents of entrepreneurial intention (about 63% of variance explained), moderated by demographics |
| 6 | Wang and Thai (2026)* | Digital business-model innovation; SMEs, China | Multi-informant survey of 266 SMEs; hierarchical regression | Platform capability drives business-model innovation, partly via strategic flexibility; entrepreneurial orientation strengthens and digital anxiety moderates this path |
| 7 | Herani (2025) | Regulation, algorithmic bias and e-commerce readiness; Indonesia | Survey; mediation and moderation | Perceived algorithmic bias weakens the benefit of government support, favouring fairer governance over more regulation |
| 8 | Probohudono et al. (2025) | Innovation and digital information technology (IT) capabilities; MSMEs, Indonesia | Survey; mediation | Capabilities mediate strategy and performance: platform resources pay off only when converted into capability |
Note(s): *Added by citation searching. PLS-SEM = partial least squares structural equation modelling; SEM = structural equation modelling
Because most primary studies do not describe themselves as business-model research, “business model” was not required in the query. It is instead an analytical lens applied at coding: each study was coded for value proposition, value creation, delivery and capture, revenue model, cost structure, governance, complementors, network effects and platform dependency (Table S1, Supplementary Material). Themes were induced from the extraction matrix (study design, value dimensions and key finding), and each study was assigned one primary theme (Appendix B). How far the field engages these dimensions is itself reported as a finding.
Study quality was appraised during revision with design-specific criteria informed by the Mixed Methods Appraisal Tool (Hong et al., 2018). Each empirical study was scored on three criteria: for surveys, a sample of at least 150, reported reliability and validity, and a common-method or non-response bias test; for archival and quasi-experimental studies, a documented data source, objective measures and an identification strategy; for qualitative studies, adequate cases or interviews, an explicit analytic procedure and acknowledged limitations. Studies meeting three criteria were rated high, two moderate and fewer low; conceptual and legal studies were not rated. Indicators were located in the full texts with language-model assistance, and each rating was checked against the article text (Table S2, Supplementary Material).
4. Results and interpretations
4.1 Publication trend
Output was minimal between 2016 and 2021, rose from four to ten articles in 2022, reached twelve in 2024 and peaked in 2025, indicating a young, accelerating field (Figure 4).
 The x-axis represents the years from 2016 to 2025, and the y-axis represents the number of documents, ranging from 0 to 30. The graph shows minimal output between 2016 and 2021, with a slight increase from 2 to 6 documents. From 2022 onwards, there is a significant rise, reaching 10 documents in 2022 and 2023, 12 in 2024, and peaking at 29 documents in 2025. This indicates a young, accelerating field.
Documents per year. Source: Scopus analytics
The x-axis represents the years from 2016 to 2025, and the y-axis represents the number of documents, ranging from 0 to 30. The graph shows minimal output between 2016 and 2021, with a slight increase from 2 to 6 documents. From 2022 onwards, there is a significant rise, reaching 10 documents in 2022 and 2023, 12 in 2024, and peaking at 29 documents in 2025. This indicates a young, accelerating field.Documents per year. Source: Scopus analytics
4.2 Countries
By author affiliation, output is led by Indonesia (25), China (22), India (10) and the United Kingdom (9) (Figure 5). By empirical context, which all geographic claims in this review use, the corpus concentrates on Indonesia (27), China (24), India (10), Thailand (7) and Malaysia (4), with no study set in the United Kingdom or the United States. Sub-Saharan Africa, Latin America and the Middle East contribute little (Figure 6), so findings from Asian platforms may not transfer to other market and regulatory settings.
 The x-axis lists countries or territories and the y-axis measures the number of documents from 0 to 27. Indonesia has the highest count at 25, followed by China at 22. India, the United Kingdom, Thailand, the United States, and Australia each have counts ranging from 7 to 10. Malaysia, the Philippines, and Singapore have the lowest counts at 3 to 5.
Documents by country. Source: Scopus analytics
The x-axis lists countries or territories and the y-axis measures the number of documents from 0 to 27. Indonesia has the highest count at 25, followed by China at 22. India, the United Kingdom, Thailand, the United States, and Australia each have counts ranging from 7 to 10. Malaysia, the Philippines, and Singapore have the lowest counts at 3 to 5.Documents by country. Source: Scopus analytics
 The map highlights countries with scientific production, with darker shades indicating higher production. China, India, and several countries in Southeast Asia are prominently highlighted.
Country map of document production. Source: Authors' work using RStudio
The map highlights countries with scientific production, with darker shades indicating higher production. China, India, and several countries in Southeast Asia are prominently highlighted.Country map of document production. Source: Authors' work using RStudio
4.3 Subject areas and affiliations
The field spans Business, Management and Accounting (27.4%), Social Sciences (17.2%), Economics, Econometrics and Finance (13.1%) and Computer Science (11.0%) (Figure 7). The most productive institutions, led by Universiti Utara Malaysia, Universiti Teknologi Malaysia and Chulalongkorn University, mirror the field's Asian base (Figure 8).
 The pie chart is divided into 12 slices representing different subject areas. Business, Management and Accounting is the largest category at 29.7 percent, followed by Social Sciences at 14.6 percent. Economics, Econometrics and Finance, and Computer Science each account for 13.9 percent. Decision Sciences makes up 7.6 percent, Psychology 4.4 percent, Engineering 3.8 percent, Arts and Humanities 3.2 percent, Environmental Sciences 2.5 percent, and Mathematics 2.5 percent. The smallest category, labeled Other, accounts for 3.8 percent.
Documents by subject area (Biblioshiny)
The pie chart is divided into 12 slices representing different subject areas. Business, Management and Accounting is the largest category at 29.7 percent, followed by Social Sciences at 14.6 percent. Economics, Econometrics and Finance, and Computer Science each account for 13.9 percent. Decision Sciences makes up 7.6 percent, Psychology 4.4 percent, Engineering 3.8 percent, Arts and Humanities 3.2 percent, Environmental Sciences 2.5 percent, and Mathematics 2.5 percent. The smallest category, labeled Other, accounts for 3.8 percent.Documents by subject area (Biblioshiny)
 The x-axis lists institutions and the y-axis measures document counts from 0 to 3.5. Universiti Kebangsaan Malaysia, Zhejiang University of Technology and Chulalongkorn University each have 3 documents. University of Wollongong, Zhejiang Gongshang University, Manipal Academy of Higher Education, UNSW Sydney, Universitas Indonesia, Universitas Gadjah Mada and Universitas Padjadjaran each have 2 documents.
Documents by affiliation (Biblioshiny)
The x-axis lists institutions and the y-axis measures document counts from 0 to 3.5. Universiti Kebangsaan Malaysia, Zhejiang University of Technology and Chulalongkorn University each have 3 documents. University of Wollongong, Zhejiang Gongshang University, Manipal Academy of Higher Education, UNSW Sydney, Universitas Indonesia, Universitas Gadjah Mada and Universitas Padjadjaran each have 2 documents.Documents by affiliation (Biblioshiny)
4.4 Three-field plot
The three-field plot (Figure 9) shows e-commerce bridging the leading countries (Indonesia, China and India) to outlets such as Humanities and Social Sciences Communications, Heliyon and Technological Forecasting and Social Change.
 The plot shows connections between keywords such as covid-19, trust, and e-commerce, countries including Indonesia, China, and India, and sources like Humanities and Social Sciences Communications and Heliyon. Lines indicate the relationships between these fields, highlighting the prominent role of e-commerce in bridging the countries to various academic outlets. All values are approximated.
Three-field plot: keywords, countries and sources (Biblioshiny)
The plot shows connections between keywords such as covid-19, trust, and e-commerce, countries including Indonesia, China, and India, and sources like Humanities and Social Sciences Communications and Heliyon. Lines indicate the relationships between these fields, highlighting the prominent role of e-commerce in bridging the countries to various academic outlets. All values are approximated.Three-field plot: keywords, countries and sources (Biblioshiny)
4.5 Thematic structure and keywords
The thematic map (Figure 10) positions themes by centrality and density (Aria & Cuccurullo, 2017). Motor themes include digital platforms, digitization and platform-driven innovation; niche themes cover social commerce and business-model innovation; emerging or declining themes include predatory pricing and e-marketplaces; and basic themes are e-commerce and MSMEs. E-commerce is also the most frequent keyword (16 occurrences, 9%), followed by small and medium enterprises (12) (Figure 11). Trend topics (Figure 12) show a shift from e-commerce and e-marketplace adoption (2019 to 2022) toward digital platforms, MSMEs and digitization (2024 to 2025).
 The thematic map positions themes by centrality and density. Motor themes include digitization, digital platform, and theoretical study. Niche themes cover India, social commerce, and business model innovation. Emerging or declining themes include predatory pricing and e-marketplace. Basic themes are e-commerce and MSMEs. E-commerce is the most frequent keyword, followed by small and medium enterprises. The map shows a shift from e-commerce and e-marketplace adoption toward digital platforms, MSMEs, and digitization.
Thematic map (Biblioshiny)
The thematic map positions themes by centrality and density. Motor themes include digitization, digital platform, and theoretical study. Niche themes cover India, social commerce, and business model innovation. Emerging or declining themes include predatory pricing and e-marketplace. Basic themes are e-commerce and MSMEs. E-commerce is the most frequent keyword, followed by small and medium enterprises. The map shows a shift from e-commerce and e-marketplace adoption toward digital platforms, MSMEs, and digitization.Thematic map (Biblioshiny)
 The tree map displays different themes by their centrality and density. The size of each rectangle represents the frequency of the keyword, with larger rectangles indicating higher frequency. Keywords such as e-commerce, digital platforms, and MSMEs are prominently featured. The map highlights motor themes like digital platforms and digitization, niche themes like social commerce, and emerging themes like e-marketplaces. The most frequent keyword is e-commerce with 16 occurrences, followed by small and medium enterprises with 12 occurrences.
Tree map of author keywords (Biblioshiny)
The tree map displays different themes by their centrality and density. The size of each rectangle represents the frequency of the keyword, with larger rectangles indicating higher frequency. Keywords such as e-commerce, digital platforms, and MSMEs are prominently featured. The map highlights motor themes like digital platforms and digitization, niche themes like social commerce, and emerging themes like e-marketplaces. The most frequent keyword is e-commerce with 16 occurrences, followed by small and medium enterprises with 12 occurrences.Tree map of author keywords (Biblioshiny)
 The x-axis represents the years from 2018 to 2025, and the y-axis measures term frequency from 5 to 15. The graph shows the trend topics 'small and medium-sized enterprise', 'thailand', 'digitization', 'digital platforms', 'msmes', 'indonesia', 'e-commerce', 'electronic commerce', 'e-marketplace', and 'smes'. 'Small and medium-sized enterprise' has the highest frequency at 15, peaking around 2024. 'Thailand' follows with a frequency of 12, also peaking around 2024. 'Digitization', 'digital platforms', and 'msmes' each have a frequency of 10, with their peaks around 2024. 'Indonesia', 'e-commerce', and 'electronic commerce' have frequencies of 7, with peaks around 2022. 'E-marketplace' and 'smes' have the lowest frequencies at 5, with peaks around 2020.
Trend topics (Biblioshiny)
The x-axis represents the years from 2018 to 2025, and the y-axis measures term frequency from 5 to 15. The graph shows the trend topics 'small and medium-sized enterprise', 'thailand', 'digitization', 'digital platforms', 'msmes', 'indonesia', 'e-commerce', 'electronic commerce', 'e-marketplace', and 'smes'. 'Small and medium-sized enterprise' has the highest frequency at 15, peaking around 2024. 'Thailand' follows with a frequency of 12, also peaking around 2024. 'Digitization', 'digital platforms', and 'msmes' each have a frequency of 10, with their peaks around 2024. 'Indonesia', 'e-commerce', and 'electronic commerce' have frequencies of 7, with peaks around 2022. 'E-marketplace' and 'smes' have the lowest frequencies at 5, with peaks around 2020.Trend topics (Biblioshiny)
4.6 Coupling and citation structure
Bibliographic coupling (Figure 13) groups the studies into clusters on capability and performance, adoption and readiness, and governance and internationalization, mirroring the thematic map. Journal citation analysis (Figure 14) identifies Humanities and Social Sciences Communications, Technological Forecasting and Social Change and Heliyon as the most influential outlets.
 The diagram displays nodes representing different studies connected by lines, indicating bibliographic coupling. The nodes are color-coded into clusters: green for capability and performance, blue for adoption and readiness, and red for governance and internationalization. The lines show the relationships and interactions between these studies.
Bibliographic coupling. Source: Authors' work using VOSviewer
The diagram displays nodes representing different studies connected by lines, indicating bibliographic coupling. The nodes are color-coded into clusters: green for capability and performance, blue for adoption and readiness, and red for governance and internationalization. The lines show the relationships and interactions between these studies.Bibliographic coupling. Source: Authors' work using VOSviewer
 The diagram has four red dots representing Humanities and Social Sciences Communications, Technological Forecasting and Social Change, Heliyon, and electronic markets. Three connecting lines show the relationships between these journals, indicating their influence and thematic connections.
Citation analysis (VOSviewer)
The diagram has four red dots representing Humanities and Social Sciences Communications, Technological Forecasting and Social Change, Heliyon, and electronic markets. Three connecting lines show the relationships between these journals, indicating their influence and thematic connections.Citation analysis (VOSviewer)
4.7 Systematic literature review
Coding the 80 studies produced six themes (Appendix B in Supplementary Material): adoption and readiness determinants (T1, n = 17); platform capabilities, innovation and performance (T2, n = 20); platform-enabled internationalization and global value chains (T3, n = 15); governance, regulation and power asymmetry (T4, n = 10); platform-based finance and inclusion (T5, n = 7); and marketing, social commerce and customer value (T6, n = 11). Governance is examined in only 32 of 80 studies, concentrated in T4: the field studies SMEs on platforms more than the rules and power of the platforms themselves.
The bibliometric results anticipate this structure: the three coupling clusters (Section 4.6) correspond to the capability (T2), adoption (T1) and governance and internationalization (T3 and T4) themes, the motor themes match the capability lens that dominates T2, and the marginal position of predatory pricing mirrors the thin governance evidence. The trend from e-commerce adoption to platform capability (Figure 12) foreshadows the first emerging trend (Section 4.7.2).
4.7.1 Theoretical perspectives
Technology adoption frameworks, namely the technology-organization-environment framework (TOE), the technology acceptance model (TAM) and the unified theory of acceptance and use of technology (UTAUT) (Davis, 1989; Tornatzky & Fleischer, 1990; Venkatesh, Morris, Davis, & Davis, 2003), and less often the theory of planned behaviour (TPB) and diffusion of innovations (DOI), explain adoption through technological, organizational and environmental conditions and perceived usefulness and ease of use (Alonzo & Abellana, 2025; Arista, Tjahjanto, Ernawati, Purabaya, & Abdullah, 2023; Budiono, Lau, Tibben, University of Wollongong, & University of Wollongong, 2020; Nugroho et al., 2024).
Dynamic-capability views and the resource-based view (RBV) (Barney, 1991; Teece, Pisano, & Shuen, 1997) make platform value conditional on internal capabilities such as absorptive capacity and capability reconfiguration (Aashish, Anubhav, Sharma, Singh, & Zohair, 2025; Huiping & Ao, 2025; Jiang, Yang, & Gai, 2023; Suzianti et al., 2024; Xie et al., 2022).
Information-systems success and signaling perspectives (DeLone & McLean, 2003; Spence, 1973) explain how system quality, trust and credible signals shape platform use and sales (Kristianto, Kusmaningtyas, & Susanti, 2023; Sombultawee, Tangpong, Wattanatorn, Li, & Boon-itt, 2025; Vongsraluang & Bhatiasevi, 2017).
Institutional and governance perspectives (DiMaggio & Powell, 1983) examine commissions, predatory pricing, algorithmic bias and state support (Herani, 2025; Mulyati & Murwadji, 2025; Rohman, Tahir, & Budisetyowati, 2025; Syahputra et al., 2025).
Together these perspectives support the review's central claim, but the evidence behind it differs in strength. Reasonably established, though mostly through cross-sectional associations, is that the reviewed literature generally reports platform-related gains in adoption, sales, reach and performance, and that these gains depend on internal capability (T1 and T2, 37 of 80 studies; 21 rated high in quality). Contested is the effect on internationalization, positive in some studies and negative in others (Srisomwongse, Roongruangsee, & Patterson, 2025; Zhang, Bai, Zhou, & Zhou, 2025). Value capture remains a research gap: no study measures retained profit or margin as a distinct outcome, and profitability appears only as an item within self-reported performance scales; cost structure is unreported in 63 studies, network effects and complementors in 52 and platform dependency in 49; and four of the ten governance studies are normative-legal, while only three use administrative or quasi-experimental data (e.g. Muthitacharoen, 2025). The asymmetry is therefore a robust pattern in what the field studies and measures, not a demonstrated causal relationship.
4.7.2 Emerging trends
From channel adoption to platform capabilities. Recent studies ask not whether SMEs use platforms but what firms must be able to do to benefit from them, treating capability and business-model experimentation as what turns access into performance (Aashish et al., 2025; Hu, Chen, Yang, Rizwan Ullah, & Zulfiqar, 2025; Xie et al., 2022).
A governance and fairness agenda. A growing body examines predatory pricing, algorithmic bias, monopoly practices and the platformization of informal work (Ai, 2025; Rohman et al., 2025; Syahputra et al., 2025), shifting from efficiency to fairness questions. Because most of this work is conceptual, legal or single-case, its empirical base remains thin.
Within this adoption-scoped corpus, 75 of the 80 studies examine adopters that use third-party platforms, and five examine hybrids that also build or operate some platform functions (e.g. Ai, 2025; Feng & Feng, 2025; Hendriyanto, Agung, Mandasari, Widaningsih, & Setyorini, 2023). None examines a builder operating its own multi-sided platform. Because the search centered on adoption, this marks a boundary of the review rather than proof that SME builders are absent from the wider literature.
4.7.3 Critical literature review
Quality appraisal qualifies these findings. Of the 74 empirical studies in the synthesis, 39 meet all three criteria, 18 meet two and 17 meet one or none (Table S2). Quality is highest in the capability theme (15 of 20 rated high) and lowest in the adoption and marketing themes (6 of 17 and 2 of 11 rated high), where small samples without bias tests are common. Only eleven studies use archival, panel, quasi-experimental or experimental data; the remaining quantitative evidence is cross-sectional and self-reported. Among recent studies, explanations based on platform and information technology (IT) capabilities dominate (Fitri, Habbe, Pontoh, & Afdal, 2025; Hu et al., 2025; Huiping & Ao, 2025; Probohudono, Suhardjanto, Aligarh, Chayati, & Putra, 2025), legal studies make predatory pricing, monopoly and tax fairness explicit (Abbas & Ramadani, 2025; Rohman et al., 2025; Syahputra et al., 2025), and business-model innovation is shown to require platform capability coupled with strategic flexibility and entrepreneurial orientation (Wang & Thai, 2026). Table 2 summarizes representative studies.
4.7.3.1 Conceptual synthesis
Figure 15 summarizes these roles. The empty builder category is the field's clearest blind spot, bounded by the adoption-scoped search.
 The diagram categorizes SME platform roles into three types: Platform adopter, Hybrid, and Platform builder. Platform adopters, with 75 instances, sell through third-party platforms like Shopee, Tokopedia, and Alibaba. Hybrids, with 5 instances, use third-party platforms and also build or operate some platform functions, such as a co-operative marketplace. Platform builders, with 0 instances, operate their own multi-sided platforms, setting rules, governing complementors, and capturing value through the architecture. The diagram indicates an increasing level of platform ownership, governance, and value-capture potential from left to right.
An adopter–hybrid–builder typology of SME platform roles (n = 75/5/0). Source: Authors' own work
The diagram categorizes SME platform roles into three types: Platform adopter, Hybrid, and Platform builder. Platform adopters, with 75 instances, sell through third-party platforms like Shopee, Tokopedia, and Alibaba. Hybrids, with 5 instances, use third-party platforms and also build or operate some platform functions, such as a co-operative marketplace. Platform builders, with 0 instances, operate their own multi-sided platforms, setting rules, governing complementors, and capturing value through the architecture. The diagram indicates an increasing level of platform ownership, governance, and value-capture potential from left to right.An adopter–hybrid–builder typology of SME platform roles (n = 75/5/0). Source: Authors' own work
Figure 16 proposes that capture depends on firm capability (vertical axis) and the fairness of platform and state governance (horizontal axis). A capable firm facing extractive terms, such as high commissions, self-preferencing or opaque ranking, creates value but loses part of it, while a weak firm captures little under any rules. Because governance is the least-studied axis, the framework is offered as a set of propositions for testing rather than an established model.
 The diagram is divided into four quadrants based on SME internal capability and platform and state governance. The top left quadrant, Value partly diverted, shows that a capable SME creates value but loses part of it due to commissions, ranking rules, and self-preferencing. The top right quadrant, Value captured, indicates that a capable SME under fair, enabling terms retains the value it creates. The bottom left quadrant, Value lost, shows that a weak capability and extractive terms deepen dependence and lock-in. The bottom right quadrant, Value under-realised, indicates that terms are fair but limited capability constrains both creation and capture.
Governance × capability: conditions under which SMEs capture platform-created value. Source: Authors' own work
The diagram is divided into four quadrants based on SME internal capability and platform and state governance. The top left quadrant, Value partly diverted, shows that a capable SME creates value but loses part of it due to commissions, ranking rules, and self-preferencing. The top right quadrant, Value captured, indicates that a capable SME under fair, enabling terms retains the value it creates. The bottom left quadrant, Value lost, shows that a weak capability and extractive terms deepen dependence and lock-in. The bottom right quadrant, Value under-realised, indicates that terms are fair but limited capability constrains both creation and capture.Governance × capability: conditions under which SMEs capture platform-created value. Source: Authors' own work
5. Discussion
The field is young but maturing quickly. Annual growth averaged roughly 34% over 2016 to 2025, concentrated where large SME sectors, active platform ecosystems and state digitalization agendas coincide, notably Indonesia and China, echoing disparities reported in broader reviews (Ndlovu et al., 2025).
The field borrows theory rather than building it and applies a business-model lens only implicitly, a pattern that resonates with reviews of digital business-model innovation (Ancillai et al., 2023).
The central finding is a creation-capture asymmetry: the reviewed literature generally reports that platforms expand reach, customers and sales, whereas whether that value is retained, which is theorized to depend on internal capability and on platform and state governance, is rarely measured.
Two blind spots follow. Governance, meaning commissions, self-preferencing, ranking rules and state regulation, is theorized to shape value capture yet is examined in only 32 of 80 studies, mostly without causal designs. No included study examines SMEs that build their own platforms, a boundary that a builder-focused search should test.
6. Implications
6.1 Implications for theory
The review makes three theoretical contributions. It consolidates a fragmented literature into one map of themes, intellectual structure and lenses. It advances the creation-capture asymmetry, reorganizing scattered and contradictory results around one tension and extending the creation-capture distinction of business-model theory to emerging-market SMEs. And it suggests that the asymmetry partly follows from how the field borrows theory. Table 3 cross-tabulates each study's lens against the outcome it measures and its theme. Adoption theories terminate in adoption or intention outcomes and so cannot, by construction, speak to capture. Capability theories reach performance and innovation but stop short of profit. Only institutional and governance lenses address how value is divided, yet they form the smallest group and are mostly normative or legal. The asymmetry thus appears to be partly a product of theory choice as well as an empirical gap, a pattern the cross-tabulation describes but cannot test.
Theoretical lens by value outcome and dominant theme (n = 80 Scopus-derived coded studies; the study added by citation searching is discussed in Table 2 but was not coded)
| Theoretical lens (n) | Dominant outcome measured | Value stage reached | Dominant theme(s) | Analytical limitation |
|---|---|---|---|---|
| Adoption models: TAM, UTAUT, TOE, TPB, DOI (19) | Adoption or intention (10 of 19) | Entry only | T1 Adoption and readiness determinants (10); T6 marketing, social commerce and customer value (4) | Explains entry; cannot observe creation or capture |
| Capability and resource views: RBV, dynamic capabilities, resource orchestration (23) | Performance or innovation (12 of 23) | Creation and conversion | T2 Platform capabilities, innovation and performance (15); T3 platform-enabled internationalization and global value chains (5) | Explains conversion; stops short of retained profit |
| Institutional, governance and signaling perspectives (10) | No measurable outcome (4 of 10) | Division of value | T4 Governance, regulation and power asymmetry (6) | Addresses appropriation but largely normative, rarely causal |
| No explicit theoretical lens (28) | No measurable outcome (9 of 28) | Mixed or unstated | T3 Platform-enabled internationalization and global value chains (6); T6 marketing, social commerce and customer value (5); T1 adoption and readiness determinants (5) | Descriptive; contributes little to cumulative theory |
Resolving it requires integrating the three families, using adoption theory to explain entry, capability theory to explain conversion and governance theory to explain division, with measures that extend to retained profit. Research priorities follow: the unstudied SME-as-platform-builder; the conditions under which adoption yields retained profit rather than sales alone; longitudinal and quasi-experimental tests of governance; the possible curvilinear link between platform intensity and internationalization; and evidence beyond Indonesia and China. Testable propositions include that internal capability moderates the link between platform resources and performance, and that governance terms moderate the share of created value an SME retains.
6.2 Implications for readers
For researchers entering the field, the bibliometric maps locate its center of gravity, and the extraction table (Appendix B) lists all 80 studies with country, theme, method and key finding. The review also cautions that 48 of the 74 empirical studies are cross-sectional surveys, most analyzed with PLS-SEM, from a handful of economies, so findings, and the assumption that platform adoption is uniformly beneficial, should be weighted accordingly.
6.3 Implications for practice
For managers, the evidence suggests that platform participation is a capability- and terms-dependent decision rather than an automatic benefit. Building digital capability before scaling platform use, treating platforms as one channel among several, and monitoring the commissions and ranking terms that shape retained value are prudent responses, although their effect on profit has not yet been tested; one study links intensive platform use to lower export intensity (Srisomwongse et al., 2025).
For operators and policymakers, the implications are more tentative because governance evidence is largely normative or legal. Commission and ranking rules that share value fairly, and competition rules against predatory pricing, tying and self-preferencing, are plausible levers for keeping platform dependence supportive rather than extractive, but their effect on SME value capture awaits causal tests.
7. Limitations
The review has limitations. It draws on one database, supplemented by citation and hand-searching, so studies indexed only elsewhere or in regional outlets may be under-represented. Screening used large-language-model assistance with manual verification; the second-coder check covered only ten full-text records, so the κ estimate is imprecise, and theme and business-model coding were performed by a single coder. The review was not pre-registered, and the quality appraisal, added during revision, uses simple design-specific criteria; given mixed survey, legal and single-case designs, claims about capture and governance are indicative. The corpus is small, so some maps are sensitive to threshold choices. Only English-language articles and MSCI Emerging Markets economies were included, so part of the geographic gap reflects the inclusion rule itself.
8. Conclusion
This review mapped a decade of Scopus-indexed research on digital platform business models among platform-adopting SMEs in emerging markets. Its organizing insight is a creation-capture asymmetry: the reviewed studies generally report gains in value creation, but capture, theorized to depend on internal capability and platform governance, is rarely measured and, with the unstudied SME-as-platform-builder, remains the field's principal blind spot. The integrated map, extraction base and agenda offer a reference point for researchers, operators and policymakers seeking to keep platform participation supportive rather than extractive.
The supplementary material for this article can be found online.

