


The purpose of this paper is to explore the associations between food literacy, consumer profiling and purchasing behaviour in a sample of Italian consumers.
Participants (N = 194) completed an online survey including personal data, two questionnaires on purchase behaviour and food consumption, the General Trust Scale (GTS), a questionnaire assessing individual chronotype and two scales about food literacy: one investigating nutritional knowledge (short food literacy questionnaire, SFLQ) and the other focussing on procedural skills (self-perceived food literacy scale, SPFL). Associations between food literacy, consumer profiling and purchase behaviour were analysed with linear regression models.
Participants with specific education in nutrition reported higher scores in food literacy. The final score of food literacy was predicted by a greater attention to nutritional content and nutritional properties of products. Women paid more attention to nutritional properties than men, and they obtained higher scores in SFLQ. Evening types obtained lower scores in SFPL compared to intermediate and morning chronotypes. Body mass index (BMI) was negatively correlated to SPFL score, while it was associated with the easy availability of a product, so that obese (BMI ≥ 30) subjects considered the easy availability of a product more important compared to non-obese ones (BMI < 30).
This study investigates the influence of personal and psychometric variables of consumer profiling on food literacy and consequently on purchase behaviour, paving the way for implementing healthier food consumption policies. These findings reinforce the primacy of specific education in building healthy eating habits.
Introduction
The concept of food literacy goes beyond mere knowledge of nutritional recommendations or the possession of good culinary skills: food literacy is indeed a cultural merge of nutritional, health and environmental knowledge (Perry et al., 2017). It has been widely demonstrated that the possession of good levels of food literacy positively influences eating behaviours (e.g. Wijayaratne et al., 2018), e.g. resulting in a higher resort to nutritional labels during food products purchase (e.g. Perry et al., 2017). However, it is still unclear whether some specific components of food literacy compared to others are more effective in promoting healthy habits (e.g. Truman et al., 2017). The relationship between procedural and declarative components of food literacy, and the evaluation of their impact on food purchase have been poorly investigated in the literature so far. Fernandez et al. (2019) explored the associations between five dimensions of food literacy (knowledge, planning, mechanical cooking skills, food conceptualisation and social aspects) and diet quality in a Canadian sample of parents in charge of food preparation, reporting a strong association of diet quality with both nutritional knowledge and food conceptualisation (Fernandez et al., 2019). Questionnaires systematically investigating food literacy domains are available, such as the short food literacy questionnaire (SFLQ) and the self-perceived food literacy (SPFL) questionnaire. SFLQ investigates those individual abilities, e.g. retrieving and understanding nutritional information, essential to make healthy food choices (Gréa Krause et al., 2018), while SPFL focusses on a larger variety of “food skills practicalities” compared to SFLQ (Poelman et al., 2018). Poelman and colleagues encouraged a synergic use of SFLQ and SPFL for future studies. They also hoped for a more accurate evaluation of the relationship between the SPFL domains and personal variables (e.g. age, gender, level of education, current occupation).
To the best of our knowledge, no prior study combined the two questionnaires SPFL and SFLQ as a measure of food literacy, in order to investigate the relationship between food literacy levels and food choice. Also, we did not find any previous study exploring consumers' psychometric profiling, in terms of chronotype and trust levels, in relation to food choice and food literacy levels. We think that the assessment of consumers psycho-profiling might bring new insights into the understanding of food purchase behaviour and healthy lifestyles promotion. The present study intends to contribute to the existing literature by addressing the associations between food literacy (both declarative and procedural), psychometric variables (e.g. chronotype) and purchase habits in Italy. Moreover, this work benefits from the comparison between a group of students in Human Nutritional Sciences and an age-matched and sex-matched control group.
Possible practical implications of our findings and recommendations for future research are provided in the discussion section.
Literature background
For consumers, the ability to read nutritional labels is crucial to make decisions on healthy food choice (European Commission, 2007). Experts reproach careless consumers, but customers rightfully complain about the difficulty they usually have in reading nutritional labels (Cowburn and Stockley, 2004; Silayoi and Speece, 2004; Rothman et al., 2006). Most studies report a more frequent use of nutrition labelling amongst consumers with a higher level of education (Gupta and Dharni, 2016; Cavaliere et al., 2017). Differences in lifestyle (e.g. sleep habits, dietary patterns, etc.) also appear to lead to differences in the frequency of resort to nutritional labels (Drichoutis et al., 2006; Grunert and Wills, 2007; Visschers et al., 2010). Some scholars have pointed out that the perception of food healthiness, e.g. the estimation of calories in a food product, changes in relation to the body weight: e.g. obese subjects tend to underestimate the caloric content of food (Carels et al., 2006; Larkin and Martin, 2016).
Some scholars state that supplying nutritional information is not enough to guide consumers towards healthier food choices (Worsley, 2002). In this regard, Stevenson et al. (2007) investigated the relationship of adolescents with food, recruiting 73 adolescents for 12 focus groups. The authors highlighted that, surprisingly, self-perception is a better determinant of food preference and behaviour as compared to nutritional knowledge (Stevenson et al., 2007). Indeed, nutritional education is a broader concept, whose goals are directed to improve people's motivation and skills in order to apply nutritional knowledge and to modify their environment accordingly (Piscopo, 2019). Increasing evidence shows that sleep habits influence food choices. Chronic sleep deprivation is associated with increased appetite (Taheri et al., 2004), especially for high-calorie foods rich in sugars (Spiegel et al., 2004) and fats (Spaeth et al., 2013). Adolescents with night-time (i.e. evening) chronotype tend to consume more caffeine-containing drinks and fast food, but less dairy products, fruits and vegetables (Harb et al., 2012; Arora and Taheri, 2015; Rossbach et al., 2018). Overall, evening chronotype is generally associated with a higher prevalence of metabolic and cardiovascular disorders (Wong et al., 2015; Knutson and von Schantz, 2018). Vera et al. (2018) investigated the relationship between chronotype and eating behaviours in a large sample of 2,126 participants, addressing the modifiable lifestyles involved in the development of metabolic syndrome. Despite the emerging evidence of a contribution of chronotype and chrononutrition in the development of cardiometabolic disorders (Almoosawi et al., 2019), little is known about how chronotype and meal timing might influence food literacy and food choice. Along with the personal variables influencing food choice, food literacy sums up the knowledge required to make a conscious and responsible purchase. The relationship between food literacy and purchase behaviour has received experimental attention over the last decade (e.g. The National Academies of Sciences, Engineering, and Medicine, 2016). Procedural skills (e.g. food preparation) and declarative knowledge (e.g. information about nutritional properties of food) are both instrumental for boosting healthy behaviours (Jones, 1994; Kolasa et al., 2001). For instance, promising findings from a 10-years longitudinal study report that procedural food knowledge in adolescents increases adherence to healthy diet (Laska et al, 2012). In a systematic review on food literacy programmes in secondary schools Vaitkeviciute et al. (2015) highlighted the need of promoting evidence-based research activities directed to measure all the domains of food literacy. In the attempt of defining the components of food literacy Vidgen and Gallagos (2014) conducted two studies, one on food experts and the other on young people considered as “experts in the everyday practicalities of feeding themselves”. From this double perspective, the authors interpreted the results of a semi-structured interview concluding that food literacy can be conceptualised as supportive resilience. They defined food literacy as a dynamic attribute of “protecting diet quality through change and strengthening dietary resilience over time”. Pointing out the multidimensional and contextual nature of food literacy, in line with a broader definition of health literacy (Frisch et al., 2012), Vidgen and Gallagos (2014) extended the components of food literacy beyond limited aspects such as cooking and meal preparation. As a result, they proposed 11 components of food literacy, subsumed into four domains, i.e. (1) planning and management, (2) selection, (3) preparation and (4) eating.
Research hypotheses
Since food literacy has been broadly studied in relation to different aspects of individual eating behaviours, as well as eating patterns have been associated with personal characteristics such as age, the level of education and the chronotype, we formulated the following hypotheses:
Specific education in human nutrition, age and sex might be associated with food literacy levels. Also, given the combination of two different tools exploring food literacy, we expected that the personal characteristics listed above might explain the possible discrepancies between SPFL and SFLQ scores.
Psychometric (i.e. chronotype and trust) and anthropometric (i.e. body mass index (BMI)) variables might influence food literacy levels, and explain differences between SPFL and SFLQ scores. Recent studies reported the possible association between circadian rhythms and BMI with respect to eating patterns (Froy, 2010; Muñoz et al., 2017; Huang et al., 2011; Maukonen et al., 2016; Mazri et al., 2019). However, still little is known about the possible relationship between these factors and food literacy levels.
Purchase habits, e.g. the attention attributed to nutritional properties of food products, could contribute to explain food literacy levels (SPFL and SLFQ). Indeed, we intended to support the hypothesis that healthy eating habits, e.g. the resort to nutritional labels, largely depend on education (Dudley et al., 2015; Sogari et al., 2018; Hamulka et al., 2018), specifically stressing the relevant role of food literacy.
Methods
Participants' eligibility and recruitment
The sample is composed of Italian participants (N = 194; avg. age (in years) 33.52, SD: 12.2; 29% male, 71% female), including students (N = 64) from the University of Pisa, enrolled in the master's degree course in Human Nutritional Sciences and representative of the per year total number of students attending the course. Participants are fluent in Italian language and all are over 18 years old. Participants were asked to sign a written consent for the privacy and the participation to the study before answering to the questions of the survey. The study has received the approval of ethical committee of the University of Pisa on May 10 (2019), with protocol number 0048625/2019. The collaboration of the Council of the Course in Human Nutritional Sciences (headed by Prof. M.C. Gargini) within the Department of Pharmacy of the University of Pisa is acknowledged for their help. Being the analysis carried out neither an interventional nor a clinical study, the importance of fixing ex ante the sample size is reduced. The number of subjects selected (N = 194) is compatible with correlation coefficients greater or equal 0.2, sign. 0.05 and power 80%. With respect to the linear model, the sample size is compatible with a R2 at least equal to 0.1, 5 regressors, at the most; a sig. level equal to 0.01 at the most, and a power level of 0.88, at the most.
Procedure
An online survey was sent to all participants via e-mail. Thanks to the collaboration of the Department of Pharmacy of the University of Pisa, students enrolled in the master's degree course in Human Nutritional Sciences were invited to fill in the questionnaire sent to their institutional e-mail address.
Description of the variables
The online survey is composed of five validated questionnaires, translated into Italian, for assessing respectively food literacy level, chronotype, general trust level and eating and purchasing behaviours. Additional questions were added to explore personal (age, gender, level of education, current occupation) and anthropometric (height, weight) data. For the development of the “Personal data” section, the website of the National Institute of Statistics (ISTAT) was consulted.
The measurement of food literacy level was assessed through two questionnaires: The SFLQ and the SPFL Scale.
Short food literacy questionnaire (SFLQ). The SFLQ is a short questionnaire consisting of 12 items, developed and validated (on a sample size of N = 350) by Gréa Krause and colleagues and published in 2018, with the aim of providing a tool to assist in the planning of public health interventions (Gréa Krause et al., 2018). To answer each question, the subject is required to make a judgement on a 4- or 5-point Likert scale, ranging from “completely agree” to “completely disagree”, or from “very good” to “very bad”, or from “very easy” to “very difficult”, or from “never” to “always”, depending on the question asked. Overall, the SFLQ questionnaire assesses the ability to research, understand and judge information regarding healthy eating and the ability to use it in practice (Gréa Krause et al., 2018).
The SPFL Scale is a questionnaire consisting of 29 items divided into eight dimensions, developed and validated (on a sample size of N = 755) by M. P. Poelman and colleagues and published in 2018 (Poelman et al., 2018). It is one of the first questionnaires developed to try to comprehensively assess the level of self-perceived food literacy by investigating different aspects of eating habits and food and drink purchasing behaviour. As a final score of SPFL (SPFLtot) we considered the mean value of its eight dimensions.
The SFLQ assesses participants knowledge related to food, while considering only one question on food preparation skills, i.e. “Think about a usual day: how easy or difficult is it for you to compose a balanced meal at home?”. Some items that exemplify the focus on information acquisition process are the following:
“In general, how well do you understand the following types of nutritional information? (1) Nutrition information leaflets / (2) Food label information / (3) TV or radio program on nutrition / (4) Oral recommendations regarding nutrition from professionals / (5) Nutrition advice from family members or friends”;
“Do you know the official [Country] recommendations about fruit and vegetable consumption?”;
“How easy is it for you to judge if media information on nutritional issues can be trusted?”.
The SPFL, instead, together with the evaluation of the capability to obtain and read information about food properties (the domain named “Examining food labels” accounts 2 items), it addresses food preparations skills (6 items: e.g. “Are you able to prepare fresh fish in different ways?”; “Are you able to see, smell or feel the quality of fresh foods? For example of meat, fish or fruit?”), resilience and resistance (6 item: e.g. “Are you able to eat healthily if the situation deviates from a regular situation?”); daily food planning (2 items: e.g. “If you have something to eat, do you take account of what you will eat later that day?”), as well as healthy snack styles (4 items), social and conscious eating (3 items), healthy budgeting (2 items) and healthy food stockpiling (4 items).
For a detailed description of the SPFL scale see Table 2 in Poelman et al. (2018). For a detailed description of SFLQ scale see Table 2 in Gréa Krause et al. (2018). See also the actual version of the questionnaire with the data analysed in this study at this link http://bit.do/qrcode/quest_ita.
Linear regression model of personal and socio-demographic characteristics considered as regressor for SPFL final score
| Personal and socio-demographic variables | Estimate | Std. error | t value | Pr(>|t|)* |
|---|---|---|---|---|
| Intercept | 0.821093 | 0.083743 | 9.805 | <2e-16 |
| BMI | −0.007351 | 0.003469 | −2.119 | 0.0354 |
| Specific nutrition education | 0.129066 | 0.029931 | 4.312 | 2.65e-05 |
| Gender | −0.042912 | 0.032033 | −1.340 | 0.1820 |
| Age | 0.001894 | 0.001189 | −1.340 | 0.1129 |
Note(s): *The level of significance was set at p < 0.05
To assess food consumption, the questions of Section A, B and C (Part C) of the National Survey on Food Consumption in Italy (conducted by the “Istituto Nazionale di Ricerca per gli Alimenti e la Nutrizione”, INRAN) (D'Addezio et al., 2011; Leclercq et al., 2009) have been included. These questions focus on eating habits and socio-demographic characteristics. The National survey from which we took these questions was conducted by the National Research Institute for Food and Nutrition, with the aim of collecting data on socio-demographic characteristics, habits and lifestyles of households related to nutrition. It was conducted in Italy between 2005 and 2006 by administering a questionnaire to each member of the families included in the sample, and a questionnaire to the person responsible for the food purchase in each family. Two questions have been taken also from “Section G” (D'Addezio et al., 2011), which investigates “Preferences, opinions, attitudes”.
The level of trust was assessed by the General Trust Scale. This is a self-report questionnaire composed of six questions whose possible answers range on a Likert scale from 1 (totally disagree) to 6 (totally agree). The final score is given by the average of the six answers (Yamagishi and Yamagishi, 1994). This questionnaire aims to investigate the level of general trust of a participant towards people and how the participant considers herself or himself a reliable person.
The chronotype of participants was defined according to the reduced morningness–eveningness questionnaire (rMEQ), the 5-item reduced version of the MEQ, a validated self-report questionnaire investigating the individual chronotype (Adan and Almirall, 1991). The final score ranges from 4 to 26. A total score <12 indicates an evening type (ET); a score between 12 and 17 is associated to an intermediate type (neither type, NT) and a score >17 to a morning type (MT). The Italian version of the rMEQ was validated by Natale et al. (2006).
Statistical analyses
We ran a linear regression analysis in line with those studies which considered food literacy (e.g. SPFL) as a dependent variable (e.g. Poelman et al., 2018). Other studies instead used food literacy as a regressor of linear models with behavioural dependent variables, such as the type of food consumption (e.g. fat consumption in Yahia et al., 2016) or food habits (e.g. Kalkan 2019).
The analysis was repeated to evaluate the relationship between food literacy and purchase behaviour, controlling for the personal and socio-demographic variables. The comparisons between groups were conducted using Wilcoxon test and correlation analyses were run with Spearman's method. Since the distribution of the values of the final score of SPFL is remarkably asymmetric, we used the logarithm of SPFL final score (“log(SPFLtot)”) in the following analysis. The level of significance was set at p < 0.05. All statistics were performed with RStudio.
Selection biases
A first potential bias could come from the selection of a specific real area. In our sample, participants are from the northern, the centre, as well as from the southern regions of Italy.
A second possible bias could come from the heterogeneity in the level of specific education within the subgroup of participants who attended courses in Human Nutritional Sciences. Since we recruited this subgroup from one single faculty of Human Nutritional Sciences, this bias was avoided. This subgroup can be hence considered homogeneous in terms of education received.
The most relevant biases often come from self-selection of respondents. First, individuals more interested in nutrition could have been more prone to answer our survey. In our sample, instead, participants without a specific nutrition education were more in number than participants with such nutrition educational background (130 vs 64, respectively). Secondly, to recruit a large sample of respondents, the survey was disseminated online. This choice might have reduced the probability of selecting older respondents.
Finally, we tried to avoid response and non-response biases by using validated and broadly accepted questionnaires, as well as setting the questions of the survey as required. Moreover, the approval of the Ethical Committee clarified to the participants the policies on data protection and management.
Results
Sample characteristics
The sample reached a median score of ∼50 (out of 73) in SFLQ (mean = 52.08, SD = 9.03; min = 28, max = 73), reporting an “excellent” result in 73% of the cases. With respect to SPFL instead, the sample showed a mean of 2.15 out of 5 (SD = 0.39, min = 0.75, max = 3,125). The main socio-demographic information acquired is reported in Table 1.
Socio-demographic characteristics
| Socio-demographic variables | Category n (%) 194 (100%) | |||
|---|---|---|---|---|
| General Education | Graduated | High school | Middle school | None |
| 93 (47.9%) | 86 (44.3%) | 13 (6.7%) | 2 (1.0%) | |
| Specific Nutrition Education | Yes | No | ||
| 67 (33%) | 130 (67%) | |||
| Of which: Graduated | ||||
| <5 years | 33 (51%) | |||
| >5 years | 12 (19%) | |||
| Still ongoing | 30% | |||
| Occupation | Working | Students | Unemployed | Retirees and households |
| 97 (50%) | 66 (34.0%) | 16 (8.2%) | 15 (7.8%) | |
| Origin | North | Centre | South | Isles |
| 62 (32.0%) | 39 (20.1%) | 81 (41.8%) | 12 (6.2%) | |
| Domicile | North | Centre | South | Isles |
| 67 (34.5%) | 49 (25.3%) | 76 (39.2%) | 2 (1.0%) | |
We first verified whether the two measures of outcome for food literacy (SPFL and SFLQ) were correlated one to the other, in terms of total punctuation as well as item per item (see Figure 1). The final scores of the two questionnaires (SPFLtot and SFLQtot) used to evaluate the food literacy were in fact strongly correlated one to the other (Spearman's correlation, p < 0.0001).
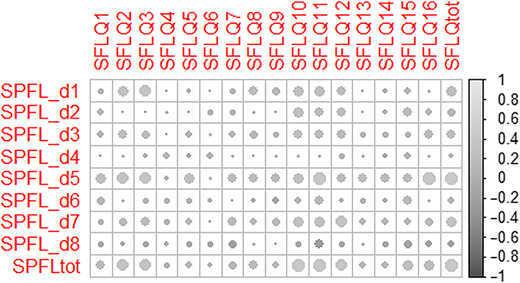
Matrix of correlations between Self-Perceived Food Literacy Scale (SPFL) (domains and total mean score) and Short Food Literacy Questionnaire (SFLQ) (single items and total score)
Matrix of correlations between Self-Perceived Food Literacy Scale (SPFL) (domains and total mean score) and Short Food Literacy Questionnaire (SFLQ) (single items and total score)
Personal variables explaining food literacy levels
Participants with specific education in human nutrition reported higher scores of food literacy compared to people without this knowledge (p < 0.0001 for SFLQ and p < 0.0001 for SPFL). Women reported higher scores in SFLQ compared to men (p < 0.05). On the contrary, there was no significant difference between females and males for SPFL score. These findings confirmed the first hypothesis.
To test the second hypothesis, we performed a linear regression model controlling the previous results for the main personal and socio-demographic variables. It emerged that the BMI is a good predictor of the final score of SPFL (p < 0.05) (see Table 2).
Adding to the linear regression model the psychometric variables assessed with the morningness–eveningness questionnaire (rMEQ) and with the GTS, we observed that the MEQ category “evening” predicts lower scores in SPFL compared to “intermediate” (p < 0.05) and “morning” (p < 0.05) chronotypes. This was not true for SFLQ. No statistically significant results were reported for trust levels in predicting food literacy levels. The second hypothesis was hence partially confirmed.
Food literacy and purchase behaviour
To test the third hypothesis, we grouped variables form the survey promoted by the “Istituto Nazionale di Ricerca per gli Alimenti e la Nutrizione” (INRAN) as well as purchase behaviour variables, exploring their relationship with food literacy. We performed a linear regression model considering food literacy (SPFL and SFLQ) as the outcome, and purchase behaviour variables as predictors, and controlling for personal and socio-demographic variables (see Table 3).
p-values of the statistically significant good predictors of food literacy, measured as SFLQ and SPFL, amongst the variables analysed as purchase behaviour (throughout purchase behaviour questionnaire and INRAN)
| SFLQ | SPLF | |
|---|---|---|
| INRAN | ||
| Additives& | 0.03335 (always) | |
| Nutritional Content& | 0.03540 (sometimes) | 0.0216 (always) |
| 0.02648 (often) | ||
| Origin& | 0.0216 (sometimes) | |
| 0.0280 (always) | ||
| 0.0125 (often) | ||
| Sex° | 0.01843 (female) | |
| Age | ||
| BMI | ||
| Domicile# | 0.03498 (Isles) | 0.0461 (South) |
| 0.00768 (South) | ||
| Birthplace# | 0.04475 (South) | |
| Purchase behaviour | ||
| Nutritional properties | 7.77e-06 | 0.00967 |
| Sex° | 0.0256 (female) | |
| Age | ||
| BMI | ||
| Domicile# | 0.0195 (North) | |
| 0.0193 (South) | ||
| Birthplace# | 0.03245 (Isles) | |
| 0.03131 (South) | ||
Note(s): &: compared to “never”; °: compared to males; #: compared to the Centre of Italy
Further, the attention attributed to nutritional content and the attention attributed to nutritional properties are good predictors of SFLQ and SPFL. When compared by sex, it was found that females pay more attention to nutritional properties compared to males (Wilcoxon rank sum test, p < 0.05).
An interesting correlation can be seen between BMI and easy availability (Spearman's rank correlation, p < 0.05). People who pay more attention to the availability of a product (equal to 5 on a Likert scale from 1 to 5) tend to have a higher BMI compared to those who are less careful to this aspect (Wilcoxon rank sum test, p < 0.0001) (see Figure 2a). Indeed, participants with a BMI equal or greater than 25 (overweight subjects) seem to pay more attention to the availability of a product compared to people with a lower BMI (Wilcoxon rank sum test, p < 0.05). This effect is even more pronounced for obese subjects (BMI ≥ 30; Wilcoxon rank sum test, p < 0.05) (see Figure 2b).
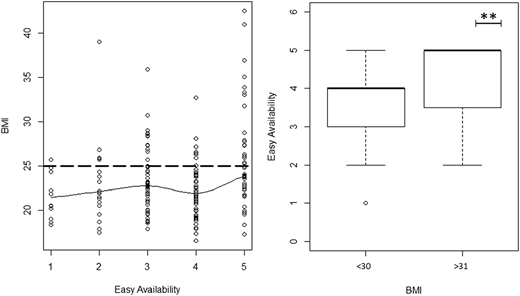
(Left, 2a) Body Mass Index (BMI) distribution based on the attention participants paid to the easy availability of a product; the dotted line indicates the BMI value (=25) considered as the upper limit of the normal interval. (Right, 2b) Comparison between obese participants (BMI ≥ 30) and non-obese participants (BMI < 30) with respect to the easy availability of a product
(Left, 2a) Body Mass Index (BMI) distribution based on the attention participants paid to the easy availability of a product; the dotted line indicates the BMI value (=25) considered as the upper limit of the normal interval. (Right, 2b) Comparison between obese participants (BMI ≥ 30) and non-obese participants (BMI < 30) with respect to the easy availability of a product
Discussion
Profiling consumers' behaviours is the target of many companies. Sales are affected by the heterogeneity of consumers' intentions, and profiling methods attempt to bring order to this chaos. Such an approach should be extended to purchasing behaviours that also have an impact on people's health outcomes such as food purchases. Healthy lifestyles are recommended since increased prevalence of chronic diseases due to poor eating routines results in long term burden of the diseases, and their associated unsustainable social and economic impacts (e.g. costs related to treatments, hospitalizations, productivity loss) (Drichoutis et al., 2006; Visschers et al., 2010).
Labels reading
Consumers live in a hectic society which compels them to choose time-saving options, including food shopping and meal preparations, and make them often skip the reading of nutritional labels. New trends in food consumption have been registered worldwide (Casini et al., 2013). As an example, the boom of “ready to eat” and out-of-home food, the growing use of food delivery and the so-called “instant food” – products with a high service content (Istituto di Servizi per il Mercato Agricolo Alimentare, ISMEA, 2019). At the same time, biological and green products fill in the blanks, having now left their niche. The ecological approach results in the preference for seasonal fruits and vegetables, zero-kilometre products and items sold loose and unpackaged (Istituto Nazionale di Statistica (ISTAT, 2015).
When time is limited, nutritional labels, especially if not easy to read, are probably the first informative element in the decision process to be sacrificed (Grunert and Wills, 2007). For this reason, many actions can be implemented to identify the best location on the packaging to increase their relevance. When consumers search for a product on a shelf, an eye-catching shape or an attractive label contribute to its success in consumer purchase. Informative elements can be transformed in visual elements that trigger consumers' attention (Bo Rundh, 2016; García-Madariaga et al., 2019). An interesting solution comes from the Front-Of-Pack (FOP) labels, and in particular the “traffic light” system, which have been designed to provide consumers with nutritional information easy to access and read (van Camp et al., 2010).
Fordyce-Voorham included the ability to read and understand nutritional labels in the concept of food literacy (Fordyce-Voorham, 2011). In line with Fordyce-Voorham's claim, from our results emerge that higher SFLQ and SPFL scores are associated with a higher attention to nutritional information reported on labels (i.e. nutritional content and nutritional properties). Females showed a greater attention to nutritional properties compared to males. They also reported higher scores in SFLQ, in line with the current literature. Some authors suggested that a cultural bias of body image can be responsible for a higher sensitivity amongst women for healthy food recommendations (Grunert and Wills, 2007; Campos et al., 2011).
Specific education and food literacy
Food literacy is a broad concept, that should be separated into different domains (Vidgen and Gallegos, 2014; Cullen et al., 2015; Perry et al., 2017). The first encompasses specific knowledge of food and nutrition, such as the ability to assess the composition and quality of different products. The second focusses on food skills, including the ability to prepare and/or cook a food in many healthy ways, to know how to preserve it properly, to modify a recipe or to adapt it. The third domain is that of motivation and nutritional self-efficacy.
The European Commission recalls that “the knowledge of the basic principles of nutrition and adequate nutritional information on food would contribute significantly to enable consumers to make informed choices” (Reg. 2011/1169/CE, 2011). Poelman et al. (2018) are amongst the first authors who highlighted the coexistence of two dimensions of food literacy, focussing on the relevance of procedural skills along with declarative knowledge, already investigated in many studies (Worsley, 2002; Block et al., 2011; Cullen et al., 2015; Gréa Krause et al., 2018).
We tried to demonstrate the association of specific education in Human Nutritional Sciences with food literacy, and of food literacy with purchasing behaviour.
The improvement of people awareness about healthy behaviours passes through education (Benne, 2014; Spronk et al., 2014). In recent years, great attention has been drawn onto the concept of health literacy (Block et al., 2011). This concept can be adapted to eating habits with the name of food literacy. The food literate consumer is a person informed and active in the adoption of healthy eating behaviours (Block et al., 2011). We found that the specific education in human nutrition predicts higher scores in food literacy, measured through the two different questionnaires, the SFLQ and SPFL.
Two measures of food literacy
SFLQ and SPFL show the possible bimodal approach to food literacy. SFLQ provides information on the functional and interactive aspects of food literacy. It investigates the level of knowledge in the nutritional field, the ability to understand nutritional information, exchange it with family members and acquaintances, and assess its reliability. It also enables information to be gathered on the ability to assess the long-term impact of food habits. Instead, SPFL scale assesses the ability to prepare and process food. It provides information on the consumption of healthy snacks, and dietary style in general. It also investigates the use of food labels during the process of choice, the daily planning of meals, the composition of food expenditure and the nutritional quality of the food in the pantry. In addition, SPFL scale allows acquisition of information regarding impulsive behaviour, the influence of stress and/or mood on food choices, as well as the ability to resist the desire to consume unhealthy foods. Overall, this scale makes it possible to analyse the relationship between the level of self-perceived food literacy and the nutritional profile of food products routinely bought and consumed (Poelman et al., 2018).
Food literacy and decision-making
Food choices have been broadly studied in relation to socio-economic characteristics of consumers (e.g. Thiele et al., 2017) and to their visual attention (e.g. Van Loo et al., 2018). We intended to add knowledge about the contribution of food literacy and psychometric characteristics of consumers (i.e. chronotype and trust) to food choices. However, not all of the variables related to purchase behaviour in our survey were good predictors of food literacy. Some of them were associated with both SFLQ and SPFL, and some others were related to only one of the two scales.
Motivation and trust are two essential components for a healthy lifestyle recipe (Block et al., 2011; Perry et al., 2017). Trust can be influenced by the type of education achieved, but it can also depend on previous experiences (Alesina and La Ferrara, 2002). For instance, 78% of consumers say they feel reassured by the 100% Italian origin (Nielsen, 2018). On the other hand, Zurawicki (2010) explains that when consumers have a poor knowledge about the quality of a product, they go for the one with the highest price. In our sample, we did not find any significant association of trust with food literacy nor with chronotype.
Testing the predictive power of chronotype on food literacy, we showed that evening types reported lower scores to SPFL compared to intermediate and morning types. This result is in line with the literature, since evening chronotypes, especially if adolescents, are more prone to junk food consumption and to a phase delay in meal timing (Arora and Taheri, 2015). In general, the higher incidence of cardiovascular diseases in evening type might be partially attributable to poor eating habits (Almoosawi et al., 2019). This result could be interpreted according to the proposed association between evening chronotype and risk-taking behaviour, especially amongst adolescents (Touitou et al., 2016). Evening chronotypes usually tend to adopt irregular lifestyles, included irregular eating patterns, with negative consequences for their general health (Fabbian et al., 2016). The interface between lifestyle and circadian rhythms preferences, as expressed by the chronotype, is a promising perspective to manage the incidence of metabolic diseases (Bae et al., 2019).
Availability and body mass index
Overall, our results confirm that procedural and proactive components of food literacy are crucial to translate nutritional knowledge into good dietary practices (Hartmann et al., 2013; Poelman et al., 2018). For instance, it has been demonstrated a close relation between overweight and a low level of education (NCD Risk Factor Collaboration, 2019) (Wang and Lim, 2012). Consistently with the current literature, we found that BMI significantly predicts the final score of SPFL. Moreover, the importance attributed to the easy availability of food products during the decision-making process increases with the BMI value. The managerial implications are immediate. The space and visibility dedicated in stores to food products should be increased for healthier products and reduced for high-calorie products instead (Vaughan et al., 2017). Policymakers might benefit from this synergy with private companies, giving more incentives to the more virtuous environments.
Strength and limitations
We fully recognize the limited generalizability of our findings and the controversial reliability of self-report measures used in the survey. For instance, the lack of significant results with respect to trust should be further investigated, using a different tool to measure trust and on a larger scale. However, the novelty of our conceptual framework, and the easy implementation of objective measurements to support similar results in future research make us confident of the relevance of this study, and the importance of sharing our results with the scientific community. In addition, to the best of our knowledge, this study was the first to explore the influence of specific education in human nutrition on food literacy and on purchase behaviour in the Italian context. As well as it was the first study to investigate the association of food literacy with chronotype.
Recommendations and future lines of research
To overcome the limits of using only self-report measures, we advise future researchers to combine surveys with tools that objectively measure the engagement of consumers towards real food products. Amongst the possible techniques to apply, eye-tracking is a non-invasive and promising technique to explore gaze patterns of visual attention (Visschers et al., 2010; Antúnez et al., 2013; Stasi et al., 2018; Tórtora et al., 2018). The application of such devices requires a multidisciplinary and integrated approach (Bazzani et al., 2020). Social advertising campaigns can take advantage from this plurality of competences. For managers and policymakers the identification of elements that engage the attention of consumers (i.e. visual salient stimuli; Itti and Koch, 2001) is a starting point to develop logos and nutritional claims able to promote healthy eating habits.
These nudging strategies should support wider and well-structured educational interventions. Educational programmes to improve food literacy in the general population should be introduced especially in those places where food preparation and consumption also facilitate social interactions. School canteens should reasonably be the first target for intervention. Indeed, we have already pointed out how adolescents are at risk of developing unhealthy eating habits. The acquisition of procedural skills is the best guarantee to bring a good product from a shelf to the table.
This study steams from the idea that higher levels of food literacy might be associated to healthier food choices. Also, we hypothesized that a psychometric profiling of consumers might help understanding what kind of customers' features pair with food literacy, and whether some of the profiling variables might be directly related to food choices. We hence considered individual chronotype and trust levels along with traditional personal data such as sex, age, BMI and the level of general and specific (i.e. students in Human Nutritional Sciences) education. We first concluded that food literacy levels are associated only to some aspects of decision-making in food purchase, such as the attention attributed to both nutritional content and nutritional properties. Second, our findings show how chronotype, sex, BMI and education are associated to food literacy levels. Third, to close the loop, we demonstrated how a personal characteristic, i.e. the BMI, is linked to a crucial element in food purchase behaviour such as the importance attributed to the easy availability of a product. Taken together these results suggest how food industry and businesses should pay more attention to consumers' food literacy and personal characteristics, e.g. individual chronotype, when introducing new products and setting up the supply chain. Specifically, we focussed on the practical implications that our findings might bring in reshaping the educational initiatives aimed at promoting healthy lifestyles.
Conclusion
This study achieved two main goals. Firstly, results confirm our expectations about the association of food literacy with purchasing behaviour, pointing out the relationship between specific education in human nutrition and food choices. The propensity for healthier food choices emerged to be more typical of women and inversely correlated with the BMI and evening chronotypes, in line with the current literature. Secondly, this work provides useful insights for the development of profiling methods and food literacy evaluation to improve healthy lifestyles. An adequate analysis of food literacy domains might enable the design of more effective educational and prevention campaigns. Contexts where nutritional skills can be naturally acquired become as relevant as the promotional messages themselves. Schools, canteens, sport centres and work sites properly equipped to encourage a “nutritionally supportive” food culture might offer the opportunity to reduce the physical and psychological barriers to the accessibility to services and to the availability of healthy products.

