


The study aims to examine the food shopping and eating habits of young adults in Germany, as well as to uncover nutritional differences within the young generation via segmentation.
A nationwide, representative online survey of 1,555 consumers aged 16 to 29 within Germany was conducted. In order to determine the food shopping and eating habits, the food-related lifestyle (FRL) concept was used and supplemented with additional nutrition-related statements. Statistical analysis techniques included factor and cluster analysis. The sample of young adults was analyzed using cluster analysis, and five nutritional styles were identified.
The findings indicate that Generation Z (Gen Z) does not exist as a collective when it comes to food shopping and eating habits. This age group can be classified into five nutritional styles: modern traditionalists, meat lovers, uninvolved, open-minded and moderate. Each nutritional style has distinctive differences from the other nutritional styles in terms of ways of shopping, products, quality and price choices, handling of food, cooking methods and everyday nutrition. Nonetheless, there may also be resemblances with another nutritional style.
The study aims to identify and describe different nutritional styles among young adults in Germany. This insight is important for food marketers, as it can help them to align their marketing approaches and strategies with these nutritional styles. From this, practitioners can develop differentiated recommendations for food marketing and nutritional communication in order to better address the individual target groups of young consumers.
1. Introduction
In discussions about more sustainable nutrition, the young generation (Gen Z) is often viewed as having high potential for transformation. Gen Z refers to persons born between 1995/1996 and 2009/2010 (Statista Research Department, 2024). It is posited that this generation holds the potential to effect changes in consumer behavior, given their distinct behavior compared to previous generations (Priporas et al., 2017), their environmental consciousness, and their aspiration for a superior standard of living (Su et al., 2019; Albert et al., 2019). Particularly considering the backdrop of social crises and the need for transformation, studies focus on the young generation’s potential for change and creativity, as this is associated with hopes and expectations that the young generation will actively drive transformation. In studies, it is examined how teenagers and young adults, primarily those aged between 14 and 29, live and experience their values, how they perceive the current situation, which values they are guided by, and what life plans they pursue (Albert et al., 2019; BMUV, 2024; Broadbent et al., 2017; Calmbach et al., 2024; Zühlsdorf et al., 2021).
This can also be applied to sustainable nutrition. For example, Zühlsdorf et al. (2021) found that young adults were more open to a vegetarian and vegan diet than the average population in Germany. The results of a youth study published in the Meat Atlas 2021 also showed that giving up meat is a trend among teenagers and young adults (Benning, 2021). However, such statements have recently been questioned and suggest that food shopping and eating habits vary within the younger generation and that nutrition-specific differences can be identified (Rückert-John et al., 2024). Recent research shows that 14% of 14- to 29-year-olds are increasingly adopting a vegetarian and vegan diet, not least because of their desire for a climate-conscious nutrition (Benning, 2021), and that there are around twice as many vegetarians and vegans in this generation than there are in the German population as a whole (Benning, 2021; Rückert-John et al., 2024). On the other hand, they also make up the largest proportion of the German population (26%) who eat meat or sausage (several times) per day (BMEL, 2024). Since young adults are willing to pay a premium for healthier food (Su et al., 2019), it is possible to assume that they have market power in the consumer food market, especially in the future. Given the different statistics and statements, it is necessary to examine young adults more closely using market segmentation.
A well-known theory that used to segment people in the field of nutrition is that of the food-related lifestyle (FRL) (Grunert, 1993, 2006; Thøgersen, 2017). Lifestyle research in the fields of marketing and social sciences is primarily used for market segmentation, particularly in light of evolving lifestyles. It considers that people have different underlying values and that they have different opinions, practices, and behaviors when it comes to food (Aschemann-Witzel et al., 2021; Scholderer et al., 2004). It is important for food marketers to understand which potential approaches fit the nutritional style of their customers and to assess the extent to which these strategies or communications are accepted by the individual segments (Aschemann-Witzel, 2018).
While some research on consumer behavior and marketing refers to the generational cohort theory and compares cohorts with each other (Arenas-Gaitán et al., 2022; Kamenidou et al., 2020; Rungruangjit and Charoenpornpanichkul, 2024), other research refers to segmentation in food consumption within a cohort, especially within Gen Z (Chiciudean et al., 2024; Kamenidou et al., 2019; Kymäläinen et al., 2021; Su et al., 2019). As this young generation is considered to be one of the most ethnically diverse and individualistic generation (Singh and Dangmei, 2016) and that within a cohort the beliefs and behaviors are not always completely uniform (Arenas-Gaitán et al., 2022), it is important to examine the young cohort in more detail using segmentation in order to better understand their food shopping and eating habits and to target marketing strategies or public campaigns to corresponding segment groups of young consumers. As the above-mentioned publications show, the relevant literature on segmentation of young adults is still relatively new and limited. The present study therefore extends the existing research in the field of segmentation and FRL with regard to Gen Z, aiming to examine the food shopping and eating habits of young adults in Germany and to identify and describe nutritional differences among the young adults by means of segmentation. The following research questions were asked: What are the different nutritional styles prevalent among the young generation in Germany, and how do they look?
2. Conceptual background
2.1 Food-related lifestyle (FRL)
In consumer segmentation research for the food sector, the FRL model has been used for several years to explain consumer food-related behavior and to identify different FRL in food purchasing and consumption (Grunert, 2019; Brunsø and Grunert, 1998; Brunsø et al., 2004). Through this lifestyle segmentation, consumers can be categorized into relatively homogeneous groups (Plummer, 1974; Vyncke, 2002). In research, food consumers are segmented into two to six food-related groups (Wycherley et al., 2008; Jang et al., 2011; Liu and McCarthy, 2023). Five elements of the FRL are often distinguished: purchase motives, types of shopping, quality aspects, preparation methods, and consumption situation. It can be assumed that consumer segments differ in their shopping, cooking, and consumption habits (Brunsø et al., 2021). Studies on this should therefore be guided by the core dimensions of the FRL concept (Stancu et al., 2022), but they can be further adapted to take into account contextual factors (Nie and Zepeda, 2011).
The concept of FRL has been further developed and applied to a large number of countries around the world such as Australia, China, Denmark, Finland, France, Germany, Hungary, Italy, Norway, Poland, Spain, Sweden, the Netherlands, the United Kingdom as well as the United States (Arenas-Gaitán et al., 2022; Nijmeijer et al., 2004; Su et al., 2019; Verain et al., 2012) and in food research (Grunert et al., 2001, 2011; Nie and Zepeda, 2011; Thøgersen, 2017). There is extensive research into consumer lifestyles of food, such as the shopping of new, organic, or regional foods (Cullen and Kingston, 2009; Kumar and Smith, 2018; Nie and Zepeda, 2011; Van et al., 2019; Witzling and Shaw, 2019), meat consumption (Grunert, 2006), preference of a vegetarian diet (Hoek et al., 2004), use of green restaurants (Chiciudean et al., 2024), or food waste reduction (Aschemann-Witzel, 2018; Aschemann-Witzel et al., 2021; Jürgens, 2022, 2023). The research listed above has demonstrated that the FRL concept is a useful tool for consumer segmentation and can be used with adaptations in various settings related to food.
The FRL segmentation process is based on surveys in which segments or groups are identified by first reducing the data using factor analysis and then processing it in a cluster analysis based on the segments found in the data. The results of segmentation can vary in each market that is analyzed (Grunert, 2019), and each FRL can be affected by different variables (Anić et al., 2014). Important differences have been highlighted when categorizing consumers based on their socio-demographic characteristics (Chiciudean et al., 2024). Each generation can be distinguished by its distinct and shared values and behaviors. These common aspects within a generation give people the same perspective on how to interpret and interact with the world that surrounds them (Stevanin et al., 2018). Each generation can be identified with some main values, and these form the basis for their subsequent behavior (Arenas-Gaitán et al., 2022). It is important to note, however, that within each generation, the beliefs and behaviors of all members are not always completely uniform (Arenas-Gaitán et al., 2022). Another important aspect of generational behavior research is the investigation of value orientation and the identification of differences (Schewe and Noble, 2000). People’s values, experiences, and identities serve to determine segments of a generation and to distinguish one from another. In addition to strict age limits, it is important to consider that each generation can have varying group experiences.
2.2 The young generation
The young generation is said to have a high level of social awareness, technological knowledge, nutritional awareness, and an openness to more sustainable nutrition (Arenas-Gaitán et al., 2022; Broadbent et al., 2017; Chiciudean et al., 2024; Su et al., 2019; Hrubá and Sadílek, 2021; Krejbich et al., 2023; Nguyen et al., 2022; Schnettler et al., 2016; Thøgersen, 2017; Werking et al., 2021). Young consumers appreciate healthy foods and are willing to pay for them (Chen et al., 2024; Torres, 2020). As these young consumers transition into higher-paying jobs, their influence will increase on the food system.
Previous research on Gen Z as food consumers has successfully identified segments that differ in their aspects and dimensions. Two to four consumer groups were identified among Gen Z (Chiciudean et al., 2024; Hrubá and Sadílek, 2021; Kamenidou et al., 2019; Su et al., 2019). In these studies, one can often observe both a segment that is relatively interested in food and a segment that is not. The researchers then applied terms such as “conscious” or “involved” and “uninterested” or “indifferent”. The majority of these studies have in common that they examined university students (Hrubá and Sadílek, 2021; Kamenidou et al., 2019; Pocol et al., 2021; Robichaud and Yu, 2022; Su et al., 2019; Torres, 2020), whereas a representative sample of young adults from a country is lacking. Since the young generation represents a great potential for sustainable nutrition, it is important to analyze and understand this consumer segment based on a representative sample in order to obtain transferable statements. Furthermore, a differentiation in terms of nutritional styles could be relevant in identifying different food consumer groups within the young generation (Aschemann-Witzel, 2018; Vermeir and Verbeke, 2008).
3. Materials and methods
3.1 Data collection and the sample
The data base for this study is a nationwide representative online survey of 1,555 young adults aged 16 to 29. The representation was provided in terms of gender, education, and state. The data was collected in Germany between May 15 and June 5, 2024, via the consumer panel of the market research company Bilendi. Bilendi obtained the survey participants from its panel, managed the data collection, and provided anonymized data. Information regarding socio-demographic characteristics, ways of shopping, products, quality and price choices, food handling, cooking methods, and everyday nutrition was gathered. The sample profiles of the participants are shown in Table 1.
Sample profiles of the survey participants aged 16 to 29 (age mean = 23.03, n = 1,555)
| Description | Frequency | Percentage |
|---|---|---|
| Gender | ||
| Male | 750 | 48.2 |
| Female | 793 | 51.0 |
| Diverse | 12 | 0.8 |
| Education | ||
| Pupil | 217 | 14.0 |
| Lower secondary education | 196 | 12.6 |
| Secondary education (O-level) | 377 | 24.2 |
| Secondary education (A-level) | 494 | 31.8 |
| University degree | 255 | 16.4 |
| No school leaving certificate/no final qualification | 16 | 1.0 |
| Educational level | ||
| Low | 429 | 27.6 |
| Middle | 377 | 24.2 |
| High | 749 | 48.2 |
| State | ||
| Baden-Wuerttemberg | 228 | 14.7 |
| Bavaria | 257 | 16.5 |
| Berlin | 73 | 4.7 |
| Brandenburg | 33 | 2.1 |
| Bremen | 13 | 0.8 |
| Hamburg | 39 | 2.5 |
| Hesse | 125 | 8.0 |
| Mecklenburg-Western Pomerania | 23 | 1.5 |
| Lower Saxony | 154 | 9.9 |
| North Rhine-Westphalia | 350 | 22.5 |
| Rhineland-Palatinate | 77 | 5.0 |
| Saarland | 14 | 0.9 |
| Saxony | 58 | 3.7 |
| Saxony-Anhalt | 28 | 1.8 |
| Schleswig-Holstein | 53 | 3.4 |
| Thuringia | 30 | 1.9 |
| Employment | ||
| Worker (simple) | 254 | 16.3 |
| Skilled worker | 105 | 6.8 |
| Employee (simple) | 272 | 17.5 |
| Employee (middle-level) | 163 | 10.5 |
| Employee (qualified or managerial) | 174 | 11.2 |
| Civil servant (simple service) | 16 | 1.0 |
| Civil servant (middle service) | 34 | 2.2 |
| Civil servant (upper service) | 34 | 2.2 |
| Civil servant (higher service) | 14 | 0.9 |
| Self-employed farmer | 7 | 0.5 |
| Freelance professions | 38 | 2.4 |
| Self-employed without employees | 34 | 2.2 |
| Self-employed with employees | 20 | 1.3 |
| Never been employed | 390 | 25.1 |
| Monthly household income | ||
| Under 500 EUR | 46 | 3.0 |
| 500 to under 1,000 EUR | 92 | 5.9 |
| 1,000 to under 1,250 EUR | 102 | 6.6 |
| 1,250 to under 1,500 EUR | 88 | 5.7 |
| 1,500 to under 2,000 EUR | 118 | 7.6 |
| 2,000 to under 2,500 EUR | 150 | 9.6 |
| 2,500 to under 3,000 EUR | 160 | 10.3 |
| 3,000 to under 3,500 EUR | 142 | 9.1 |
| 3,500 to under 4,000 EUR | 155 | 10.0 |
| 4,000 to under 5,000 EUR | 166 | 10.7 |
| 5,000 to under 6,000 EUR | 80 | 5.1 |
| 6,000 and more | 71 | 4.6 |
| No information/don’t know | 185 | 11.9 |
| Household situation | ||
| Alone, without children | 378 | 24.3 |
| Alone, with children in the household | 44 | 2.8 |
| In a partnership, without children in the household | 286 | 18.4 |
| In a partnership, with child(ren) in the household | 201 | 12.9 |
| With parents | 545 | 30.5 |
| In a shared flat | 85 | 5.5 |
| Other | 16 | 1.0 |
| Living area population | ||
| Under 5,000 | 228 | 14.7 |
| 5,000 to under 20,000 | 263 | 16.9 |
| 20,000 to under 50,000 | 251 | 16.1 |
| 50,000 to under 100,000 | 208 | 13.4 |
| 100,000 to under 500,000 | 275 | 17.7 |
| 500,000 and more | 244 | 15.7 |
| No information/don’t know | 86 | 5.5 |
| How often they cook for themselves | ||
| Less than once a month/never | 69 | 4.4 |
| About one to three times a month | 131 | 8.4 |
| About one time a week | 187 | 12.0 |
| About two times a week | 330 | 21.2 |
| About three to four times a week | 431 | 27.7 |
| Every day or almost every day | 407 | 26.2 |
| Nutrition | ||
| I eat meat | 1,246 | 80.1 |
| I am vegetarian | 271 | 17.4 |
| I am vegan | 38 | 2.4 |
Source(s): Authors’ own work
3.2 Food-related lifestyle concept
The original questionnaire for measuring the FRL concept consisted of 69 questions with five subcategories for recording consumers’ cooking motives, quality aspects, consumption situations, shopping, and cooking methods (Grunert, 1993; Grunert et al., 1993, 2001; Brunsø et al., 2004). The concept has been successfully applied in various studies, including cross-national studies, and has been validated on various topics in the food sector (Aschemann-Witzel et al., 2021; Müller and Hamm, 2014; Stancu et al., 2022; Thøgersen, 2017). To determine the nutritional styles of young adults, 29 questions from Grunert et al. (1993) and Brunsø et al. (2021) FRL concepts were used, adapted, and supplemented with further statements on the basis of previous research (Aschemann-Witzel et al., 2021; Jürgens, 2022, 2023; Müller and Hamm, 2014; Stieß and Hayn, 2005). Prior to conducting the survey, the questionnaire was pretested with three research assistants. As the FRL concept was modified by previous literature and a pretest, both face and content validity are good. The final questionnaire contained 91 questions with six categories covering the FRL dimensions and further nutritional aspects (1) ways of shopping, (2) products, quality, and price choices, (3) handling of food, (4) cooking methods, (5) everyday nutrition, and (6) meal options. For the six categories, responses were measured on a 5-point Likert scale ranging from “not at all true” to “completely true” or “do not agree at all” to “agree completely”. Table 2 lists the questions that were used in the factor analysis.
Questions included in the factor analysis
| Sub-scales | Code | Statement included in the factor analysis |
|---|---|---|
| Ways of shopping | Q2r3 | I regularly shop in organic supermarkets (e.g. Alnatury, Denn’s). Developed |
| Q2r6 | I shop at the grocery store closest to my home. Developed inspired by Jürgens (2023) | |
| Q2r9 | I want to be able to easily reach the grocery store on foot. Jürgens (2023) | |
| Q2r10 | I want to be able to easily reach the grocery store by bike. Jürgens (2023) | |
| Q2r11 | I also use other grocery shopping options such as online grocery shopping. Developed inspired by Jürgens (2023) | |
| Q2r12 | I also use other grocery shopping options such as farm or farmer’s shop. Developed inspired by Jürgens (2023) | |
| Q2r13 | I also use other grocery shopping options such as a weekly market. Developed inspired by Jürgens (2023) | |
| Product, quality and price choices | Q3r1 | I compare labels to choose environmentally friendly foods. Developed inspired by Grunert (1993) |
| Q3r3 | The appearance of fruit and vegetables is important for my purchasing decision. Developed inspired by Aschemann-Witzel et al. (2021) | |
| Q3r4 | I try to buy organic food whenever possible. Grunert (1993), Brunsø et al. (2021), Stancu et al. (2022) | |
| Q3r5 | I try to choose foods that have as little impact on the environment as possible. Brunsø et al. (2021), Stancu et al. (2022) | |
| Q3r6 | I try to choose food that is produced sustainably. Brunsø et al. (2021), Stancu et al. (2022) | |
| Q3r8 | I always try to get the best quality at the best price. Grunert (1993) | |
| Q3r9 | When buying groceries, the price is the most important thing for me. Jürgens (2023) | |
| Q3r10 | When shopping for groceries, I always look for good deals. Developed | |
| Q3r12 | I am willing to pay a higher price for organically produced food. Developed inspired by Grunert (1993) | |
| Q3r13 | I often buy food close to the best-before date, if it is offered at a lower price. Aschemann-Witzel et al. (2021) | |
| Q3r14 | It is important to me that the food I buy is environmentally friendly. Developed inspired by Brunsø et al. (2021), Aschemann-Witzel et al. (2021) | |
| Q3r15 | I make sure to buy food from my region. Müller and Hamm (2014) | |
| Q3r16 | I try to avoid single-use plastic when buying groceries. Developed | |
| Q3r17 | Fresh food is important to me. Developed inspired by Grunert (1993), Jürgens (2023) | |
| Q3r18 | Organically produced food is important to me. Jürgens (2023) | |
| Q3r20 | When shopping, I consciously choose food with a long shelf life. Jürgens (2023) | |
| Handling of food | Q4r1 | If I do not finish my meal in the restaurant, I have it packed up to take away. Developed inspired by Jürgens (2023) |
| Q4r2 | I feel guilty when I throw food away. Aschemann-Witzel et al. (2021) | |
| Q4r4 | If there is food left over, I eat it later. Developed inspired by Jürgens (2023) | |
| Q4r7 | I usually think about what I want to buy before I go shopping. Developed inspired by Grunert (1993) | |
| Q4r8 | I make a shopping list before I go grocery shopping. Developed inspired by Grunert (1993) | |
| Q4r9 | I plan my meals a few days in advance so I can shop more carefully. Developed inspired by Grunert (1993) | |
| Q4r11 | When I was a child, food waste was an important topic in the family. Jürgens (2023) | |
| Q4r12 | I like to always have plenty of food at home. Jürgens (2023) | |
| Q4r13 | In my home everything is always eaten up. Aschemann-Witzel et al. (2021), Jürgens (2023) | |
| Cooking methods | Q6r1 | I like to try out recipes from different countries. Grunert (1993), Stancu et al. (2022) |
| Q6r2 | Recipes and articles about dishes from other cultures inspire me to experiment in the kitchen. Grunert (1993), Stancu et al. (2022) | |
| Q6r3 | I like to try out new recipes. Grunert (1993), Stancu et al. (2022) | |
| Q6r5 | I look for ways to prepare unusual dishes. Grunert (1993), Stancu et al. (2022) | |
| Q6r6 | I use a lot of ready-to-eat foods. Developed inspired by Grunert et al. (1993) | |
| Q6r7 | At home, I tend to eat quick meals rather than elaborately prepared dishes. Developed inspired by Grunert et al (1993) | |
| Q6r8 | Frozen foods make up a large portion of the food I use at home. Grunert et al. (1993) | |
| Q6r9 | I take plenty of time for cooking. Grunert (1993), Müller and Hamm (2014), Aschemann-Witzel et al. (2021) | |
| Q6r12 | I like to try new foods that I’ve never eaten before. Developed inspired by Grunert et al. (1993), Brunsø et al. (2021) | |
| Everyday nutrition | Q7r1 | Eating organically produced food has a positive impact on the environment. Developed |
| Q7r2 | I believe that sustainable food helps to protect nature and its resources. Developed | |
| Q7r6 | I eat a lot of home-grown food. Developed | |
| Q7r7 | It is important to me that the ingredients in my food are organically produced. Developed | |
| Q7r9 | It is important to understand the impact of our eating habits on the environment. Brunsø et al. (2021), Stancu et al. (2022) | |
| Q7r10 | I see little chance for me to achieve anything in life. Developed | |
| Q7r13 | For me, meat is part of a good meal. Developed | |
| Q7r14 | I often get very involved in social or environmental issues. Developed | |
| Q7r17 | Nobody in my circle of friends and acquaintances thinks about an environmentally conscious diet. Developed | |
| Q7r18 | Food should be produced in such a way that it is as cheap as possible. Developed | |
| Q7r21 | I do not know how to replace meat in my diet. Developed | |
| Q7r22 | For reasons of sustainability, everyone should eat less meat. Developed | |
| Q7r23 | Everyone has the right to eat as much meat as they want. Developed | |
| Q7r24 | I follow media reports on the subject of nutrition. Jürgens (2023) | |
| Meal options | Q8r1 | Eat breakfast at home. Brunsø et al. (2021) |
| Q8r2 | Eat breakfast outside of home. Developed inspired by Brunsø et al. (2021) | |
| Q8r3 | Eat lunch at home. Brunsø et al. (2021) | |
| Q8r4 | eat lunch at the workplace (e.g. in the canteen/canteen). Developed inspired by Brunsø et al. (2021) | |
| Q8r5 | Eat food taken from home for lunch. Developed inspired by Brunsø et al. (2021) | |
| Q8r6 | Eat lunch outside the home and not at work (e.g. restaurant, snack bar). Developed inspired by Brunsø et al. (2021) | |
| Q8r7 | Eat dinner at home. Brunsø et al. (2021) | |
| Q8r8 | Eat dinner outside of home. Developed inspired by Brunsø et al. (2021) |
Source(s): Authors’ own work
3.3 Analysis
The analysis was carried out using SPSS (Version 29.0.1.0). For each subscale, exploratory factor analysis (EFA) was conducted using principal component analysis with varimax rotation (Aschemann-Witzel et al., 2021; Huang et al., 2015). Initially, the factor loadings of each subscale were examined. We evaluated whether the data was suitable for factor analysis using a Kaiser-Meyer-Olkin (KMO) test and a Bartlett’s Test of Sphericity. In order to conduct a factor analysis, it is necessary that the KMO value exceeds 0.5 and for a middling analysis, it should be greater than 0.7 (Backhaus et al., 2023; Kaiser and Rice, 1974). According to the results of the EFA (see Table 3), the KMOs are all above 0.7 and can be considered to be fairly good (Kaiser and Rice, 1974). All results from the Bartlett’s Test of Sphericity are significant at 0.001. Therefore, it can be assumed with a practical error probability of 0.001 that the correlation matrix deviates from an identity matrix and is therefore suitable for factor analysis. Additionally, the result of Bartlett’s Test of Sphericity is significant, which means factor analysis is workable.
KMO and Bartlett’s test of sphericity for the sub-scales
| Sub-scales | KMO | Approx. chi-square | df | Sig | Cronbach’s alpha |
|---|---|---|---|---|---|
| Ways of shopping | 0.765 | 3074.729 | 21 | <0.001* | 0.733 |
| Product, quality and price choices | 0.914 | 9567.115 | 120 | <0.001* | 0.850 |
| Handling of food | 0.806 | 2616.803 | 36 | <0.001* | 0.742 |
| Cooking methods | 0.819 | 4035.720 | 36 | <0.001* | 0.733 |
| Everyday nutrition | 0.813 | 5525.185 | 91 | <0.001* | 0.676 |
| Meal options | 0.766 | 2206.840 | 28 | <0.001* | 0.488 |
Note(s): *p < 0.001
Source(s): Authors’ own work
Several factors were extracted and inspected in each EFA. Items were kept when they were loaded with at least 0.5 on the expected factor so that the convergent and discriminant validity are good. Factors were retained when they contained at least three items and had a Cronbach’s α of at least 0.6, indicating that they were sufficiently reliable (Huang et al., 2015; Kaiser, 1974). Hence, the sub-scale meal option was eliminated as it failed to meet the Cronbach’s α of at least 0.6 (0.488). Lastly, the sub-scales were named according to their items. At the end, 55 variables remained. These factors reflected five aspects of food shopping and eating habits, and contained a total of 14 factors obtained from the principal component analysis with varimax rotation (see Table 4).
Factors of exploratory factor analysis
| Factor | Code | Loading | Eigen-value | Percentage of variance | Cumulative percentage of variance | Cronbach’s alpha |
|---|---|---|---|---|---|---|
| Ways of shopping | 0.733 | |||||
| Shopping options | Q2r3 | 0.800 | 2.834 | 40.484 | 40.484 | 0.824 |
| Q2r11 | 0.738 | |||||
| Q2r12 | 0.835 | |||||
| Q2r13 | 0.841 | |||||
| Accessibility of shopping | Q2r6 | 0.722 | 1.588 | 22.682 | 63.167 | 0.623 |
| Q2r9 | 0.842 | |||||
| Q2r10 | 0.681 | |||||
| Product, quality and price choices | 0.850 | |||||
| Environment-friendly food | Q3r1 | 0.752 | 5.725 | 35.779 | 35.779 | 0.913 |
| Q3r4 | 0.748 | |||||
| Q3r5 | 0.810 | |||||
| Q3r6 | 0.798 | |||||
| Q3r12 | 0.729 | |||||
| Q3r14 | 0.811 | |||||
| Q3r15 | 0.719 | |||||
| Q3r16 | 0.677 | |||||
| Q3r18 | 0.780 | |||||
| Quality (nature) of food | Q3r3 | 0.757 | 2.116 | 13.224 | 49.003 | 0.572 |
| Q3r8 | 0.685 | |||||
| Q3r17 | 0.657 | |||||
| Q3r20 | 0.409 | |||||
| Price of food | Q3r9 | 0.748 | 1.231 | 7.691 | 56.694 | 0.550 |
| Q3r10 | 0.769 | |||||
| Q3r13 | 0.621 | |||||
| Handling of food | 0.742 | |||||
| Waste of food | Q4r1 | 0.757 | 3.062 | 34.027 | 34.027 | 0.696 |
| Q4r2 | 0.709 | |||||
| Q4r4 | 0.787 | |||||
| Planning of food | Q4r7 | 0.696 | 1.181 | 13.124 | 47.150 | 0.688 |
| Q4r8 | 0.793 | |||||
| Q4r9 | 0.782 | |||||
| Relevance of food | Q4r11 | 0.784 | 1.031 | 11.459 | 58.610 | 0.454 |
| Q4r12 | 0.668 | |||||
| Q4r13 | 0.504 | |||||
| Cooking methods | 0.733 | |||||
| Experimentation in cooking | Q6r1 | 0.793 | 3.323 | 36.925 | 36.925 | 0.835 |
| Q6r2 | 0.814 | |||||
| Q6r3 | 0.755 | |||||
| Q6r5 | 0.721 | |||||
| Q6r9 | 0.655 | |||||
| Q6r12 | 0.698 | |||||
| Convenience food | Q6r6 | 0.801 | 1.928 | 21.417 | 58.342 | 0.700 |
| Q6r7 | 0.762 | |||||
| Q6r8 | 0.794 | |||||
| Everyday nutrition | 0.676 | |||||
| Environmental impact of nutrition and food | Q7r1 | 0.808 | 3.259 | 23.280 | 23.280 | 0.744 |
| Q7r2 | 0.833 | |||||
| Q7r9 | 0.705 | |||||
| Conscious nutrition | Q7r6 | 0.724 | 2.895 | 20.675 | 43.955 | 0.710 |
| Q7r7 | 0.664 | |||||
| Q7r14 | 0.706 | |||||
| Q7r24 | 0.707 | |||||
| Dealing with nutrition | Q7r10 | 0.723 | 1.295 | 9.252 | 53.207 | 0.683 |
| Q7r17 | 0.755 | |||||
| Q7r18 | 0.672 | |||||
| Q7r21 | 0.619 | |||||
| Awareness of meat | Q7r13 | 0.710 | 1.012 | 7.232 | 60.439 | 0.638 |
| Q7r22 | 0.638 | |||||
| Q7r23 | 0.792 |
Source(s): Authors’ own work
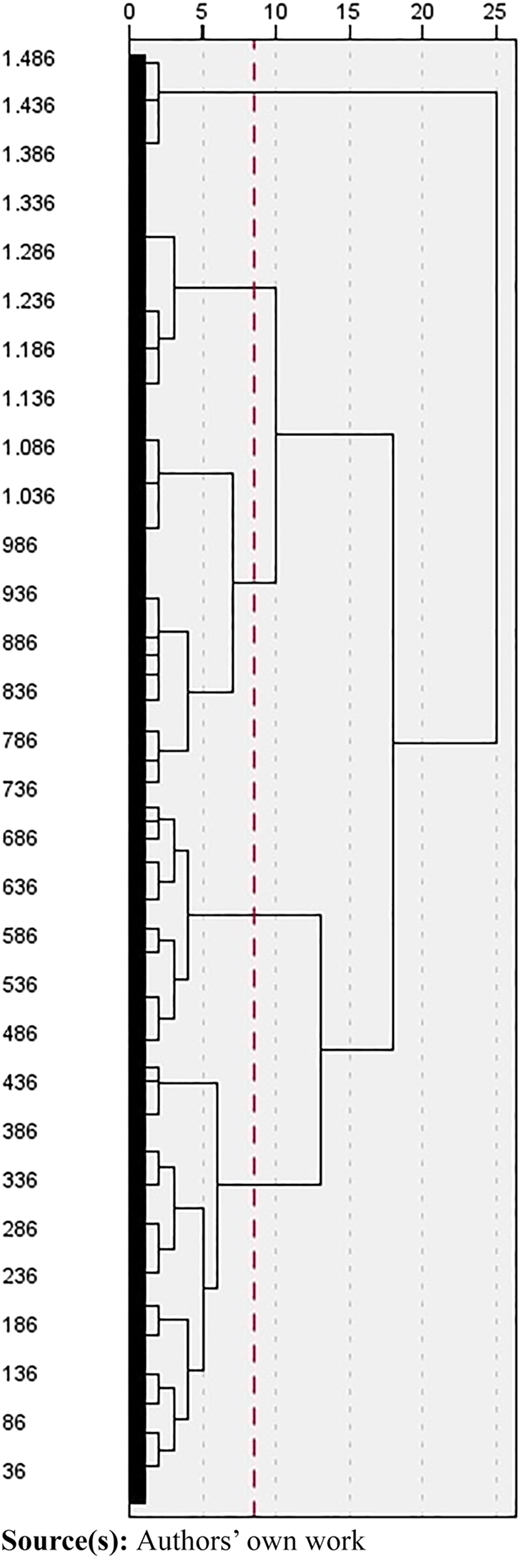
To determine the appropriate number of clusters, a two-step cluster analysis was performed (Punj and Stewart, 1983). Beforehand, a hierarchical cluster analysis (Ward method) of all factors from five to ten percent of the total sample was conducted. The agglomeration schedule and dendrogram were examined, and it was determined that a five-cluster solution would be the most appropriate (see Figure 1). To obtain the final cluster results, a K-means cluster analysis was conducted with five clusters. See Table 5 for results of cluster analysis.
Results of cluster analysis
| Modern traditionalists | Meat lovers | Uninvolved | Open-minded | Moderate | |||
|---|---|---|---|---|---|---|---|
| n = 421 | n = 366 | n = 147 | n = 243 | n = 309 | |||
| Cluster factors | 28.3% | 24.6% | 9.9% | 16.4% | 20.8% | F-value | p-value |
| Ways of shopping | |||||||
| Shopping options | −0.260 | −0.850 | −0.134 | 1.275 | 0.532 | 399.757 | 0.000* |
| Accessibility of shopping | 0.195 | 0.063 | −0.859 | 0.551 | −0.373 | 72.111 | 0.000* |
| Product, quality and price choices | |||||||
| Environment-friendly food | 0.553 | −1.010 | −0.661 | 0.949 | 0.127 | 438.187 | 0.000* |
| Quality (nature) of food | 0.231 | 0.418 | −1.279 | 0.449 | −0.527 | 171.200 | 0.000* |
| Price of food | −0.164 | 0.245 | −0.664 | 0.576 | −0.212 | 54.551 | 0.000* |
| Handling of food | |||||||
| Waste of food | 0.702 | 0.308 | −1.318 | 0.040 | −0.729 | 306.434 | 0.000* |
| Planning of food | 0.255 | −0.010 | −0.504 | 0.430 | −0.336 | 40.973 | 0.000* |
| Relevance of food | −0.052 | −0.256 | −0.865 | 0.953 | 0.051 | 118.048 | 0.000* |
| Cooking methods | |||||||
| Experimentation in cooking | 0.303 | −0.404 | −0.897 | 0.826 | −0.158 | 132.080 | 0.000* |
| Convenience food | −0.730 | 0.080 | −0.354 | 1.043 | 0.249 | 204.826 | 0.000* |
| Everyday nutrition | |||||||
| Environmental impact of nutrition and food | 0.606 | −0.124 | −1.298 | 0.610 | −0.520 | 243.655 | 0.000* |
| Conscious nutrition | 0.088 | −0.952 | −0.074 | 1.019 | 0.398 | 285.618 | 0.000* |
| Dealing with nutrition | −0.836 | 0.087 | −0.160 | 1.005 | 0.312 | 231.416 | 0.000* |
| Awareness of meat | −0.444 | 0.484 | −0.431 | 0.363 | −0.077 | 68.029 | 0.000* |
Note(s): *p < 0.001
Source(s): Authors’ own work
4. Results
We obtained initial results from a total of 1,555 participants, but we excluded data from 69 individuals because our objective was to include individuals who regularly cook (at least one to three times per month). In the final sample, 1,486 participants were included. Below is an overview of the nutritional styles obtained. We discuss each nutritional style and show where they differ from one another or where they have similarities. The results indicate that Gen Z does not exist as a collective and that this age group can be characterized by five different nutritional styles.
4.1 Modern traditionalists (28.3%)
Modern traditionalists are interested in their food shopping and eating habits. Food is purchased at the nearest grocery store (66.1%), which should be easily accessible on foot (72.2%). When food shopping, labels are compared in order to choose environmentally friendly foods (59.6%). Modern traditionalists try to buy organic (69.6%), sustainable (75.0%), or regional foods whenever possible (61.7%). They are willing to pay a higher price for organically produced foods (62.7%). Although they always strive to obtain the best quality at the best price (88.1%), price is not the most important purchase criterion when buying food (23.5%), but the freshness of the food (93.0%). Modern traditionalists think about what they want to buy (90.2%) and make a shopping list (80.7%) before grocery shopping.
Of all styles, modern traditionalists cook for themselves the most. A hot meal is prepared on a daily or almost daily base (81.9%). When it comes to cooking, modern traditionalists tend to experiment with recipes from other countries (77.2%). Articles about dishes from other cultures encourage them to experiment in the kitchen (74.1%). Ready-to-eat meals are not used much (53.5%). Frozen foods do not make up a large proportion of the food used at home (67.0%).
Modern traditionalists believe that sustainable nutrition is beneficial to nature and its resources (92.6%). It is important for them to understand the impact of their eating habits on the environment (87.2%). They understand how to replace meat in their diet (78.6%). In contrast to the other segments, only 63.4% of individuals consume meat, whereas 30.9% are vegetarians, and 5.7% are vegans. Among all styles, modern traditionalists are those who pay the most attention to a balanced diet with meat and plant-based foods (87.7%) and to the origin of the meat they eat (80.2%).
Meat is not prepared very often, i.e. this nutritional style has the lowest number of meat preparations over all styles, even if they like to eat meat (74.5%). For modern traditionalists, meat is not part of a good meal (63.4%), and they believe that less meat should be eaten for reasons of sustainability (76.5%).
Modern traditionalists are mostly female (61.5%) and have the highest number of diverse individuals (2.1%). The majority of modern traditionalists hold an A-level (35.2%), an O-level (22.3%), or a university degree (18.3%). The modern traditionalists are the second largest nutritional style, with people with higher educational qualifications (53.4%). Most people in this segment live with their parents (39.0%), in a partnership without children (22.8%), or alone without children (20.4%). 30.9% have never worked before, 16.6% are simple employees, followed by qualified or managerial employees (14.0%). 2.9% of individuals are self-employed. This cluster has the fewest foreigners represented (19.3%).
4.2 Meat lovers (24.6%)
Meat lovers are less interested in food shopping and eating habits. They do not shop at organic supermarkets (94.2%) – the highest proportion of all nutritional styles. Additionally, they also do not use other shopping options such as farm shops (85.0%), weekly markets (83.9%), or online grocery stores (84.7%) – the highest proportion of non-users of all styles. Food is bought close to home (68.5%), and they want to be able to get to the grocery store easily on foot (65.6%).
Sustainable food is not important to meat lovers (47.0%), and they would not spend more money on it (54.6%). For meat lovers, fresh food (77.0%) and the appearance of fruit and vegetables (86.6%) are important when shopping. They pay attention to food prices (74.6%) and look for good deals (82.3%), but they do not compare labels to choose environmentally friendly food (65.6%). Meat lovers make a shopping list before grocery shopping (67.2%) and think about what they want to buy before grocery shopping (83.0%).
After the modern traditionalists and the open-minded, the meat lovers are the group who cook their own meals about three to four times a week (53.0%). A hot meal is prepared every day or almost every day (76.8%). Ready-to-eat (45.7%) and quick-to-prepare meals (51.6%) are used. Meat lovers are those who, across all segments, prepare the most meat during the week and enjoy eating meat (87.7%). Across all nutritional styles, they also have the highest proportion of meat eaters (92.5%). Meat lovers are not interested in eating less meat in the future (48.3%). For them, meat is a good part of a meal (55.5%). However, they believe that sustainable food contributes to protecting nature and its resources (62.8%). They do not follow media reports on the subject of nutrition (57.3%).
Females (60.9%) are more frequently represented among meat lovers than males (38.8%). Most people in this segment have an O-level (32.8%), followed by an A-level (27.0%), or are pupils (16.7%). Overall, the level of education is evenly distributed across all three educational qualifications, from low (31.1%) to medium (32.8%) to high (36.1%). Meat lovers have never been employed (28.1%), are simple workers (18.6%), or simple employees (18.0%). Most people in this segment still live with their parents (37.4%), alone without children (20.5%), or in a partnership without children (20.2%). Meat lovers tend to live in small or medium-sized cities (52.5% in cities with fewer than 50,000 inhabitants). Overall, this group has the largest proportion of people whose parents are foreigners (20.5%).
4.3 Uninvolved (9.9%)
The uninvolved are not at all interested in food shopping and eating habits. All factor loadings in this cluster are negative. Food shopping is not a significant part of their lives. They are undecided about the proximity and accessibility of the grocery store. All of the following categories were rated by the uninvolved as undecided, and therefore only slight tendencies can be derived from them.
Organic food is not very important to the uninvolved (46.3%), and they would not spend more money on it (41.5%). When shopping, they tend not to compare labels in order to choose environmentally friendly food (47.6%).
When it comes to cooking for themselves, there exist contradictions within this particular segment. 39.4% stated that they cook more than three to four times a week, while the other group stated they only cook once a week or less (37.4%). This cluster has the second largest proportion of vegetarians among all clusters (21.8%), while 76.2% are meat eaters, and 2.0% are vegans.
The gender distribution of the uninvolved is almost equal (48.3% males and 51.7% females). The majority of people in this segment have an O-level (32.7%), followed by an A-level (27.9%), and a lower secondary education (17.0%). The education level is equally distributed across all three educational levels, from low (30.6%) to medium (32.7%) to high (36.7%). The uninvolved work as simple workers (22.4%) or as simple employees (19.7%), whereas 21.1% have never worked before. They live alone, without children (29.3%), with their parents (26.5%), or in a partnership without children (22.4%). This cluster tends to live in medium-sized cities (cities with 20,000 to 500,000 inhabitants). They are either foreigners (20.4%) or their parents are foreigners (20.4%).
4.4 Open-minded (16.4%)
Open-minded are interested in all aspects of food shopping and eating habits. All factor loadings in this segment are positive. When shopping, organic supermarkets (67.1%), online grocery shops (76.1%), farm shops (74.9%), or weekly markets (77.4%) are used. These represent the highest proportions among all clusters. Shopping takes place in the grocery store closest to their home (83.1%). Grocery stores ought to be easily accessible on foot (87.6%) or by bike (87.7%).
Labels are compared in the grocery store to select food that is environmentally friendly (83.9%). The open-minded try to buy organic (84.3%), sustainable (83.5%), or regional food (84.0%) wherever possible. They are willing to pay a higher price for it (79.0%). They always try to find the best quality at the best price (91.8%). Price is the most important purchase criterion when buying food (84.4%), followed by freshness (87.7%) and appearance (85.6%). The open-minded think about what they want to buy before shopping (86.0%) and make a shopping list (85.6%).
Open-minded cook more than three times per week (67.9%). They often try recipes from other countries (82.7%), try new recipes (83.5%), and experiment in the kitchen (82.7%). Open-minded look for ways to prepare unusual dishes (86.8%), like to try new foods (82.3%), and take a lot of time when cooking (77.8%). However, they rely on a lot of ready-to-eat meals (81.9%) and frozen foods (75.7%). Meat is prepared twice (29.2%) or three to four times a week (27.6%). 80.5% enjoy eating meat, while 66.4% want to eat less meat in the future and pay attention to the origin of the meat (76.1%).
The open-minded have the highest proportion of all segments when it comes to believing that eating organic food has a positive impact on the environment (86.0%). They believe that sustainable food helps to protect nature and its resources (83.9%) and that it is important to understand the impact of eating habits on the environment (85.6%). They follow media reports on the topic of nutrition (82.3%).
There are more males in this cluster (67.9%) than females (31.7%). 84.4% of those who are open-minded are meat eaters, 12.8% are vegetarians, and 2.9% are vegans. Over all clusters, this cluster has the highest level of education (65.4%); 32.9% have an A-level or a university degree (32.5%). 20.2% are simple employees (20.2%), simple workers (16.9%), or qualified or managerial employees (15.2%). 5.8% are civil servants in the lower service, and 4.5% are self-employed without employees. The open-minded make up the highest proportion of civil servants in the lower service, self-employed farmers, and self-employed across all clusters. The open-minded are among the highest earners across all clusters, work full-time, and have the largest proportion of foreigners (45.2%). They mostly live in large cities with over 100,000 inhabitants (50.2%).
4.5 Moderate (20.8%)
Moderates are interested in the different food shopping options, while the accessibility of shopping has a negative factor. Here, the group is undecided. Moderates are willing to pay a higher price for organically produced food (46.0%) and try to choose sustainably produced food (47.9%). Some moderates ensure that their food is environmentally friendly (47.4%) or comes from the region (38.8%), while others are undecided on these points (41.7 and 37.5%, respectively). The appearance of fruit and vegetables is important for purchasing decisions (55.7%). 54.1% always look for good deals. 35.0% are undecided here.
When it comes to cooking, the moderates are more likely to try out recipes from different countries (49.2%), including new recipes (51.5%). They cook less often (57.9%), i.e. about twice a week. Meat is prepared twice a week (29.1%). Moderates also like to eat meat (72.7%) but want to eat less meat in the future (36.2%) or are not sure (35.4%). For them, meat is an essential part of a good meal (51.8%).
Males (60.2%) are more frequently represented among the moderates than females are (39.5%). 84.1% are meat eaters, 14.9% are vegetarians, and 1.0% are vegans. Most people have an A-Level (35.9%), an O-Level (19.4%), or a lower secondary education (16.8%). The moderates usually live alone without children (33.3%) or with their parents (31.7%). 19.7% have never worked, 16.5% are simple workers, or simple employees (16.5%). 3.2% are self-employed with employees. The moderates have the second highest proportion of foreigners (23.6%) across all clusters. The majority of the moderates live in large cities with fewer than 500,000 inhabitants.
5. Discussion
A cluster analysis was conducted and five nutritional styles were obtained: modern traditionalists (28.3%), meat lovers (24.6%), uninvolved (9.9%), open-minded (16.4%), and moderate (20.8%). The results of the cluster analysis support previous findings on consumer segments that either show interest and engagement in eating styles or the opposite in the form of disinterest or disengagement (Aschemann-Witzel, 2018; Aschemann-Witzel et al., 2021; Delley and Brunner, 2017; Grunert et al., 2011; Hrubá and Sadílek, 2021; Huang et al., 2015; Kamenidou et al., 2019; Nie and Zepeda, 2011; Ryan et al., 2004). What is novel in this study is that we have discovered, through a representative sample, that there exist different nutritional styles among young adults. Each nutritional style is described in detail and the differences between them are highlighted. From this, food marketing players can determine the appropriate food marketing strategies for the respective nutritional style of this generation.
According to the results of the cluster analysis, the open-minded are very interested in food shopping and eating habits. They are willing to pay a premium for organic food and hold the belief that consuming organic food has a beneficial effect on the environment. They would like to reduce their intake of meat in the future. The open-minded are very interested in nutrition and follow media reports on this topic.
In contrast, meat lovers are not interested in sustainable food, nor would they spend more money on it. They consider meat to be an integral component of a satisfying meal, and they have no intention of reducing their intake in the future. These results are contrary to the conclusions of Su et al. (2019), which state that it is evident that US Gen Z consumers are increasingly concerned about the environment. Apparently, there is a group within Gen Z for which this is not as important as some researchers expected (Chiciudean et al., 2024; Su et al., 2019). This issue needs to be investigated further in the future.
Modern traditionalists are interested in food shopping and eating habits. Among all segments, it is this segment that frequently prepares meals for themselves. They try to buy foods that are organic, sustainable, or regional. Modern traditionalists are willing to pay a higher price for sustainable nutrition.
The uninvolved are not at all interested in food shopping or eating habits. The majority of the categories were rated as undecided. This result contradicts previous findings, which emphasize that Gen Z in Germany eats especially sustainably or is open to sustainable nutrition (Zühlsdorf et al., 2021; BMEL, 2024).
The moderates are interested in different food shopping options, but they cook less frequently. Moderates are willing to pay a higher price for organically produced food and try to choose them when shopping.
5.1 Practical implications
Our findings suggest that the different nutritional styles of the young generation in Germany influence food shopping and eating habits. Accordingly, the study enables an identification and description of different nutritional styles of young adults in Germany. This insight is crucial for food marketing players as it enables them to align their marketing approaches and strategies with these nutritional styles. It is therefore possible for practitioners to develop differentiated recommendations for food marketing and nutritional communication in order to better address the individual target groups of young consumers.
When addressing nutritionally active consumers, such as open-minded and modern traditionalists, grocery retailers have the ability to target them more precisely with sustainable, organic, or regional food attributes. These groups have a higher price range. For meat lovers, targeted food marketing, particularly for meat and all foods associated, seems to be promising. The interest in premium-segment food should be aroused among moderates, who enjoy food shopping and have the financial means to do so.
5.2 Limitations
This study focused on young adults in Germany. Therefore, it is difficult to draw comprehensive conclusions from this. However, it is assumed that the results of this study and the segmentation of the young generation can also be transferred to similarly developed food markets such as Austria, France, the Netherlands, or Great Britain. Future studies could explore this further. The survey of food shopping and eating habits could have led to the effect of social desirability and would need to be validated in future studies. Longitudinal studies could contribute to the reduction of one-off responses.
6. Conclusions
Based on the established FRL concept, we identified with a representative sample five nutritional styles within the young generation in Germany and characterized them in terms of ways of shopping, products, quality and price choices, handling of food, cooking methods, and everyday nutrition. Based on the FRL and within-cohort segmentation, we conclude that the identified segmentations indicate significant differences in the food shopping and eating habits of young adults. It is therefore possible to identify and describe the nutritional styles of the young generation. Gen Z cannot be considered as a collective, as there are considerable differences in their nutritional styles.
We are very grateful to our colleagues for pre-testing the questionnaire and providing valuable statistical feedback.

