


We investigate the unique consumer segment of “foodies” in the United States of America, examining how their demographic characteristics, spending behavior and cultural attitudes toward food differ from non-foodies. By analyzing these distinctions, the research aims to highlight foodies' influence on market trends, public health, and sustainable food practices, offering insights for targeted agri-food marketing and policy interventions that can leverage foodie culture to influence food choices.
The study explores data from a nationwide survey of 1,117 USA consumers to identify demographic and expenditure characteristics of self-identified foodies. Exploratory factor analysis (EFA) identifies underlying factors influencing foodie culture. Engel curve estimations reveal differences in income elasticity of food spending between foodies and non-foodies, controlling for demographics. This approach highlights how foodie culture impacts consumer behavior, providing insights relevant to the agri-food marketing literature.
USA foodies tend to be younger, more educated and have higher incomes than non-foodies, spending a larger share of their income on food, especially on meals outside the home. Engel curves show that foodies maintain a higher food expenditure share across income levels, with differences diminishing as income rises. Factor analysis indicates foodies view food as a passion and identity, contrasting with non-foodies’ utilitarian approach. These insights highlight foodies as market influencers who drive trends in food spending, health-conscious choices and sustainable consumption practices, with implications for public health and marketing strategies.
Unlike prior studies, this study empirically examines foodies as a distinct consumer segment in a nationally representative sample. These findings provide insights for marketers and policymakers as they develop targeted strategies that leverage foodies' influence on the broader food economy.
Introduction
What is a “foodie,” really? While the popular media frequently celebrates “foodie” culture, the term remains relatively underexplored and poorly defined by the academic literature. Popular definitions range from Merriam-Webster’s description of a foodie as someone with an “avid interest in the latest food fads” to more nuanced portrayals that depict socioemotional attributes of foodies such as food enjoyment and interest, time investment, monetary investment, and knowledge (Chang et al., 2020; Pickering and Pickering, 2022; Setia et al., 2022). Despite this prior work, few studies have connected foodie culture with food spending in a nationally representative sample, which is important for developing an agri-food marketing strategy.
This study builds on the prior literature to offer a fresh perspective on foodie demographics and economic behavior. Specifically, we link this research to the wider discourse on consumer segmentation and the role of foodies in shaping food trends more broadly. Food spending is a key financial decision with critical implications for consumer well-being. Because food is a necessity, spending on food as a share of income can be considered a key measure of well-being (Almås, 2012; Beatty and Larsen, 2005). Income is a key determinant of one’s food spending share, but what other factors drive spending behavior? Are there consumer types or characteristics that are related to food spending share and, thus, well-being? This article explores the concept of being a “foodie” as one such potential characteristic.
Furthermore, social influence can drive changes in food preferences (Abell and Biswas, 2023; Richards et al., 2014). As trendsetters in food culture, foodies are likely to have large implications for market-based approaches to promoting public health, nutrition, and sustainability, directly impacting consumer well-being more broadly. For example, the influence of foodie culture on consumer demand shifts can promote healthier eating habits as businesses tailor their offerings to meet the demand for more nutritious foods (Powell and Pring, 2023). Similarly, foodies' preferences for sustainable consumption might positively affect environmental outcomes, contributing to societal well-being (Jalali and Khalid, 2021). A deeper exploration of this consumer culture might help public health and environmental advocates leverage these insights to design targeted interventions that encourage the adoption of healthier and more sustainable diets.
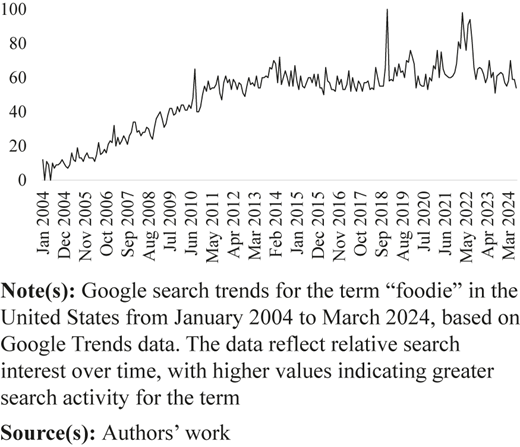
The term “foodie” first emerged in the 1980s amid rising culinary curiosity and the advent of the popular notion of food as an art form (Barr and Levy, 1984). Since then, consumer behavior in key market segments has shifted to favor “foodie culture” through the development of a “food movement” driven by greater awareness of food sourcing, sustainability, and a burgeoning interest in gastronomy tourism (Lusk, 2017; Yong et al., 2022). This shift raises the critical question: Does this reflect the behavior of a vocal minority of consumers, or is it indicative of a broader, more widespread trend? Figure 1 displays Google Trends data for the topic “Foodie” in the United States from 2004 to 2024. Search volume consistently increased over the past two decades, rising by more than 770% from July 2004 to July 2024. The striking growth of online search of the term suggests that the rise of digital media has further amplified this trend, enabling foodies to share their culinary adventures and insights, thereby shaping public perceptions of food and eating (Verma, 2023). Indeed, foodie culture represents a valuable lens through which to develop agri-food marketing strategies, and this article empirically unpacks ways to identify foodies as a market opportunity.
This article explores foodies as a unique consumer segment. Using USA consumer survey data, we examine the economic and psychological dimensions that set foodies apart from the general consumer population. Rather than providing our own formal definition of “foodies,” participants in our consumer panel described the concept, demonstrating how foodies can be characterized in three important ways. First, foodies and non-foodies alike emphasize the importance of love in the foodie approach to food choice. Second, foodies are more likely to describe themselves as passionate about food and a food connoisseur. Finally, and perhaps most importantly, foodies are consumers who spend a larger share of their income on food than non-foodies, regardless of their household income. This trend holds for food away from home, food at home, and overall food expenditures.
Methods
Our data come from a nationwide online survey on Qualtrics® of 1,210 USA consumers. The survey was stratified to be consistent with the USA population (see Table 1). We ask participants if they’ve heard of the term “foodie.” Of the 1,117 familiar with the term, we then asked them if they considered themselves to be a “foodie.” By asking the participants themselves to identify whether or not they are a foodie, we seek to reduce experimenter bias by forcing an externally-determined definition of the colloquial term. From there, we develop characteristics of demographic, economic, and cultural profiles of self-identified foodies. Data were collected in February 2021. To clarify what distinguishes foodies from non-foodies, we examined aspects including age, education, income levels, dietary preferences, and political affiliations.
Demographics of foodies and non-foodies
| Characteristic | Overall | Foodie | Not a foodie | USA Census |
|---|---|---|---|---|
| Female (%) | 52.2 | 49.2 | 54.2 | 50.4 |
| Age | ||||
| 18–24 years old | 10.5 | 11.3 | 9.1 | 9.4 |
| 25–34 years old | 17.6 | 24.3 | 12.6 | 13.5 |
| 35–44 years old | 18.4 | 24.3 | 15.1 | 12.7 |
| 45–54 years old | 16.9 | 18.9 | 15.5 | 12.4 |
| 55–64 years old | 15.9 | 10.8 | 19.6 | 13.1 |
| 65–74 years old | 16.3 | 9.5 | 21.5 | 10.0 |
| 75 years or older | 4.4 | 0.9 | 6.5 | 6.8 |
| Race | ||||
| White | 79.1 | 76.8 | 81.6 | 61.6 |
| Black or African American | 11.6 | 14.5 | 9.3 | 12.4 |
| Other | 9.3 | 8.7 | 9.1 | 26.0 |
| Education | ||||
| Less than high school | 2.0 | 1.3 | 1.7 | 9.8 |
| High school/GED | 19.9 | 17.1 | 20.1 | 27.8 |
| Some college | 21.7 | 24.3 | 18.9 | 17.5 |
| 2-year college degree (Associates) | 11.7 | 10.2 | 12.7 | 10.1 |
| 4-year college degree (BA, BS) | 27.0 | 25.4 | 29.8 | 22.1 |
| Master’s degree | 13.0 | 16.7 | 11.4 | 9.5 |
| Professional degree (Ph.D., J.D., M.D., etc.) | 4.7 | 5.0 | 5.3 | 3.2 |
| Annual household income | ||||
| Less than $20,000 | 14.5 | 10.6 | 16.0 | 13.8 |
| $20,000 - $39,999 | 21.6 | 20.8 | 20.7 | 16.5 |
| $40,000 - $59,999 | 17.8 | 16.1 | 17.2 | 14.7 |
| $60,000 - $79,999 | 13.5 | 14.5 | 14.6 | 12.1 |
| $80,000 - $99,999 | 9.1 | 10.4 | 8.6 | 9.3 |
| $100,000 - $119,999 | 6.6 | 6.1 | 7.6 | 7.6 |
| $120,000 - $139,999 | 3.5 | 3.3 | 3.8 | 5.6 |
| $140,000 - $159,999 | 6.3 | 9.5 | 4.6 | 4.3 |
| $160,000 or greater | 7.1 | 8.7 | 6.9 | 16.1 |
| Political party | ||||
| Democratic | 41.4 | 47.3 | 38.4 | 33.0 |
| Republican | 26.1 | 25.6 | 26.0 | 29.0 |
| Independent | 30.1 | 25.4 | 32.9 | 34.0 |
| Other (e.g. green, tea party, libertarian, etc.) | 2.3 | 1.7 | 2.8 | 4.0 |
| Vegan or vegetarian (%) | 3.7 | 5.9 | 2.2 | – |
| Number of observations | 1,117 | 463 | 585 | – |
Note(s): Values are reported as percentages. Data from 2020 USA Census and party affiliation from Pew
Source(s): Authors' work
EFA is a statistical technique used to reduce the number of observed variables into fewer unobserved factors while retaining as much original information as possible by “loading” factors from each survey question (Malone and Lusk, 2018). To determine the appropriate number of factors, we employ a scree test, which helps avoid overfitting the model by plotting the eigenvalues of the correlation matrix and identifying the point where the plot “levels off” (i.e. the “elbow”). This point indicates the number of factors to retain, as factors beyond the elbow explain minimal additional variance. Furthermore, we employ a large language model (LLM) to generate labels for the identified factors by analyzing the content of the factor loadings and suggesting appropriate labels that capture the essence of the data patterns (OpenAI, 2024) [1].
We anticipate that foodies spend a larger share of their income on food. To test this, we derive Engel curves, which represent the relationship between a consumer’s income and expenditure on a specific good or category of goods (Almås, 2012). Using this approach, we can compare how foodies and non-foodies spend on food as their income changes. For example, if foodies exhibit higher income elasticity for restaurant spending, it would imply that increases in income result in a disproportionately higher allocation of spending toward food consumed away from home.
The expenditure share for food at home (FAH) and food-away-from-home (FAFH) is calculated by dividing the total amount spent on either FAH or FAFH by the household’s total income or total food expenditure [2]. For example, if a household spends $2,000 annually on FAH and has a total income of $50,000, the FAH expenditure share would be 4%. Similarly, if the same household spends $1,000 annually on FAFH, the FAFH expenditure share is computed by dividing FAFH expenditures by total income. To calculate our Engel curves, we estimate the following regressions:
where represents the share of total income allocated to a specific category of food expenditure (such as food at home, food away from home, or total food expenditures) for participant i in group g (e.g. foodie or non-foodie) and expenditure category j. The parameter is the intercept term, while represents the elasticity of food expenditure with respect to income (i.e. how much the expenditure share changes in response to income changes). Finally, captures the error term. We separate our sample based on whether a participant self-identifies as a foodie, allowing us to compare how income influences food expenditures between foodies and non-foodies across different categories of food consumption.
Results
For 1,117 participants familiar with the term “foodie,” 38.2% said that they were, in fact, a foodie, while 48.3% said “no,” and 13.5% said “I don’t know.” This percentage means out of the entire adult USA population, about a third has heard the term “foodie” and considers themselves a “foodie.” Table 1 compares the 463 people who had heard the term “foodie” and described themselves as one to the 585 people who had also heard the term but definitively said “no” they were not a foodie. Of people who described themselves as a “foodie,” 35.4% are younger than 35 years of age; of people who said “no” they’re not a foodie, only 21.7% were younger than 35. Of people who described themselves as a “foodie,” 38% have a college degree compared to only 18.5% of non-foodies. Incomes of foodies are about 12% higher on average than non-foodies. 5.8% of foodies said they were vegetarian or vegan, compared to only 2.2% of non-foodies. Of people who describe themselves as” foodies,” 47.3% are Democrats, compared to only 38.1% of non-foodies. Self-declared foodies spend about 45.8% more each week on food at home (i.e. through grocery stores) and about 18.8% more each week on food away from home (i.e. restaurants) than non-foodies.
Open-ended responses
It could be that foodies and non-foodies have different perceptions of what it means to be a foodie. To explore this possibility, we asked an open-ended question of people who had heard the term: “In a few words, describe a ‘foodie.’” Figures 2 and 3 present word clouds constructed from the responses. Responses from self-identified foodies show a deep appreciation for food across various dimensions. They frequently describe foodies as individuals who love all aspects of food, including eating, cooking, and exploring new cuisines. They consider themselves passionate about food, considering it more than just sustenance but as a hobby or art form. Furthermore, they are adventurous, eager to try new and diverse foods, and often engage with the latest food trends. Furthermore, they claim to appreciate the culinary process and dining experience, often highlighting food’s social and cultural aspects.
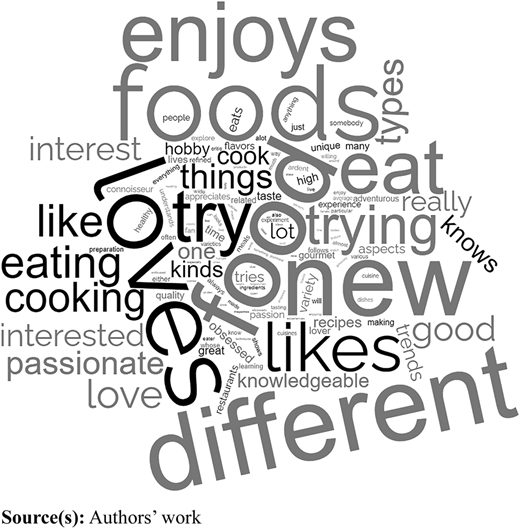
Most common words self-described foodies used in response to the prompt, “In a few words, describe a ‘foodie.R17’”
Most common words self-described foodies used in response to the prompt, “In a few words, describe a ‘foodie.R17’”
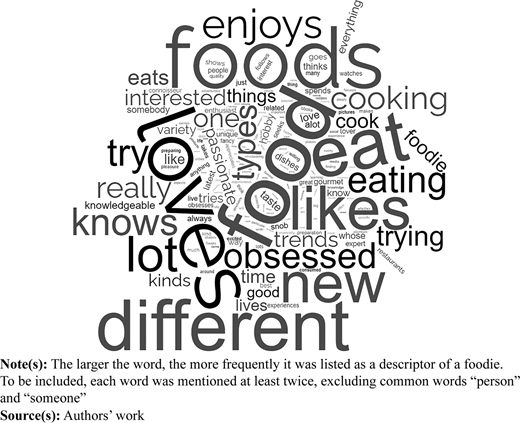
Most common words self-described non-foodies used in response to the prompt, “In a few words, describe a ‘foodie.R17’”
Most common words self-described non-foodies used in response to the prompt, “In a few words, describe a ‘foodie.R17’”
Responses from those who do not consider themselves foodies still recognize that these consumers are enthusiastic about food but also indicate a hint of critique. They describe foodies as “obsessed” with food, perhaps excessively, with a strong focus on gourmet or high-end dining experiences. Non-foodies considered them knowledgeable about food, including its preparation, origins, and current trends. They are sometimes perceived negatively as elitist or overly focused on food to the point of snobbery. Non-foodies perceived them as enthusiasts who enjoy exploring new culinary experiences, often seen as part of a lifestyle. These descriptions provide a basis for understanding the cultural and social identity of foodies as perceived by different groups within the broader public.
A useful pattern emerges when we compare the two categories of survey participants. Indeed, responses from foodies emphasize their deep appreciation for all things unique and culinary, with terms like “passionate,” “love,” “cooking,” “exploring,” and “different” appearing in the word cloud. This highlights foodies’ enthusiasm for engaging with food beyond sustenance, viewing it as an art, hobby, and cultural experience. By contrast, Figure 3 indicates that non-foodies have more critical or neutral perceptions, with words such as “obsessed,” “snobby,” and “trendy” featuring alongside descriptors like “knowledgeable” and “passionate.” These contrasting depictions highlight differing cultural and social perspectives on foodie identity, where foodies celebrate their culinary passion, while non-foodies may perceive it as elitist or excessive.
We then calculated the average ratings for various food-related statements, comparing responses from self-identified “Foodies” and “Not a Foodie” alongside the overall average response from all participants. Table 2 presents the extent to which the sample agreed or disagreed with various statements about food on a scale of 1 = strongly disagree to 5 = strongly agree. Foodies are likelier to agree that they are “passionate about food” and “a food connoisseur.” They are slightly less likely to see food in utilitarian terms - viewing it as a fuel or necessity. Foodies consistently rate higher in statements that reflect passion and enjoyment of food, such as “I am passionate about food” (4.34 for Foodies vs 3.05 for Not a Foodie), “I love to eat” (4.57 vs 3.86), and “I love to cook” (4.31 vs 3.3). This pattern extends to more profound food-related identities, such as considering food as a passion or connoisseurship, with Foodies scoring a 3.99 compared to just 2.44 for Not a Foodies, which is the largest observed difference (1.55) in the table.
Descriptive statistics
| Survey question | Overall | Foodie | Not a foodie | Difference |
|---|---|---|---|---|
| I am passionate about food | 3.62 | 4.34 | 3.05 | 1.29* |
| I love to eat | 4.15 | 4.57 | 3.86 | 0.71* |
| I love to cook | 3.73 | 4.31 | 3.3 | 1.01* |
| Food is my passion; I am a food connoisseur | 3.1 | 3.99 | 2.44 | 1.55* |
| Food is sacred; I eat the way nature intended | 2.87 | 3.23 | 2.6 | 0.63* |
| Food is social; I eat to be with friends and family | 3.51 | 3.85 | 3.29 | 0.56* |
| Food is a symbol; what I eat says something about who I am | 3.09 | 3.56 | 2.71 | 0.85* |
| Food is fuel; I primarily eat to get calories and nutrients | 3.26 | 3.16 | 3.34 | −0.18* |
| Food is a necessity; I only spend what I have to on food to get by | 2.88 | 2.73 | 2.97 | −0.24* |
| Food is comforting; I eat to reduce stress and relax | 3.58 | 3.88 | 3.35 | 0.53* |
| Food is my enemy; I am always on a diet | 2.03 | 1.97 | 2.05 | −0.08 |
Note(s): An asterisk indicates statistical significance of an alpha level of α < 0.01, after applying a Bonferroni adjustment for multiple comparisons
Source(s): Authors' work
The ratings also demonstrate how food is integrated into one’s lifestyle beyond mere enjoyment. For instance, statements like “Food is fuel; I primarily eat to get calories and nutrients” and “Food is a necessity; I only spend what I have to on food to get by” actually scored lower among Foodies compared to Not a Foodies, suggesting that Foodies may view food more holistically and culturally rather than just for sustenance. Conversely, the statement “Food is comforting; I eat to reduce stress and relax” scored higher among Foodies, supporting the notion that Foodies engage with food on an emotional level more than Not Foodies. The significance levels (indicated by asterisks) across most statements reinforce the reliability of these differences, highlighting consistent patterns in how Foodies and Not a Foodies relate to food in their daily lives.
Exploratory factor analysis
Scree plots indicated that three factors explained the majority of the variance in the survey items. Table 3 presents factor loadings for each of the food-related statements. The LLM identified “Food as Identity,” “Comfort Eating” and “Food as Necessity” as names that demonstrate the different dimensions within the dataset (OpenAI, 2024). The factor loadings provided distinctions in how participants viewed their relationship with food. The communality values indicate how much of the item’s variance is explained by the factors, while the complexity indicates the number of factors significantly influencing the item. Lower uniqueness values suggest that the factor explains more of that item’s variance.
Factor loadings based upon correlation matrix
| Item | Food as identity | Comfort eating | Food as necessity |
|---|---|---|---|
| I am passionate about food | 0.71 | 0.41 | −0.18 |
| I love to eat | 0.4 | 0.55 | −0.24 |
| I love to cook | 0.61 | 0.14 | −0.16 |
| Food is my passion; I am a food connoisseur | 0.74 | 0.35 | −0.09 |
| Food is sacred; I eat the way nature intended | 0.5 | 0.05 | 0.28 |
| Food is social; I eat to be with friends and family | 0.29 | 0.37 | 0.01 |
| Food is a symbol; what I eat says something about who I am | 0.52 | 0.23 | 0.2 |
| Food is fuel; I primarily eat to get calories and nutrients | 0.12 | −0.05 | 0.56 |
| Food is a necessity; I only spend what I have toon food to get by | 0.01 | −0.04 | 0.73 |
| Food is comforting; I eat to reduce stress and relax | 0.15 | 0.65 | 0.1 |
| Food is my enemy; I am always on a diet | −0.08 | 0.04 | 0.29 |
| Proportion of total variance explained | 0.20 | 0.11 | 0.11 |
| Proportion of the explained variance attributable to the factor | 0.48 | 0.27 | 0.26 |
Source(s): Authors’ work
The first factor explains 48% of the variance. Dubbed “Food as Identity,” this factor indicates that a participant emphasizes food’s emotional and personal significance. Items with high loadings include “I am passionate about food” (0.71), “Food is my passion; I am a food connoisseur” (0.74), “I love to cook” (0.61), “Food is sacred; I eat the way nature intended” (0.5), and “Food is a symbol; what I eat says something about who I am” (0.52). Factor 2 explains 27% of the variance. Dubbed “Comfort Eating,” this factor represents eating as a source of comfort and pleasure. The items highly loaded on this factor suggest a more emotional response to eating, particularly related to comfort and enjoyment. Items with the highest loadings in this factor included “I love to eat” (0.55) and “Food is comforting; I eat to reduce stress and relax” (0.65). Finally, Factor 3 explains 26% of the variance. Dubbed “Food as Necessity,” this factor is characterized by a practical and utilitarian view of food. The emphasis here is on food as a necessity rather than for pleasure or identity. Items with the highest loadings included “Food is fuel; I primarily eat to get calories and nutrients” (0.56) and “Food is a necessity; I only spend what I have to on food to get by” (0.73).
Engel curves
Table 1 indicates that foodies spend more on food, but a logical conclusion might be that they spend that much simply because they are also higher-income consumers. To explore this question, we estimated Engel curves showing how food spending varies with income for both foodies and non-foodies. Engel curves are a valuable tool in economics research for several reasons, especially when analyzing consumer behavior in relation to income changes. They represent the relationship between household spending on specific goods or services and changes in income. This relationship can help researchers understand consumption patterns across income levels and design appropriate policies, particularly in public health and welfare contexts. Engel curves are also useful in evaluating broader economic trends and structures, such as how changes in household consumption affect economic growth. They can inform tax policies, welfare assessments, and poverty measurements by understanding how different population segments allocate income across various expenditure categories. These insights are particularly relevant for consumer well-being, as they reveal how changes in income affect access to higher-quality food.
Tables 4–6 present the regression estimates used to derive Engel curves for food-away-from-home (FAFH) spending, food-at-home (FAH) spending, and total food expenditures. For each model, the coefficient for the logarithm of income shows a negative relationship, consistent with Engel’s Law, which posits that as income increases, the proportion of income allocated to food decreases (Chai and Moneta, 2010). The parameter’s value can be loosely interpreted as the likely change in the proportion of annual income spent on food as annual income increases by 1%. That said, the size of the coefficients is relatively small, which suggests that the change in the expenditure share due to income changes is modest, which is typical for necessary goods like basic food items. This pattern holds even though actual food spending may rise as income increases. We controlled for additional demographic variables such as gender, age, and education in the specification for Model 2. These models reveal that demographic factors also play a significant role in shaping food expenditure patterns. For example, younger and middle-aged individuals, particularly those between 25 and 54, tend to spend a lower share of their income on FAFH than the baseline group (18–24 years old). Additionally, education appears to have varying effects on expenditure patterns, with individuals with higher education levels spending a smaller proportion of their income on food.
Regression estimates used to derive food-away-from-home Engel curves
| Foodies | Non-foodies | |||
|---|---|---|---|---|
| Parameter | Model 1 | Model 2 | Model 1 | Model 2 |
| Intercept | 0.689*** (0.052) | 0.799*** (0.067) | 0.499*** (0.037) | 0.522*** (0.046) |
| Log(income) | −0.056*** (0.005) | −0.062*** (0.006) | −0.041*** (0.003) | −0.038*** (0.004) |
| Female | −0.021* (0.008) | −0.003 (0.006) | ||
| 25–34 years old | −0.030* (0.015) | −0.034** (0.013) | ||
| 35–44 years old | −0.020 (0.015) | −0.037** (0.013) | ||
| 45–54 years old | −0.037* (0.015) | −0.045*** (0.012) | ||
| 55–64 years old | −0.042* (0.017) | −0.067*** (0.012) | ||
| 65–74 years old | −0.052** (0.018) | −0.064*** (0.012) | ||
| 74 years or older | 0.014 (0.044) | −0.065*** (0.015) | ||
| High school/GED | −0.021 (0.036) | 0.009 (0.023) | ||
| Some college | −0.016 (0.035) | −0.003 (0.023) | ||
| 2-year college degree | −0.025 (0.037) | −0.020 (0.024) | ||
| 4-year college degree | −0.014 (0.036) | −0.006 (0.023) | ||
| Master’s degree | 0.007 (0.037) | 0.002 (0.024) | ||
| Professional degree (Ph.D., J.D., M.D., etc.) | −0.007 (0.039) | −0.006 (0.026) | ||
| Adjusted R-squared | 0.230 | 0.259 | 0.196 | 0.255 |
Note(s): Numbers in parentheses are standard errors. *, **, and *** indicate statistical significance of an alpha level of α < 0.01, α < 0.05, and α < 0.1. Models 2 estimated with a base of 18–24 year old males with less than a high school education. Foodie models estimated with 448 degrees of freedom and non-foodie models estimated with 568 degrees of freedom
Source(s): Authors’ work
Regression estimates used to derive food-at-home Engel curves
| Foodies | Non-foodies | |||
|---|---|---|---|---|
| Parameter | Model 1 | Model 2 | Model 1 | Model 2 |
| Intercept | 1.411*** (0.057) | 1.425*** (0.074) | 1.368*** (0.051) | 1.438*** (0.065) |
| Log(income) | −0.117*** (0.005) | −0.122*** (0.006) | −0.115*** (0.005) | −0.111*** (0.005) |
| Female | −0.001 (0.009) | 0.004 (0.009) | ||
| 25–34 years old | −0.018 (0.016) | 0.007 (0.018) | ||
| 35–44 years old | −0.001 (0.017) | 0.018 (0.018) | ||
| 45–54 years old | 0.010 (0.017) | 0.004 (0.017) | ||
| 55–64 years old | −0.025 (0.019) | −0.018 (0.017) | ||
| 65–74 years old | −0.019 (0.020) | −0.009 (0.017) | ||
| 74 years or older | −0.024 (0.048) | −0.017 (0.021) | ||
| High school/GED | 0.045 (0.039) | −0.092** (0.032) | ||
| Some college | 0.052 (0.039) | −0.121*** (0.033) | ||
| 2-year college degree | 0.034 (0.041) | −0.127*** (0.033) | ||
| 4-year college degree | 0.045 (0.039) | −0.118*** (0.032) | ||
| Master’s degree | 0.067 (0.040) | −0.105** (0.034) | ||
| Professional degree (Ph.D., J.D., M.D., etc.) | 0.062 (0.044) | −0.103** (0.036) | ||
| Adjusted R-squared | 0.525 | 0.527 | 0.506 | 0.522 |
Note(s): Numbers in parentheses are standard errors. *, **, and *** indicate statistical significance of an alpha level of α < 0.01, α < 0.05, and α < 0.1. Models 2 estimated with a base of 18–24 year old males with less than a high school education. Foodie models estimated with 448 degrees of freedom and non-foodie models estimated with 568 degrees of freedom
Source(s): Authors’ work
Regression estimates used to derive total food expenditures Engel curves
| Foodies | Non-foodies | |||
|---|---|---|---|---|
| Parameter | Model 1 | Model 2 | Model 1 | Model 2 |
| Intercept | 2.100*** (0.089) | 2.223*** (0.116) | 1.868*** (0.076) | 1.960*** (0.096) |
| Log(income) | −0.173*** (0.008) | −0.184*** (0.010) | −0.156*** (0.007) | −0.149*** (0.008) |
| Female | −0.022 (0.014) | 0.001 (0.013) | ||
| 25–34 years old | −0.048 (0.025) | −0.027 (0.027) | ||
| 35–44 years old | −0.021 (0.026) | −0.019 (0.026) | ||
| 45–54 years old | −0.027 (0.027) | −0.041 (0.026) | ||
| 55–64 years old | −0.067* (0.029) | −0.085*** (0.025) | ||
| 65–74 years old | −0.070* (0.031) | −0.072** (0.025) | ||
| 74 years or older | −0.009 (0.075) | −0.082** (0.031) | ||
| High school/GED | 0.024 (0.061) | −0.083. (0.048) | ||
| Some college | 0.036 (0.061) | −0.124* (0.048) | ||
| 2-year college degree | 0.009 (0.063) | −0.147** (0.049) | ||
| 4-year college degree | 0.031 (0.061) | −0.124** (0.048) | ||
| Master’s degree | 0.074 (0.063) | −0.103* (0.050) | ||
| Professional degree (Ph.D., J.D., M.D., etc.) | 0.056 (0.068) | −0.109* (0.054) | ||
| Adjusted R-squared | 0.495 | 0.506 | 0.457 | 0.485 |
Note(s): Numbers in parentheses are standard errors. *, **, and *** indicate statistical significance of an alpha level of α < 0.01, α < 0.05, and α < 0.1. Models 2 estimated with a base of 18–24 year old males with less than a high school education. Foodie models estimated with 448 degrees of freedom and non-foodie models estimated with 568 degrees of freedom
Source(s): Authors’ work
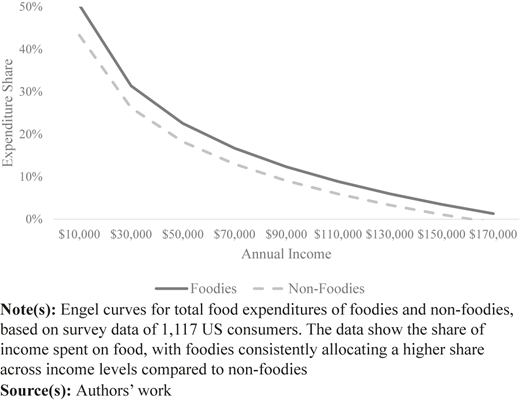
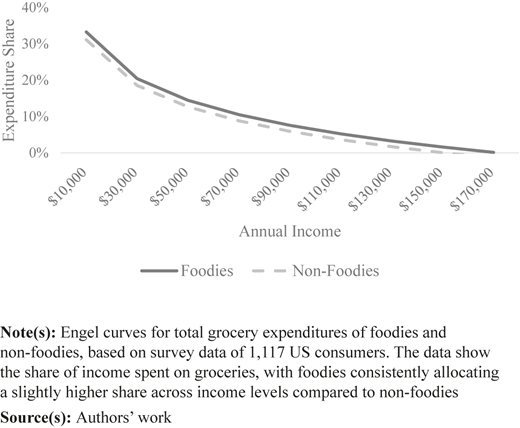
These models suggest that as people’s incomes increase, they spend a smaller fraction of their income on food, as is typical in consumer behavior studies. The intercept suggests that a significant baseline expenditure on food does not decrease substantially, even at very low-income levels, reflecting a minimum necessary spend on food. We plot the results for the Model 1 specifications of each table above for simplicity of interpretation. Figure 2 demonstrates the expenditure share of food overall relative to annual income. Foodies spend more of their income on food than non-foodies at any given income level, though that gap decreases as income increases.
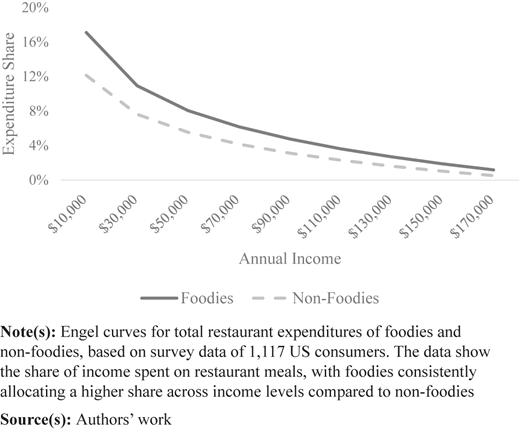
Figures 4 and 5 break down these findings further by illustrating the differences in spending on food at home and food away from home for foodies and non-foodies. Notably, the largest discrepancies between the two groups are observed in FAFH, where foodies consistently allocate a larger share of their income at every income level. However, as income rises, this gap between foodies and non-foodies diminishes (see Figure 6)
From a policy perspective, these findings highlight the need to consider both income and demographics when designing interventions to improve access to healthy and sustainable food options. For instance, public health campaigns promoting healthier diets could target younger, lower-income consumers, who may have less flexibility in their food budgets. Similarly, policymakers could leverage the spending patterns of foodies to promote more sustainable consumption habits, particularly in higher-income groups where the share of income spent on food tends to be lower, but actual spending may still be significant. These insights contribute to a deeper understanding of how income, demographics, and consumer preferences intersect, offering valuable implications for consumer well-being and economic policy.
Conclusion
This article advocates for more in-depth exploration of “foodies” as a distinct consumer segment. We contribute to the consumer well-being literature by detailing these demographic and economic trends for American foodies. The increased consumer focus on unique credence attributes for food, which foodies exemplify, has broader implications for improving public health outcomes and promoting responsible food production and consumption practices (Lusk, 2018). Foodies are typically younger, with a significant proportion under 35. These consumers are also more likely to have higher educational attainments and above-average incomes, which may influence their food choices and consumption habits. Notably, foodies are more likely to have adopted vegetarian or vegan diets and are more likely to have children at home. This connection implies that it might be valuable for additional research that connects this unique consumer base to other diet trends (Malone and Norwood, 2020). In this case, foodies tend to lean more liberal, which correlates with their food consumption patterns, particularly their higher spending on home-cooked and restaurant meals.
This study provides some insight into the important nuances of foodie culture. By recognizing foodies’ unique spending behaviors and values, this research provides a foundation for designing targeted marketing strategies and public health initiatives that align with their priorities while addressing broader societal goals. Foodies are trendsetters who prioritize quality, experience, and ethical considerations in their food choices. Additionally, understanding non-foodie perceptions and critiques offers opportunities to design inclusive messaging that broadens the appeal and minimizes perceptions of elitism. Future research could explore regional or cultural variations in foodie behavior and assess the long-term impacts of foodie-driven trends on food systems, offering even deeper insights into the evolving dynamics of food culture.
From a policy perspective, understanding the demographic and behavioral characteristics of foodies can inform the development of nutrition and public health initiatives to promote healthy eating habits and sustainable food consumption. For example, nutrition programs might design tailored interventions that resonate with the values and preferences of foodies. Moreover, the strong engagement with food as an identity and cultural expression of foodies indicates that branding and promotional efforts emphasizing authenticity, quality, and ethical sourcing are likely to be particularly effective. By positioning product offerings and marketing campaigns toward the identified trends and preferences of foodies, agri-food marketers might enhance consumer satisfaction while simultaneously driving growth and competitiveness.
Our findings create additional avenues for future research in public health policy, nutrition programs, and sustainable food marketing practices, particularly related to consumer well-being. This study is intended to call for additional research on the burgeoning consumer trends underlying foodie culture. One promising direction is to explore the cultural identity and regional differences among foodies, examining how cultural backgrounds and geographic locations influence foodie behaviors and preferences (Kline et al., 2018; Moreno and Malone, 2021). Additionally, longitudinal studies might track changes and draw causal linkages between the macroeconomy and foodie culture, particularly in response to emerging food trends and global events such as the COVID-19 pandemic. Another area for further investigation is the impact of digital media and social networks on the propagation and evolution of foodie culture, including the role of influencers and online communities in shaping consumer behavior. Moreover, additional studies might target the environmental implications of foodie-driven market trends, assessing how increased demand for gourmet and sustainable foods affects food supply chains. Finally, studies integrating insights from psychology, sociology, and marketing could provide a more comprehensive understanding of the motivations and values driving foodie culture.
Notes
More specifically, we used ChatGPT 4o to: “Identify a label for each of the different factors identified via the factor loadings in the results section of this manuscript.” Labels were verified for relevance and validity through manual cross-checks by the research team, ensuring alignment with the survey data and theoretical constructs. Respondents who were unsure of their identity as foodies were excluded from the analysis to maintain a clear distinction between foodie and non-foodie groups, consistent with the study’s objectives.
Food at Home (FAH) refers to the spending on groceries and food items purchased for preparation and consumption within the household. This includes all food bought from supermarkets, farmers' markets or other retail outlets intended to be consumed or prepared at home. We asked participants, “What has been your (or your household’s) usual WEEKLY expense for food bought during grocery shopping?” Conversely, Food Away from Home (FAFH) refers to expenditures on meals, snacks, and beverages consumed outside the home, such as at restaurants, cafeterias, food trucks or other dining establishments. We asked participants, “What has been you (or your household’s) usual WEEKLY expense for meals or snacks from restaurants, fast food places, cafeterias, carryout or other such places?”
Ethics: The research was conducted via questionnaire, so we were issued an exemption from the Purdue University ethics review board.

