


Agri-food firms face many challenges when assessing and managing their performance. The purpose of this research is to determine important factors for an integrated agri-food supply chain performance measurement system.
This research uses the Peruvian kiwicha supply chain as a meaningful context to examine critical factors affecting agri-food supply chain performance. The research uses interpretative structural modelling (ISM) with fuzzy MICMAC methods to suggest a hierarchical performance measurement model.
The resulting kiwicha supply chain performance management model provides insights for managers and academic theory regarding managing competing priorities within the agri-food supply chain.
The model developed in this research has been validated by cooperative kiwicha associations based in Puno, Peru, and further refined by experts. Moreover, the results obtained through ISM and fuzzy MICMAC methods could help decision-makers from any agri-food supply chain focus on achieving high operational performance by integrating key performance measurement factors.
Introduction
Industries today seek an effective performance measurement system (PMS) to maximize the bottom line (Govindan et al., 2017; Guersola et al., 2018). Performance measurement research and applications draw from various disciplines, from production and operations management to accounting and management control (Moreira and Tjahjono, 2015). Due to the increasing complexity of agri-food supply chains, managers continue to seek ways to measure and monitor the performance of those systems (Bottani and Bigliardi, 2014). A crucial first step towards this end is to identify the principal factors that impact operational performance in the agri-food supply chain; second is to identify the key performance measures that adequately capture both goal achievement and alignment with supply chain strategy and market conditions (Guersola et al., 2018; Mishra et al., 2018; Arif-Uz-Zaman and Ahsan, 2014).
Performance measurement value arises from using timely and accurate information in supply chain management (Laihonen and Pekkola, 2016) and can benefit organizations by delivering strategically aligned metrics that provide visibility into process performance (Moreira and Tjahjono, 2015). Performance measurement is a complex process because several companies and activities are involved (Panjehfouladgaran and Yusuff, 2016). Hundreds of metrics can be used to measure supply chain performance, yet true success relies on the adoption of the right metrics (Bottani and Bigliardi, 2014) that accurately measure and motivate desired supply chain process performance (Elrod et al., 2013; Birhanu et al., 2016). Different industries can require different metrics based on their supply chain performance characteristics and specific business environments (Bulsara et al., 2016; Govindan et al., 2017).
The structure of an agri-food supply chain can be complex, with many entities and interactions included. The distinction between the food supply chain and non-perishable product supply chains is that the former requires a host of handling techniques to allay food product quality problem and even complete the ripening process (Cunha Callado and Jack, 2017; Saputri et al., 2019). Fuzzy logic, known for handling uncertainty in different science and technology fields when insufficient quantitative data is presented, may address the highly uncertain factors of the agri-food supply chain, such as the soil content, rainfall, humidity production and yield prediction (Banaeian et al., 2018; Cappelletti et al., 2017; De and Singh, 2021; Ganga and Carpinetti, 2011). A PMS can help food supply chains attain competitiveness in reduced SC costs, lead-times and food waste (Shashi et al., 2018). However, it is important to mention that PMS can have some limitations in a wider range of controlling targets (Bigliardi and Bottani, 2010).
Supply chain management functions can differ between developing and developed countries, especially regarding lowering costs through increased productivity (Govindan et al., 2017). Increases in productivity have allowed the Latin American agricultural export sector to catch up with demand (Septiani et al., 2016). However, to keep up with ever-changing supply and demand patterns, the region's supply chain partners could benefit from a coordinated PMS to help manage scarce resources (Mishra et al., 2018). Peru is experiencing substantial growth in its agricultural sector, mainly emerging in areas that were previously fallow or desert land.
This research considers Peru's top region in kiwicha production (Larrea‐Gallegos et al., 2019). Furthermore, with the increased international demand for quinoa, Peru has been recognized as the world's top provider (FAO, 2019). Kiwicha belongs to the Andean grain family and is known for its high nutritional value and protein content (Repo-Carrasco-Valencia et al., 2010), which has made it a coveted health food across the globe considered by some to be “the 21st-century's seed” (Martinez-Lopez et al., 2020; Coelho et al., 2018). However, the kiwicha supply chain has several limitations that have been amplified by intensified production. These include problems related to social, economic, quality, technology and environmental risks. Resilience to climate change and food security has also become principal concerns in the Andean region (Bedoya-Perales et al., 2018). Global demand fluctuations and low prices are also factors to be considered. Even though kiwicha is seeing growing sales potential in international markets, there is little research concerning how to face these issues or their impact on the kiwicha supply chain's overall performance. This study seeks to contribute to this field.
There have been studies focused on PMS for the agri-food supply chain. However, literature lacks an integrated understanding of a supply-chain-level PMS, representing an important knowledge gap that needs to be filled (Aramyan et al., 2007; Bigliardi and Bottani, 2010). We propose this study to establish an integrated supply chain PMS to improve and manage operational outcomes (Bhattacharya et al., 2014; Mishra et al., 2018) associated with the agri-food supply chain using Peruvian kiwicha as the focal setting.
A PMS assists in knowledge transfer and learning (Najmi and Makui, 2012). Although the advantages of measuring performance are well known, supply chain companies have not capitalized on their full potential (Jagan Mohan et al., 2019) because they often failed to account for system-level processes leading to ecosystem-wide performance (Laihonen and Pekkola, 2016). Only partial aspects of associated measurement processes have been studied to date (Mura et al., 2018). Thus, diverse theoretical perspectives leading to partial practical contributions have been developed in the field (Gaitán-Cremaschi et al., 2017).
It is important to note that performance measurement methods have weaknesses stemming from unique industry characteristics and management perspectives, which sometimes do not account for critical factors (Lin and Li, 2010). The objective of this paper is to develop an integrated PMS for the agri-food supply chain. The ISM fuzzy MICMAC methodology was used to determine relationships among metrics identified in this supply chain investigation, and the fuzzy set theory is used for each criterion in the traditional MICMAC. Fuzzy MICMAC facilitates the critical investigation of each criterion and categorizes associated metrics according to driving and dependence power (Bhosale and Kant, 2016; Chowdhury et al., 2019; Katiyar et al., 2018). Recently, studies demonstrate an increasing interest in developing the supply chain applying the ISM and fuzzy MICMAC approach (Bhosale and Kant, 2016; Gorane and Kant, 2013; Katiyar et al., 2018; Mangla et al., 2018). The present study addresses the following research questions:
Which factors are most important to consider when designing and implementing a kiwicha supply chain PMS?
What are the interrelationships and impacts of selected performance measurement factors on the kiwicha supply chain's operational performance?
The study's contributions are based on the answers to these research questions. First, performance measurement studies usually employ mathematical and simulation models that are not necessarily easy to use by practitioners or managers; this study contributes to that existing literature gap by providing a practical framework for industry decision-makers (Mishra et al., 2018). It also provides valuable insight from practitioners and industry experts who validate factors that serve as input in the ISM fuzzy MICMAC method and contribute to assuring an integrated approach of metrics for the agri-food system. Lastly, it contributes to the Latin American agri-food industry literature, since previous performance measurement studies focus on large and mid-size corporations or companies with developed technological capabilities that are not available or widely adopted by agri-food supply chain supply chain stakeholders in emerging countries (Bititci et al., 2000; Gunasekaran et al., 2004; Gunasekaran and Kobu, 2007; Mishra et al., 2018).
This remainder of this paper is organized into five sections. First, the literature review explains the basic concepts related to agri-food supply chain management based on performance measurement. The research method and data collection section apply a method to prioritize and establish the interdependency among performance measurement factors. Finally, the discussions, conclusions and future research ideas are presented.
Literature review
Supply chain management
A supply chain is a network of buyers and suppliers, emphasizing how an organization coordinates with partner organizations' processes, technologies and capabilities (Balon et al., 2016). A supply chain's success depends, in part, on the flow of knowledge across the chain (Bhosale and Kant, 2016). An essential characteristic of supply chain management is the coordination of activities between these interdependent organizations (Jüttner et al., 2003), leading to operational improvements and customer value (Mora-Monge et al., 2019). A key aspect of supply chain management definitions concerns integrating strategic process management for creating competitive advantages with improved firm performance (Chalyvidis et al., 2013; Chang et al., 2016).
The supply chain's coordination problems can cause mismatching between the upstream enterprise's supply and the downstream enterprise's demand (Xiao, 2015). Supply chain interoperability measurement can be modelled for each supply chain member by using a set of criteria related to the ability of them to cooperate with suppliers, customers and the focal firm to provide services to each other as well as to their users/customers (Chalyvidis et al., 2013). It also allows measuring the supply chain using qualitative and quantitative approaches (Alfalla-Luque et al., 2013).
Agri-food supply chain
In recent decades Latin America has become a significant producer of agricultural food products for Europe and North America. Products such as quinoa or kiwicha have been part of the Andean regional cuisine for generations (Larrea‐Gallegos et al., 2019). The firms involved in the production and distribution of agri-food products for human consumption in a particular society are jointly called the agri-food supply chain (Oreja-Rodriguez et al., 2010). A feature specific for the agribusiness and the food system is the significant role of legal and political regulations (Gazdecki, 2018).
It is essential to understand the complexity driven by members of the agri-food supply chain, which ranges from operational performance issues to increased food waste problems. In recent years, supply chain managers have been concerned about controlling food quality and safety and the potential for weather-related supply variability (Doukidis et al., 2007; Govindan, 2018; Salin, 1998). The perishable nature and bulkiness of products, seasonal and scattered production, variability in quantity and quality (i.e. the product does not have standard dimensions), and specific logistics requirements should be considered (Patidar and Agrawal, 2020). These and similar reasons drive costs and reduce if not completely negate farmer profitability (Priya and Vivek, 2015). Table 1 identifies the characteristics of agribusiness supply chain members.
Kiwicha supply chain industry characteristics
| Supply chain | Characteristics | References |
|---|---|---|
| Agriculture |
| Gazdecki (2018), Oreja-Rodriguez et al. (2010), Yeboah Nyamah et al. (2017) |
| Agri-food industry |
| |
| Distribution/Retail |
|
Kiwicha's industry characteristics (as shown in Table 1) present several difficulties across the supply chain, damaging relationships with international customers, thereby causing a trend of decreasing exports from 2007 to 2017, according to Peru's Ministry of Agriculture and Irrigation (Guardián Sedano and Trujillo Velásquez, 2019). Factors ranging from the lack of an integrated PMS to the various diverse actors involved in the process make it difficult for stakeholders to analyse the supply chain (Sillanpää, 2015).
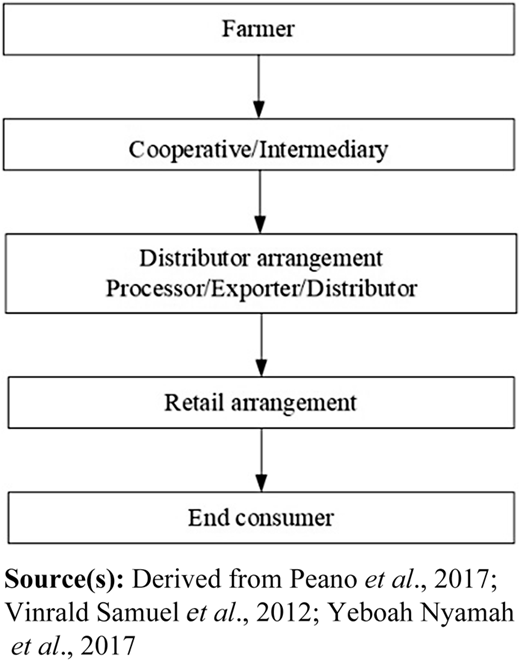
The global market structure for agri-foods and the associated supply chain is not static and is currently undergoing a transformation (Ahumada and Villalobos, 2009). An Indian study mentioned the possible impact of agri-food retail chains over the unorganized fruits and vegetable sector (S. Kumar and Routroy, 2018). These types of chains had divided themselves into two main channels: growers to commission agents and commission agents to consumers (Yeboah Nyamah et al., 2017). It is essential to consider that those main channels are like the current kiwicha agri-food chains in Peru. Figure 1 shows the typical distribution flow in an agri-food supply chain.
Supply chain performance measurement
Performance measurement can be defined as “the process of quantifying effectiveness and efficiency of actions” (Guersola et al., 2018). Metrics enable stakeholders to better understand the organization's strategies and performance goals in a way that informs important managerial decisions (Panjehfouladgaran and Yusuff, 2016). An effective supply chain PMS is purported to help firms increase many measures of performance (Mishra et al., 2018).
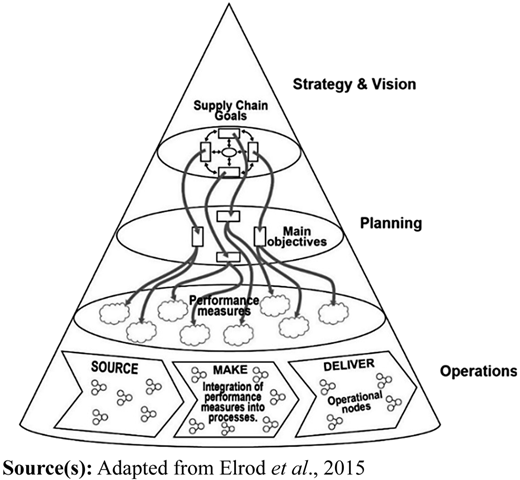
For a PMS to be functional, it needs to fit the environment in which it operates (Akyuz and Erkan, 2010; Guersola et al., 2018). Most companies have many performance measures that have emerged based on staff and consultants' suggestions (Najmi and Makui, 2012). Measuring network performance promotes consensus on and alignment with the network's goals, which acts as a governance system and supports the creation of incentives (Chalyvidis et al., 2013; Laihonen and Pekkola, 2016). When performance management systems are not integrated into daily activities, performance cannot be managed collaboratively across organizational levels (Agustin et al., 2018; Moreira and Tjahjono, 2015). Others argue that PMS are not expected to impact behaviour directly but serve to clarify expectations, enable empowerment and generate feedback (Moreira and Tjahjono, 2015; Shalij and Iqbal, 2016). Figure 2 shows the structure of supply chain levels and how performance measurement is considered part of the planning level.
Sharing these critical resources among supply chain entities is essential to operational performance. Agri-food supply chain managers should ideally consider all functions, factors and partners when creating and assessing measures (Akhtar et al., 2016; Grekova et al., 2016). If supply chain outcomes fail to meet expectations, PMS can be leveraged to identify and control problems and drive performance (Chalyvidis et al., 2013; Rajaguru and Matanda, 2019). In this research, we seek to identify and prioritize the right factors necessary to measure and improve the agri-food supply chain.
Metrics in agri-food supply chain
Performance measures for manufacturing, agricultural and food supply chains that can improve supply chain operational performance have been proposed by several authors (Banasik et al., 2017; Iqbal and Shalij, 2016). Measurement criteria can be specific for each type of supply chain (Najmi and Makui, 2012). Obtaining performance from metric use depends on strategy development, monitoring, evaluation and flexibility (Fayezi et al., 2017; Singh et al., 2013). As shown in Figure 3, the following activities are needed to assess metrics: (1) identify performance measures suggested by research, (2) validate those metrics by capturing events and activities accurately and (3) classify metrics based on their management and use at different stages and locations.

It is difficult to develop and adopt PMS that satisfy the needs of all stakeholders and ensure maximum value to end-users (consumers) (Mishra et al., 2018). Table 2 presents recent studies in the performance management system in the agri-food supply chain industry. Previous findings show different classifications of PMS factors (Aramyan et al., 2007) considering both financial and non-financial aspects (Vlajic et al., 2013). Literature on measure development is often based on a survey to industry-related experts or company members of the studied industry (Bottani and Bigliardi, 2014; Kühne et al., 2010; Shalij and Iqbal, 2016). In this research, we leverage this literature on agri-food and PMS to identify relevant performance factors to consider.
Research examining agri-food supply chain performance
| Title | Author | Topics/Findings |
|---|---|---|
| Performance measurement in agri-food supply chains: a case study | Aramyan et al. (2007) | The case study concludes that four main categories of performance measures (i.e. efficiency, flexibility, responsiveness and food quality) are identified as key performance components of the food supply chain PMS |
| Performance measurement in the food supply chain: a balanced scorecard approach | Bigliardi and Bottani (2010) | This paper's primary objective is to develop a balanced scorecard (BSC) model designed and delimited for performance measurement in the food supply chain |
| Measuring innovation capacity in the agrifood sector: from single companies to value chains | Kühne et al. (2010) | This paper provides the basis for future research in innovation measurement at firm and value chain levels, providing essential implications for further developing the proposed approach |
| SCOR based Food supply chain's sustainable performance evaluation model | Kyllönen and Helo (2012) | This paper introduces the first level of the SCOR-based food supply chain's sustainable performance evaluation model and a case study |
| Using vulnerability performance indicators to attain food supply chain robustness | Vlajic et al. (2013) | In this article, a new method for vulnerability assessment, the VULA method, is presented |
| The impact of supply chain performance drivers and value chain on companies: a case study from the food industry in Jordan | Mazzawi and Alawamleh (2013) | This research is conducted to study the supply chain performance drivers and the value chain and evaluate their implementation and their effect on companies |
| A model for measuring technology capability in the agrifood industry companies | De Mori et al. (2016) | This paper aims to focus on technology capability and develop a model for measuring agri-food industry companies |
| Total factor productivity: a framework for measuring agri-food supply chain performance towards sustainability | Gaitán-Cremaschi et al. (2017) | This document develops two unique metrics, based on a total factor productivity indexing approach, to compare products in terms of their sustainability performance. Both metrics are adjusted to internalise food production's social and environmental externalities and consider the sustainability effects of the stages along the agri-food supply chains |
| Agri-food supply chain performance: an empirical impact of risk | Yeboah Nyamah et al. (2017) | The purpose of this paper is to examine the key risk components (probability and consequence) and their respective thresholds affecting agri-food supply chain operations in Ghana |
| Measuring agri-food supply chain performance and risk through a new analytical framework: a case study of New Zealand dairy | Moazzam et al. (2018) | This study provides how agri-food supply chain managers can employ a new analytical framework in conjunction with the SCOR model to understand the complicated performance measurement indicators applied across their relevant agri-food production systems and supply chains |
| Evaluating partnerships in sustainability-oriented food supply chain: a five-stage performance measurement model | Shashi et al. (2018) | This study aims to investigate how overall food supply chain performance (FSCP) often depends on the performance of partners in a sustainable and energy-efficient supply chain |
| Structural model of perishable food supply chain quality (PFSCQ) to improve sustainable organizational performance | Siddh et al. (2018) | The purpose of this document is to examine the concept of perishable food supply chain quality (PFSCQ) and suggest a structural model that accounts for the influence of PFSCQ practices on the sustainable performance of the organization |
| Sustainable agri-food supply chain performance measurement model for GMO and non-GMO using data envelopment analysis method | Saputri et al. (2019) | The purpose of this study is to determine the level of sustainability between GMO and non-GMO foods |
| Investigating and analyzing the supply chain practices and performance in the agro-food industry | Puška et al. (2020) | This study empirically examines the potential impact of supply chain practices on the agri-food industry's supply chain performances |
| Developing and validating an innovation drivers' measurement instrument in the agri-food sector | Kafetzopoulos et al. (2020) | The purpose of this paper is to develop an instrument that measures a set of dynamic drivers for managing innovation capability; and to validate this instrument in the agri-food sector |
This research used seven Andean grain experts, two academicians and the literature review as the basis for identifying performance factors and associated metrics. The criteria for finding suitable expert participants to decide factor inclusion or exclusion were these: the participant must (1) work in the Peruvian agri-food industry, (2) be closely involved with performance measurement, (3) have more than 10 years of working experience in the agri-food supply chain and (4) have a high level of knowledge on the topic. Table 3 shows the chosen factors considered relevant to the study's context as well as the associated performance metrics.
Performance measurement factors
| Code | Factor | Performance metric | Definition | References |
|---|---|---|---|---|
| PF1 | Planning | Material requirements | Effective planning and control of goals allow companies to achieve effective resource utilization. Supply chain planning is “the management of activities related to supply and demand to minimize mismatches and therefore create and capture value”. For agribusiness involves the integrated determination and scheduling of resources, advised cultivation, harvest, distribution, storage and guarantee total income | Hajimirzajan et al. (2021), Govindan et al. (2017), Srinivasan and Swink (2015), Quesada et al. (2012) |
| Production | ||||
| Financial | ||||
| PF2 | Supplier performance | Efficiency | Buyers and suppliers are increasingly dependent upon each other as a strategic commitment rather than opportunist for mutual benefit. Key business and competitive priorities are often expressed through supplier performance specifications, coordination between buyer-supplier and work statements. Procurement and purchasing relationships in the food context have specific characteristics due to the complexity arising from the features of food production, processing, distribution and consumption | Kumar et al. (2020), Lees et al. (2020), Kumar and Routroy (2018), Iqbal and Shalij (2016), Handfield et al. (2015), Huang et al. (2014) |
| Response time | ||||
| Price | ||||
| PF3 | Finance | Profit margin/gross profit | Measures of how well the resources are utilized, including profit margin, cash flow improvement, and tracking and managing costs, help companies understand where the money is spent. It measures how effectively the agri-food firm uses its capital to generate profit | Shalij and Iqbal (2016), Bottani and Bigliardi, (2014), Elrod et al. (2013), Najmi and Makui (2012), Aramyan et al. (2007) |
| Cash flow improvement | ||||
| PF4 | Production | Production errors | Manufacturing firms themselves may cause supply chain inefficiencies due to technical, internal or environmental factors at the production level that reduce performance. For agri-food products, inefficiencies can also be related to a shortage of skilled employees, productivity problems, quality failure and weather-related factors such as rainfall, temperature and drought | Alora and Barua (2019), Bottani and Bigliardi (2014), Hachicha and Elmsalmi (2014), Punniyamoorthy and Thamaraiselvan (2013), Quesada et al. (2012) |
| Activity time | ||||
| Costing processes | ||||
| PF5 | Demand | Forecasting accuracy | This factor quantifies demand factors such as variability, market competition and customer fragmentation. Responding quickly to changes in demand is almost a competitive priority in dynamic business environments. An agri-food chain can impact unanticipated/very volatile customer demand, insufficient/distorted information from customers and changes in food safety requirements | Quang and Hara (2017), Panjehfouladgaran and Yusuff (2016), Ralston et al. (2015), Bhat and Kumar Sharma (2014), Thakkar et al. (2013) |
| Market share | ||||
| PF6 | Inventory | Inventory cost | The inventory measure includes diverse components: raw materials, work in process, finished goods and items demanded by the supply chain system. Costs related to inventory on hand can assist in inventory reductions, thus reducing warehouse and inventory costs. It is very crucial that executives in the organizations have to adopt the mindset of keeping inventory costs at a minimum level | Modgil and Sharma (2017), Bottani and Bigliardi (2014), Elrod et al. (2013) |
| PF7 | Transportation | Stock turnover | Transportation performance measures include shipping failures known in Peru: roads, lack of resources, logistics distribution error between retailers and fleet utilization, and transportation risk related to factors such as antiquated vehicles, extended routes, deficient highway conditions and minimal pay. The transportation management definition includes inbound, outbound, internal and external movements | Swanson et al. (2018), Rogers et al. (2016), Bottani and Bigliardi (2014) |
| Stock outs | ||||
| PF8 | Warehouse | Warehouse management cost | Warehouse management includes all planning and control procedures to operate the warehouse, including rising energy costs, inadequate infrastructure conditions and lack of services. Also, it includes the identification of storage costs, which presents opportunities for further cost minimization | Rogers et al. (2016), Bottani and Bigliardi (2014), Faber (2013), Elrod et al. (2013) |
| PF9 | Flexibility | Order flexibility | These are associated with human judgment and response; this could emerge in the form of errors in inventory management, planning, food distribution management and forecasting. The need for flexibility originates from clients, who force companies to respond faster to customer needs; this helps sustain competitive advantage. Each of these components is interpreted differently by individual stakeholders of the agri-food chain | Yeboah Nyamah et al. (2017), Iqbal and Shalij (2016), Elrod et al. (2013), Xiao (2015), Najmi and Makui (2012), Quesada et al. (2012) |
| Delivery flexibility | ||||
| PF10 | Quality | Product quality | This metric includes product and process quality, service quality, the performance of all inspections and tests, sustainability, and environmental considerations. Quality is not only related to the product but also related to services. For agri-food, the quality control level involves both agricultural production and food processing | Shalij and Iqbal (2016), Quesada et al. (2012), Najmi and Makui (2012) |
| Process quality | ||||
| Service quality | ||||
| PF11 | Innovation | Number of process innovation developed | Measuring innovation provides insights into changes, initiatives and improvements which the company needs to achieve its vision. Product innovation is the introduction of a good or service that is new or has significantly improved characteristics or intended uses; a process innovation refers to the implementation of a new or significantly improved production or delivery method. Innovations span the entire food system, from food production, processing and consumption to waste stream management | Swanson et al. (2018), Bottani and Bigliardi (2014), Chalyvidis et al. (2013), Najmi and Makui (2012) |
| Time for new product development | ||||
| PF12 | Customer service | Delivery timeliness | Customer service plays a vital role in the performance of the supply chain. An adequate supply chain has to satisfy the expectations of the customer. Actual service, as perceived by the customer, must exceed expectations to create delight. Food chains also have to take into consideration regulations and international standards | Iqbal and Shalij (2016), Iijima and Azuma (2015), Bottani and Bigliardi (2014), Chalyvidis et al. (2013), Najmi and Makui (2012) |
| Response time to customer queries | ||||
| Order compliance |
Research method and results
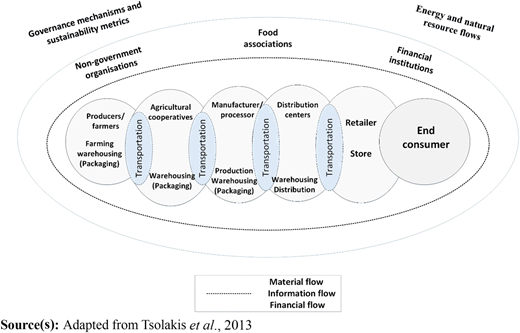
According to the Peruvian Ministry of Agriculture and Irrigation, kiwicha is one of the four crucial Andean grains produced in Peru. This Andean grain, of extraordinary nutritional qualities, has excellent export potential due to its high nutritional value and soft fibre. In addition, sustainability initiatives by all supply chain stakeholders are vital to the agri-food supply chain (Mangla et al., 2018). These initiatives vary across industrial partners, associations, local governments and import/export traders and are essential from start to end of the supply chain. By 2017, kiwicha was mainly exported to Japan, Germany, Brazil, Korea and the United States. Figure 4 presents a model for the agri-food supply chain applied to kiwicha.
Data collection
Supply networks can be difficult to assess, but improved methodologies make them easier to manage by aggregating expert knowledge (Hachicha and Elmsalmi, 2014). Interviews were conducted with two prominent Peruvian cooperatives from five different industries located in the Andean region of Puno and Andean grain academicians from government entities. The interviewees deal with Andean grains, such as quinoa and kiwicha. Their principal supply chain operations include pre-harvest, harvest, post-harvest, storage and local distribution. One expert panel of seven experts in the kiwicha supply chain was composed of two general managers, one agribusiness engineer, two directors of associations, one president of the cooperative and one intermediary. They contributed the information needed to complete the ISM matrix.
ISM and fuzzy MICMAC approach for performance measurement factors
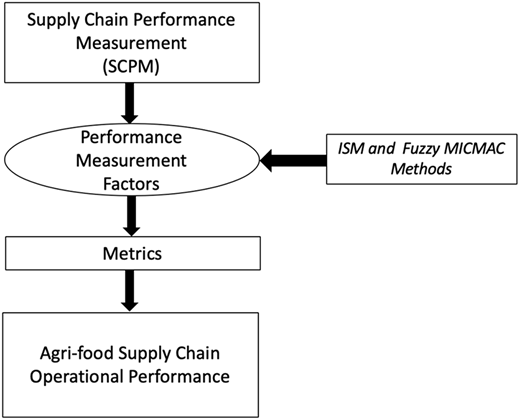
ISM and fuzzy MICMAC method was selected because it enables the study of the diffusion of impacts through reaction paths and loops for developing a hierarchy of performance measurement factors (Bhosale and Kant, 2016; Meena et al., 2017; Sharma et al., 2017). With integrated ISM and fuzzy MICMAC, the performance measurement factors are prioritized (Dube and Gawande, 2016; Shohan et al., 2019; Zhao et al., 2020), and metrics are selected. Thus, this study explores the performance measurement factors for application to the kiwicha grain agri-food supply chain in the Andean region of Peru. Figure 5 illustrates how these concepts and methods are intertwined.
The ISM technique focuses on expert opinion to develop the contextual relationship between various variables. Figure 6 schematises the ISM and the Fuzzy MICMAC process requirements. Four symbols are commonly used to denote the direction of the relationship between the sources (i and j):
V: factor i will aggravate factor j
A: factor i will be aggravated by factor j
X: factors i and j will aggravate each other
O: factors i and j are unrelated.
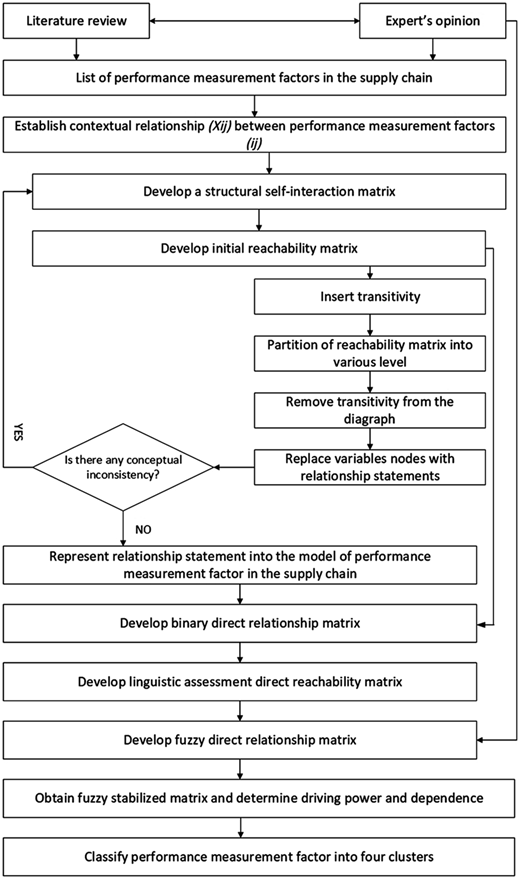
Table 4 shows the structural self-interaction matrix (SSIM) matrix input. A simple comparison was made between every horizontal factor versus all the other factors selected. This matrix is informed by expert opinion to determine the interrelationship type.
Structural self-interaction matrix
| Code | 12 | 11 | 10 | 9 | 8 | 7 | 6 | 5 | 4 | 3 | 2 |
|---|---|---|---|---|---|---|---|---|---|---|---|
| PF1 | V | V | V | V | V | V | V | A | V | V | V |
| PF2 | A | A | A | A | V | V | A | V | X | V | |
| PF3 | A | O | A | A | A | A | A | A | V | ||
| PF4 | A | V | A | V | V | V | A | A | |||
| PF5 | A | V | X | V | V | V | V | ||||
| PF6 | A | O | A | V | V | V | |||||
| PF7 | A | O | A | A | A | ||||||
| PF8 | A | O | O | V | |||||||
| PF9 | A | O | A | ||||||||
| PF10 | A | V | |||||||||
| PF11 | A | ||||||||||
| PF12 |
After the SSIM matrix is complete, the internal reachability matrix (IRM) matrix receives a binary code according to the type of relationship experts selected for each factor. Table 5 shows the results of binary coding for each space on the matrix.
Initial reachability matrix
| Code | 1 | 2 | 3 | 4 | 5 | 6 | 7 | 8 | 9 | 10 | 11 | 12 |
|---|---|---|---|---|---|---|---|---|---|---|---|---|
| PF1 | 1 | 1 | 1 | 1 | 0 | 1 | 1 | 1 | 1 | 1 | 1 | 1 |
| PF2 | 0 | 1 | 1 | 1 | 1 | 0 | 1 | 1 | 0 | 0 | 0 | 0 |
| PF3 | 0 | 0 | 1 | 1 | 0 | 0 | 0 | 0 | 0 | 0 | 0 | 0 |
| PF4 | 0 | 1 | 0 | 1 | 0 | 0 | 1 | 1 | 1 | 0 | 1 | 0 |
| PF5 | 1 | 0 | 1 | 1 | 1 | 1 | 1 | 1 | 1 | 1 | 1 | 0 |
| PF6 | 0 | 1 | 1 | 1 | 0 | 1 | 1 | 1 | 1 | 0 | 0 | 0 |
| PF7 | 0 | 0 | 1 | 0 | 0 | 0 | 1 | 0 | 0 | 0 | 0 | 0 |
| PF8 | 0 | 0 | 1 | 0 | 0 | 0 | 1 | 1 | 1 | 0 | 0 | 0 |
| PF9 | 0 | 1 | 1 | 0 | 0 | 0 | 1 | 0 | 1 | 0 | 0 | 0 |
| PF10 | 0 | 1 | 1 | 1 | 1 | 1 | 1 | 0 | 1 | 1 | 1 | 0 |
| PF11 | 0 | 1 | 0 | 0 | 0 | 0 | 0 | 0 | 0 | 0 | 1 | 0 |
| PF12 | 0 | 1 | 1 | 1 | 1 | 1 | 1 | 1 | 1 | 1 | 1 | 1 |
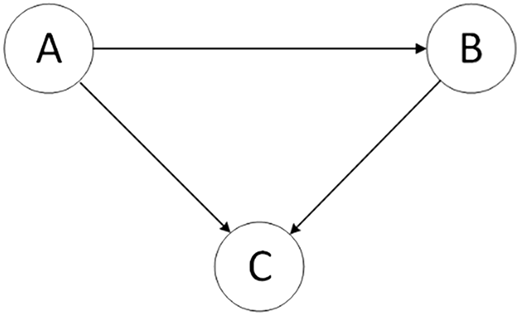
Interrelationships are evaluated to determine the factors that comply with the transition property as shown in Figure 7, which states that factor A is associated with factor B and B is associated with factor C; therefore, factor A is also associated with factor C. The values presented in Table 6 with a “1*” symbol represent new interrelationships.
Final reachability matrix
| Code | 1 | 2 | 3 | 4 | 5 | 6 | 7 | 8 | 9 | 10 | 11 | 12 | Driving power |
|---|---|---|---|---|---|---|---|---|---|---|---|---|---|
| PF1 | 1 | 1 | 1 | 1 | 0 | 1 | 1 | 1 | 1 | 1 | 1 | 1 | 11 |
| PF2 | 1* | 1 | 1 | 1 | 1 | 0 | 1 | 1 | 1* | 1* | 1* | 0 | 10 |
| PF3 | 0 | 1* | 1 | 1 | 0 | 0 | 1* | 1* | 1* | 0 | 1* | 0 | 7 |
| PF4 | 0 | 1 | 1* | 1 | 0 | 0 | 1 | 1 | 1 | 0 | 1 | 0 | 7 |
| PF5 | 1 | 1* | 1 | 1 | 1 | 1 | 1 | 1 | 1 | 1 | 1 | 1* | 12 |
| PF6 | 0 | 1 | 1 | 1 | 1* | 1 | 1 | 1 | 1 | 0 | 1* | 0 | 9 |
| PF7 | 0 | 0 | 1 | 1* | 0 | 0 | 1 | 0 | 0 | 0 | 0 | 0 | 3 |
| PF8 | 0 | 1* | 1 | 1* | 0 | 0 | 1 | 1 | 1 | 0 | 0 | 0 | 6 |
| PF9 | 0 | 1 | 1 | 1* | 1* | 0 | 1 | 1* | 1 | 0 | 0 | 0 | 7 |
| PF10 | 1* | 1 | 1 | 1 | 1 | 1 | 1 | 1* | 1 | 1 | 1 | 0 | 11 |
| PF11 | 0 | 1 | 1* | 1* | 1* | 0 | 1* | 1* | 0 | 0 | 1 | 0 | 7 |
| PF12 | 1* | 1 | 1 | 1 | 1 | 1 | 1 | 1 | 1 | 1 | 1 | 1 | 12 |
| Dependence | 5 | 11 | 12 | 12 | 7 | 5 | 12 | 11 | 10 | 5 | 9 | 3 |
The result is a five-level classification for the factors after the reachability and antecedent set were assessed. Table 7 shows the classification level for each element.
Levels of PFs
| Code | Reachability set | Antecedent set | Intersection set | Level |
|---|---|---|---|---|
| PF3 | 2,3,4,7,8,9,11 | 1,2,3,4,5,6,7,8,9,10,11,12 | 2,3,4,7,8,9,11 | I |
| PF4 | 2,3,4,7,8,9,11 | 1,2,3,4,5,6,7,8,9,10,11,12 | 2,3,4,7,8,9,11 | I |
| PF7 | 3,4,7 | 1,2,3,4,5,6,7,8,9,10,11,12 | 3,4,7 | I |
| PF2 | 1,2,3,4,5,6,7,8,9,10,11 | 1,2,3,4,5,6,8,9,10,11,12 | 1,2,3,4,5,6,8,9,10,11 | II |
| PF8 | 2,3,4,7,8,9 | 1,2,3,4,5,6,8,9,10,11,12 | 2,3,4,8,9 | II |
| PF9 | 2,3,4,5,7,8,9 | 1,2,3,4,5,6,8,9,10,12 | 2,3,4,5,8,9 | II |
| PF11 | 2,3,4,5,7,8,11 | 1,2,3,4,5,6,10,11,12 | 2,3,4,5,11 | III |
| PF6 | 2,3,4,5,6,7,8,9,11 | 1,5,6,10,12 | 5,6 | IV |
| PF1 | 1,2,3,4,5,6,7,8,9,10,11,12 | 1,2,5,10,12 | 1,2,5,10,12 | V |
| PF10 | 1,2,3,4,5,6,7,8,9,10,11 | 1,2,5,10,11 | 1,2,5,10,11 | V |
| PF5 | 1,2,3,4,5,6,7,8,9,10,11,12 | 2,5,6,9,10,11,12 | 2,5,6,9,10,11,12 | VI |
| PF12 | 1,2,3,4,5,6,7,8,9,10,11,12 | 1,5,12 | 1,5,12 | VI |
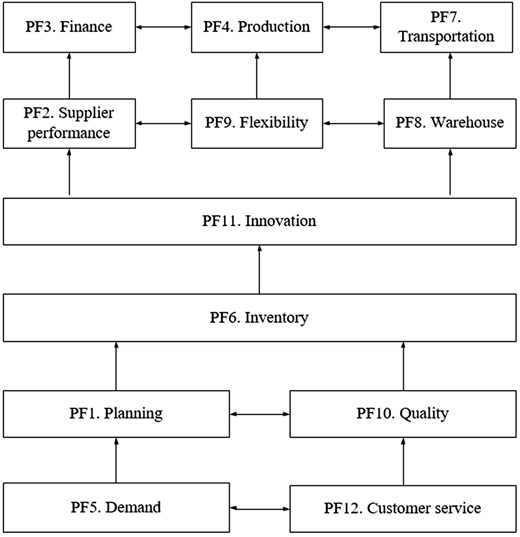
Figure 8 presents the ISM diagram, which brings a visual representation of the assessed interrelationships. The model is based on the final reachability matrix, which uses an arrow to show the association between factor “i” towards factor “j”. The complexity of the system is simplified, thanks to the perspective and prioritization of each factor.
Fuzzy logic
Fuzzy logic is a formal, mathematical, multivalued logic concept, which uses fuzzy set theory and linguistic values (Guersola et al., 2018). Fuzzy logic allows nuances for the grade of membership of elements to a specific set in which detail is associated with a real number as a dimension of the rank of membership of that element to a set and increases the sensitivity of the result (Chandra and Kumar, 2018; Kozarevic and Puska, 2018). This article uses the fuzzy MICMAC method to apply the fuzzy logic to the connections previously establish by ISM with more details since it divides the impact into five grades instead of the binary 0 or 1 (Chen, 2018). Figure 9 presents the critical interpretation aspects of the influence-dependence chart of MICMAC.
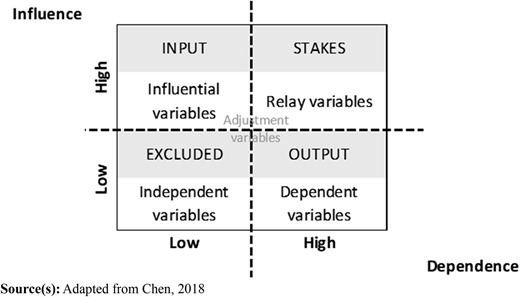
Fuzzy MICMAC includes the following terminology, as seen in Figure 9 (Dalvi and Kant, 2018):
Relay variables
Located in quadrant I, significant influence and high dependence. They influence other variables and are influenced by other variables. These variables are unstable.
Influential variables
Located in quadrant II, represent a strong influence and low dependence. They have a leading role in constructing the entire system and tend to include the system's most variables.
Independent variables
Located in quadrant III, represent the low influence and low dependence. When variables are distributed close to the origin, they do not influence the system's dynamic changes. Still, if they are distributed close to the area of significant influence, the variable will affect the system's effectiveness.
Dependent variables
Located in quadrant IV, represent low influence and high dependence. They are highly sensitive to changes in influential and relay variables and can reflect the effect of influential factors.
Adjustment variables
These variables have the properties of self-regulation and control.
ISM and fuzzy MICMAC integration
Whereas MICMAC considers binary relationships, in fuzzy MICMAC, additional input from other possible interactions between the elements is introduced (Khan and Haleem, 2013; Mohanty, 2018). The fuzzy concept can solve the problem of a binary 0 or 1 choice {0,1} by dividing the impact of the attribute into five grades, as seen in Table 8 (Chen, 2018). The rules of the fuzzy matrix are shown as follows:
Fuzzy scale
| Possibility of reachability | No | Negligible | Low | Medium | High | Very high | Full |
|---|---|---|---|---|---|---|---|
| Value | 0 | 0.1 | 0.3 | 0.5 | 0.7 | 0.9 | 1.0 |
Table 9 presents the binary direct reachability matrix (BDRM), which is obtained from the initial reachability matrix in the ISM by putting a diagonal series of zero values into the correlation matrix and ignoring the transitivity rule to focus only on the direct relationships amongst the factors.
Binary direct reachability matrix
| Code | 1 | 2 | 3 | 4 | 5 | 6 | 7 | 8 | 9 | 10 | 11 | 12 |
|---|---|---|---|---|---|---|---|---|---|---|---|---|
| PF1 | 0 | 1 | 1 | 1 | 0 | 1 | 1 | 1 | 1 | 1 | 1 | 1 |
| PF2 | 0 | 0 | 1 | 1 | 1 | 0 | 1 | 1 | 0 | 0 | 0 | 0 |
| PF3 | 0 | 0 | 0 | 1 | 0 | 0 | 0 | 0 | 0 | 0 | 0 | 0 |
| PF4 | 0 | 1 | 0 | 0 | 0 | 0 | 1 | 1 | 1 | 0 | 1 | 0 |
| PF5 | 1 | 0 | 1 | 1 | 0 | 1 | 1 | 1 | 1 | 1 | 1 | 0 |
| PF6 | 0 | 1 | 1 | 1 | 0 | 0 | 1 | 1 | 1 | 0 | 0 | 0 |
| PF7 | 0 | 0 | 1 | 0 | 0 | 0 | 0 | 0 | 0 | 0 | 0 | 0 |
| PF8 | 0 | 0 | 1 | 0 | 0 | 0 | 1 | 0 | 1 | 0 | 0 | 0 |
| PF9 | 0 | 1 | 1 | 0 | 0 | 0 | 1 | 0 | 0 | 0 | 0 | 0 |
| PF10 | 0 | 1 | 1 | 1 | 1 | 1 | 1 | 0 | 1 | 0 | 1 | 0 |
| PF11 | 0 | 1 | 0 | 0 | 0 | 0 | 0 | 0 | 0 | 0 | 0 | 0 |
| PF12 | 0 | 1 | 1 | 1 | 1 | 1 | 1 | 1 | 1 | 1 | 1 | 0 |
Table 10 presents the fuzzy direct relationship matrix development, which describes a conventional MICMAC analysis using only binary relationships. The fuzzy direct relationship matrix (FDRM) is obtained by superimposing it on the BDRM. The fuzzy matrix multiplication is a generalization of the Boolean matrix multiplication. According to the fuzzy set theory, when two fuzzy matrices are multiplied, the product matrix will also be a fuzzy matrix.
Fuzzy direct reachability matrix
| Code | 1 | 2 | 3 | 4 | 5 | 6 | 7 | 8 | 9 | 10 | 11 | 12 | Total |
|---|---|---|---|---|---|---|---|---|---|---|---|---|---|
| PF1 | 0.0 | 0.9 | 0.9 | 0.7 | 0.0 | 0.5 | 0.9 | 0.7 | 0.7 | 0.7 | 0.7 | 0.7 | 7.4 |
| PF2 | 0.0 | 0.0 | 0.7 | 0.5 | 0.5 | 0.0 | 0.3 | 0.3 | 0.0 | 0.0 | 0.0 | 0.0 | 2.3 |
| PF3 | 0.0 | 0.0 | 0.0 | 0.7 | 0.0 | 0.0 | 0.0 | 0.0 | 0.0 | 0.0 | 0.0 | 0.0 | 0.7 |
| PF4 | 0.0 | 0.3 | 0.0 | 0.0 | 0.0 | 0.0 | 0.1 | 0.3 | 0.3 | 0.0 | 0.1 | 0.0 | 1.1 |
| PF5 | 0.9 | 0.0 | 0.7 | 0.7 | 0.0 | 0.9 | 0.9 | 0.7 | 0.9 | 0.9 | 0.9 | 0.0 | 7.5 |
| PF6 | 0.0 | 0.5 | 0.7 | 0.3 | 0.0 | 0.0 | 0.3 | 0.3 | 0.5 | 0.0 | 0.0 | 0.0 | 2.6 |
| PF7 | 0.0 | 0.0 | 0.5 | 0.0 | 0.0 | 0.0 | 0.0 | 0.0 | 0.0 | 0.0 | 0.0 | 0.0 | 0.5 |
| PF8 | 0.0 | 0.0 | 0.3 | 0.0 | 0.0 | 0.0 | 0.3 | 0.0 | 0.3 | 0.0 | 0.0 | 0.0 | 0.9 |
| PF9 | 0.0 | 0.1 | 0.3 | 0.0 | 0.0 | 0.0 | 0.3 | 0.0 | 0.0 | 0.0 | 0.0 | 0.0 | 0.7 |
| PF10 | 0.0 | 0.7 | 0.9 | 0.7 | 0.7 | 0.7 | 0.7 | 0.0 | 0.5 | 0.0 | 0.7 | 0.0 | 5.6 |
| PF11 | 0.0 | 0.5 | 0.0 | 0.0 | 0.0 | 0.0 | 0.0 | 0.0 | 0.0 | 0.0 | 0.0 | 0.0 | 0.5 |
| PF12 | 0.0 | 0.7 | 0.7 | 0.9 | 0.9 | 0.9 | 0.9 | 0.7 | 0.9 | 0.7 | 0.9 | 0.0 | 8.2 |
| Total | 0.9 | 3.7 | 5.7 | 4.5 | 2.1 | 3.0 | 4.7 | 3.0 | 4.1 | 2.3 | 3.3 | 0.7 |
Fuzzy stabilized matrix
Table 11 shows the Fuzzy MICMAC stabilized matrix; the FDRM is used to obtain the fuzzy MICMAC stabilized matrix. The fuzzy multiplication is repeated until the hierarchies of the driver power and dependence stabilize.
Fuzzy stabilized matrix
| Code | 1 | 2 | 3 | 4 | 5 | 6 | 7 | 8 | 9 | 10 | 11 | 12 | Total |
|---|---|---|---|---|---|---|---|---|---|---|---|---|---|
| PF1 | 0.0 | 0.7 | 0.7 | 0.7 | 0.7 | 0.7 | 0.7 | 0.7 | 0.7 | 0.7 | 0.7 | 0.0 | 7.0 |
| PF2 | 0.5 | 0.0 | 0.5 | 0.7 | 0.0 | 0.5 | 0.5 | 0.5 | 0.5 | 0.5 | 0.5 | 0.0 | 4.7 |
| PF3 | 0.0 | 0.3 | 0.0 | 0.0 | 0.0 | 0.0 | 0.1 | 0.3 | 0.3 | 0.0 | 0.1 | 0.0 | 1.1 |
| PF4 | 0.0 | 0.1 | 0.3 | 0.0 | 0.3 | 0.0 | 0.3 | 0.3 | 0.3 | 0.0 | 0.0 | 0.0 | 1.6 |
| PF5 | 0.0 | 0.9 | 0.9 | 0.7 | 0.0 | 0.7 | 0.9 | 0.7 | 0.7 | 0.7 | 0.7 | 0.7 | 7.6 |
| PF6 | 0.0 | 0.3 | 0.5 | 0.7 | 0.5 | 0.0 | 0.3 | 0.3 | 0.3 | 0.0 | 0.1 | 0.0 | 3.0 |
| PF7 | 0.0 | 0.0 | 0.0 | 0.5 | 0.0 | 0.0 | 0.0 | 0.0 | 0.0 | 0.0 | 0.0 | 0.0 | 0.5 |
| PF8 | 0.0 | 0.1 | 0.3 | 0.3 | 0.0 | 0.0 | 0.3 | 0.0 | 0.0 | 0.0 | 0.0 | 0.0 | 1.0 |
| PF9 | 0.0 | 0.0 | 0.3 | 0.3 | 0.1 | 0.0 | 0.1 | 0.1 | 0.0 | 0.0 | 0.0 | 0.0 | 0.9 |
| PF10 | 0.7 | 0.5 | 0.7 | 0.7 | 0.5 | 0.7 | 0.7 | 0.7 | 0.7 | 0.0 | 0.7 | 0.0 | 6.6 |
| PF11 | 0.0 | 0.0 | 0.5 | 0.5 | 0.5 | 0.0 | 0.3 | 0.3 | 0.0 | 0.0 | 0.0 | 0.0 | 2.1 |
| PF12 | 0.9 | 0.7 | 0.7 | 0.7 | 0.7 | 0.9 | 0.9 | 0.7 | 0.9 | 0.9 | 0.9 | 0.0 | 8.9 |
| Total | 2.1 | 3.6 | 5.4 | 5.8 | 3.3 | 3.5 | 5.1 | 4.6 | 4.4 | 2.8 | 3.7 | 0.7 |
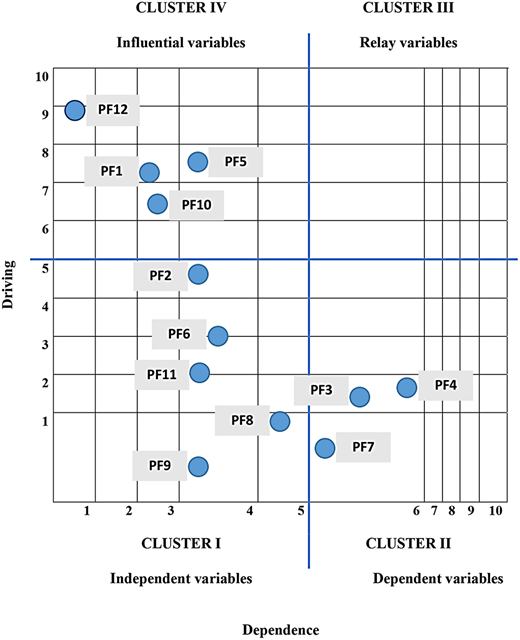
A factor analysis of the influence-dependence chart is performed. According to their clustered locations on the grid, variables are classified as follows in Figure 10 (Chen, 2018).
Discussion
This research was focused on the Peruvian kiwicha agri-food supply chain to identify the basic requirements for a successful supply performance measurement and the right approach to measure them. The final selection resulted in twelve performance measurement factors and their metrics. The ISM method provides a diagram of the various relations by separating them into levels. Simultaneously, fuzzy MICMAC classified each factor into a cluster, helping the decision-making process regarding performance measurement be done faster and more accurately.
The ISM classification determined a hierarchy of six performance measurement levels as per their interrelationships, direct and multilevel dependencies. Level VI considers demand and customer service as the factors with the highest driving power confirming customers' vital role and the necessity to respond quickly to uncertainty since the market is quite competitive. Level V contains planning and quality; both are related to useful resource utilization, product and process quality and greatly impact the firms' success. In the middle section, level IV considers inventory, and level III measures innovation, showing the necessity of managing the physical goods and continuously improving its products and processes. The following levels are dependent on the previously mentioned factors: level II includes supplier performance, warehouse and flexibility while level I contains the lowest driving power factors: finance, production and transportation.
The analysis of fuzzy MICMAC is according to the four clusters the method describes. First, Cluster I for “independent variables” considers supplier performance, inventory, flexibility, warehouse and innovation. This category's factors do not influence the system since they have few links, but they are highly unstable and affect the supply chain performance. These are the least critical factors and require relative attention.
Cluster II is for “dependent variables,” which have a weak driving power but strong dependence on other factors. Only three key factors – finance, production and transportation – are the performance measurement factors in this category. Other factors highly influence these variables, and therefore do not need to receive much attention.
Cluster III for “relay variables” has no performance measurement factors in this category. These variables are characterised by establishing a linkage between driving and dependence measures. Likewise, these measures help integrate all the supply chain systems and enhance the model performance.
Cluster IV for “influential variables” includes the performance measurement factors with durable driving power and weak dependence. The four factors considered in our study context are customer service, demand, planning and quality; they significantly affect the supply chain performance measurement. Managers should consider these factors in the strategic and operational supply chain plan since these are the most critical ones. Industry practitioners need to consider these key factors to improve the operational performance in the Peruvian agri-food supply chain context.
Changes in any of the “relay” or “influential” variables are very likely to cause substantial increases in the intensity of the change on other variables. Those changes should be avoided unless they are necessary for achieving the desired performance. There is correspondence in the interrelationships establish by ISM and fuzzy MICMAC. The tendency is that each factor's driving and dependence power presents the same trend in both methods.
Implications for practice
Managers seek to understand the complex processes in the agri-food supply chain from a holistic perspective. However, this holistic view can sometimes lead to an analysis of too many factors, some of which might be of limited importance. The results of this research demonstrate that each factor has a different scale of impact in the kiwicha agri-food supply chain. Practitioners and industry decision-makers can now assess factors in the same level obtained from ISM as a whole and simplify their overall analysis. MICMAC results provide a more nuanced understanding of the effect the factors could have; this is crucial when deciding where to direct management attention and resourced aimed toward increasing or maintaining performance.
Specifically, from a total of 12 factors identified in literature and validated by experts, four are considered to have the most significant impact on performance and thus should be given greater attention. The influential factors such as “customer service”, “demand”, “planning” and “quality” should receive special consideration when developing PMS. In contrast, the dependence factors of “finance”, “production”, and “transportation” could be seen as secondary-level factors under the influential factors.
ISM establishes demand and customer service as the factors with the highest driving power. These results have significant implications for managers seeking to identify ways to manage supply chains, demand management and customer service policy to create sustainable agri-food supply chains in the Andean region of Latin America. In other words, if the product does not match customer demands, it results in negative supplier and customer relationships. Managers can use our results as the basis for further analysis focusing on environmental, economic and political risks in their supply chain framework.
In summary, managers and top industry leaders can better identify the critical factors to consider when allocating resources and their attention to achieving their supply chain vision. Also, the findings can inform farmers and other stakeholders on areas in which they could direct resources to increase their own internal performance.
Implications for theory and future research
The study contributes to theory on PMS within the agri-food industry by developing and testing a performance measurement framework based on a mixed-method research approach. The preponderance of previous research on PMS focuses on supply chains in large corporations, while only a few are related to the smaller communities that comprise the agri-food supply chain, especially for niche products that lack scale (Frederico et al., 2020; Mishra et al., 2018; Sahoo, 2020). This research assimilates and tests a set of factors and associated metrics into one theory of PMS to satisfy the context of the agri-food supply chains in a developing country (specifically Peruvian kiwicha, which is a superfood gaining a lot of attention and market share in recent years) (Martinez-Lopez et al., 2020; Coelho et al., 2018).
This study on the Peruvian food supply chain suggests many of the factors to consider when working with diverse stakeholder groups interested in improving operational performance. This paper has shown customer and demand management are critical factors. However, future research could discover new means to increase sustainability in food supply chains, especially in Latin American countries, which have been shown to have more complexity, economic risk and political challenges.
Limitations and conclusions
The method employing ISM with Fuzzy MICMAC is limited to identifying the performance measurement factors in the kiwicha industry and to expert decisions-making findings variable to the context of the study. This research focuses on a framework to apply to the agri-food chain and encourages future studies to go more in-depth on each factor's sub-metrics. Future research could include integration and collaboration in the food supply chain, as these topics correspond directly to demand management and customer service. Sustainably integrating the agri-food supply chain could also be managed by various methods, both empirical and analytical.
New studies can also improve accuracy or validate the model (Gardas et al., 2018) with other multicriteria decision-making approaches such as ANP, ELECTRE, TOPSIS (Govindan et al., 2017) and VIKOR to compare the different results. Other complementary studies could be applied ISM, DEMATEL for analysing the interactions among and between the measures; thus, modelling the agri-food supply chain will be more feasible and reinforced. This research can contribute to optimizing the supply chain operational performance through the management mainly of its demand and customer service, among other factors. These key measures prioritize customer-centricity (customer service, demand and planning measures were previously determined) will help the industry develop the global market and advance the local agri-food industry.

