
ABSTRACT
The seismic assessment of large dams is key to understanding the response and safety of the structure in the event of an earthquake. As there is a considerable risk of seismic activity in Oman, major infrastructures with immense socioeconomic importance such as the Wadi Dayqah Dam need to be assessed and monitored adequately. Although the Oman Seismic Code (OSC) outlines the country-specific seismic motion parameters, the design guidelines primarily apply to buildings with a maximum height of 60 m. Moreover, seismic behaviour of structures is generally not accounted for as a design practice in Oman. Considering these facts, the current research is aimed at undertaking an assessment of the sliding stability of Wadi Dayqah Dam subjected to seismic actions. A computational model of the dam was built using the RS-DAM package, which can carry out a pseudo-dynamic rigid body analysis of dams. The historical record of the Taft earthquake in 1952 was employed in the RS-DAM framework to simulate seismic loads on the dam and compute the relative displacements and factors of safety against sliding at the dam-foundation interface. The effects of hydrostatic, hydrodynamic, uplift and anchorage forces on the dam were also considered. One of the noteworthy highlights from the results was that in most of the cases analysed the factor of safety against sliding dropped below 1.0 at a specific time in the duration of the seismic loading. Furthermore, the most influential parameters controlling the sliding displacements were the spectral acceleration imposed onto the dam and friction coefficients at the dam-foundation interface. It was also observed that the addition of anchorage forces significantly assisted in reducing the duration of sliding motion and improved the sliding safety factors to within tolerable limits. The findings of this research may ultimately serve as a preliminary guidance for predicting the sliding response of Wadi Dayqah Dam under seismic loads.
Notation
- b, bc
width of dam base and width dam crest, respectively
- F(t)
frictional resistance of dam-foundation interface
- h, hd
height of reservoir and height of dam, respectively
- Hs, Hd(t)
hydrostatic and hydrodynamic forces on the dam, respectively
- M, Mw
mass of dam and Westergaard’s mass effect of reservoir, respectively
- s, ṡ, s̈
displacement, velocity, and acceleration of the dam base, respectively
- S(t)
shear force on dam-foundation interface
- t
elapsed time of seismic loading
- U
uplift force subjected to the dam
- ẍg
horizontal ground acceleration
- z
vertical depth from reservoir surface to point of hydrodynamic force
- μs, μd
coefficients of static and dynamic friction, respectively
1 Introduction
Ground movements resulting from seismic activities or blasts present a formidable challenge in the assessment of large rigid structures such as high-rise frames and roller compacted concrete (RCC) gravity dams. Particularly with dams, the complexity is increased when taking into consideration factors such as geometry of the dam, mass of the reservoir, magnitude of earthquake loads, peak ground accelerations and topography. Due to its essential functions (electricity generation, water supply, flood control, etc.), the safety evaluation of dams under seismic loads is an important practice globally in the design, monitoring and maintenance phases. Under seismic loading, a large crack may develop at the dam-foundation interface resulting in a weak failure plane and causing instability of the dam, such as sliding or overturning (Fenves and Chaves, 1996). Seepage of water through the interface crack can then exert uplift pressures on the dam, further weakening the structure.
Newmark (1965) was one of the early hallmark studies that facilitated the understanding of the seismic behaviour of dams by way of the sliding block method. This method, described by Figure 1, is the basis of most current analytical and numerical models used to predict the displacement of dams under seismic loads. Given that the block is initially at rest on an inclined plane, the slipping condition is induced at any time (t) that an applied horizontal acceleration k(t)*g exceeds the minimum acceleration (yield) required to cause the block to displace. Since the applied acceleration is cyclic, the displacement will continue until the velocity of the block reaches zero. The total displacement is computed as the summation of all the partial slips at each increment of time.
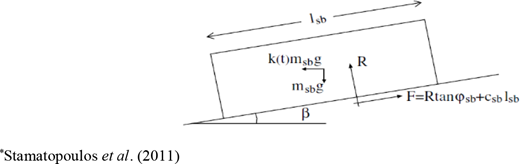
Newmark’s sliding block model*
Overtime, a significant number of studies have modified Newmark’s method to investigate stability issues of RCC gravity dams, including:
Hydrodynamic effects combined with seismic action (Chopra and Zhang, 1991);
Sliding response of gravity dams including vertical seismic accelerations coupled with historical ground motion (Christopoulos et al., 2003);
Nonlinear modelling of dam-water-foundation interaction (Basili and Nuti, 2011);
Impact of seismic shaking parameters and site characteristics on the seismic performance of earth dams (Luu et al., 2016);
Development of a Nested Newmark Model (NNM) to assess the post-earthquake slope profile of embankment slopes (Leshchinsky, 2018).
Several studies based on finite element methods have also addressed other key aspects that the traditional sliding block method does not consider, such as:
Spatial variations in ground excitations over extended structures (Huang, 2011);
Deep cracks penetrating into the dam monolith (Jiang and Du, 2012);
Discontinuities arising at the interface of masonry units, dam-rock interface or rock mass joints (Bretas et al., 2016);
Shear sliding of vertical contraction joints of high arch dams (Guo et al., 2020);
Uncertainties in the design parameters such as friction coefficient and cohesion (Liang et al., 2020).
Due to the semi-arid environmental conditions in Oman, the government has spent great efforts to develop dams at critical locations across the country, which not only serve to store precious water resources, but also act as mitigation measures against recurring flash floods. Currently, the largest dam in Oman is Wadi Dayqah Dam (Figure 2) which was constructed in 2009 and is situated in the town of Qurayyat, Governate of Muscat. The structure comprises of a main dam and a saddle dam forming the reservoir – with the main RCC gravity dam spanning more than 400 m in length at a height of 75 m, and supplying up to 35 million m3 of water per annum. The 1500 km2 catchment enclosing Wadi Dayqah is particularly unique as it experiences rainfall on average 148 mm/year, often through severe storms, with sporadic flash floods recorded in most months (Prisk et al., 2009).

Photographs of Oman’s Wadi Dayqah Dam
Considering its socioeconomic importance, it would be prudent to investigate the performance of Wadi Dayqah Dam under seismic loadings. The geology of Northern Oman (near the location of Wadi Dayqah Dam) is dominated by the Hajar Mountains, which extends from 30 to 50 km (Figure 3). According to El-Hussain et al. (2018), the Hajar Mountains are susceptible to small to moderate-size seismic activity. In fact, owing to this geographical position Wadi Dayqah Dam falls in an active zone of the Arabian plate. The seismotectonic settings around Oman (Figure 4) suggest that it may also be susceptible to considerably large earthquakes which can significantly damage major structures (El-Hussain et al., 2012). While most of the strong seismic activities have been recorded offshore (approximately 5 earthquakes annually (Al-Sayed, 2017)), studies show that the design earthquake may be associated with a 10% probability of exceeding the maximum median ground motion in 50 years (Deif et al., 2013). Seismic design is predominantly dependent on such national records, and the current design practice in Oman overlooks seismic effects on structures (Al-Sayed, 2017). It was on this basis, along with a series of seismic studies conducted by Sultan Qaboos University (El-Hussain et al., 2012, 2013, 2014), that necessitated the development of the first Oman Seismic Code (OSC) (2013). However, the OSC (2013)) has primarily been established for the design of reinforced concrete, steel, composite and masonry buildings not exceeding 60 m (Waris et al., 2017), and is yet to be modified for the seismic design of dams. The significance of these facts alone calls for a greater awareness of the seismic behaviour of dams in Oman, of which there have been no such studies reported, to the best of the authors’ knowledge. Therefore, it is the objective of this research to assess Wadi Dayqah Dam under seismic loadings, with particular focus on the sliding stability.
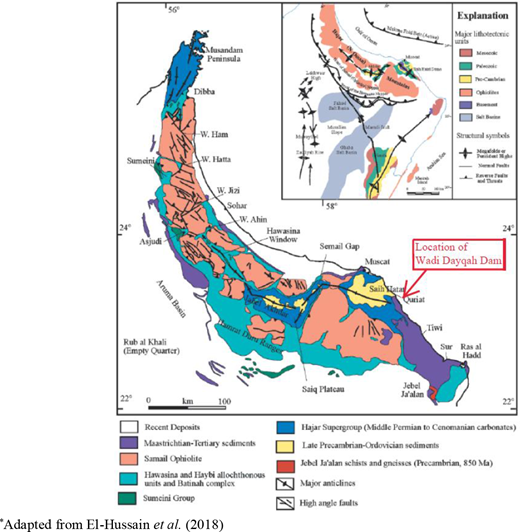
Geological map of Northern Oman showing Hajar Mountains and the location of Wadi Dayqah Dam*
Geological map of Northern Oman showing Hajar Mountains and the location of Wadi Dayqah Dam*
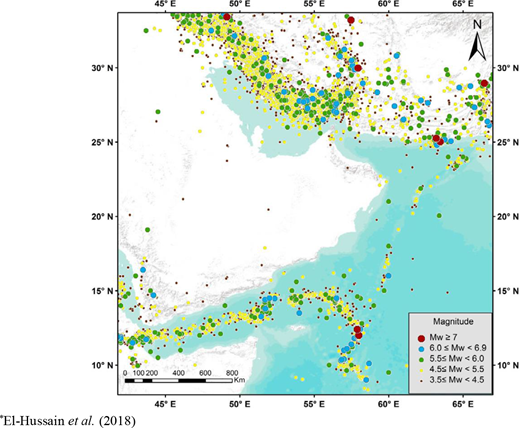
Recorded seismicity around Oman from 1900 to 2015*
2 Methodology
A computational package known as RS-DAM (Leclerc et al., 2002) was implemented to model the dam and carry out a pseudo-dynamic rigid body analysis. RS-DAM is based on the modified sliding block model and executes a Nemark-Beta integration procedure to determine the seismic responses. Horizontal excitations were introduced to the dam-reservoir-foundation system by adopting the 1952 Taft earthquake accelerogram (available as open source) and scaling it to the corresponding zonal spectral accelerations (SA) in accordance with OSC (2013)) (in the range of low – moderate – high actions). The seismic response of the dam was measured in terms of the relative displacements at the base of the dam and the factor of safety against sliding. The effects of friction coefficients as well as hydrostatic, hydrodynamic, uplift and anchorage forces were examined.
3 Sliding block model
To investigate the seismic response of Wadi Dayqah Dam, the current study adopts the modified sliding method derived from Chopra and Zang (1991), which is generally regarded as the basis for most approaches to rigid body dynamics. The concrete dam is idealized as a rigid block in Figure 5 with a mass (M), height (hd), base width (b) and crest width (bc), supported by a flexible foundation and impounding a reservoir of height (h). A horizontal ground acceleration ẍg is applied to the system to simulate a seismic loading. The response of the block at any time (t) can be measured by the relative displacement s, velocity ṡ and acceleration s̈ at the base of the dam.
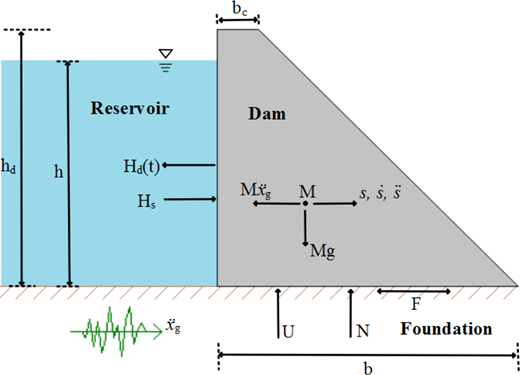
Dam-reservoir-foundation system
For the purposes of this study, the sliding stability of the dam is inspected at the dam-foundation interface, i.e., the plane of failure. Based on the Mohr-Column principle, the sliding will initiate at any time (t) when the shear force (S(t)) exceeds the frictional resistance (F(t)) along the interface:
where Hs and Hd(t) are the hydrostatic and hydrodynamic forces exerted by the reservoir; μ is the friction coefficient (static μs – at rest; dynamic μd – sliding); U is the uplift force subjected from the foundation. The hydrodynamic force is often computed using Westergaard’s (1933) formulation based on the added mass effect of the reservoir (Mw):
where z is the vertical depth from the surface of the reservoir to the point of application of the hydrodynamic force. Note that ε in Equation (2) is a sign factor taking into consideration the direction of the frictional resistance. At rest, the frictional resistance acts in the opposite direction to the shear force, i.e., ε = −S/|S|. As the block is sliding, the frictional resistance is opposing the direction of the sliding velocity, i.e., ε = −ṡ/|ṡ|.
4 Computational implementation
In this study, the computational package RS-DAM, originally developed by Leclerc et al. (2002), is implemented to assess the seismic response of Wadi Dayqah Dam. The operations carried out by RS-DAM are based on the sliding block model (see Section 2).
4.1 Integration method
RS-DAM computes the relative acceleration of the dam using the unbalanced dynamic forces (S + F) and the mass of the system (M + Mw):
The responses are determined at each time step (Δt) using the initial conditions of displacement (s0) and velocity (ṡ0) at the beginning of each time step:
RS-DAM employs a Newmark-Beta step-by-step method (Leclerc et al., 2002) in performing the integrations in Equations (4) to (6). During each time step, the system parameters are assumed to be constant (e.g. mass, friction coefficient and loads remain unchanged). This approach is nonlinear as it involves solving a sequence of linear equations for a changing system.
4.2 Model input
To generate the seismic load on the dam, this study adopted the horizontal acceleration record of the 1952 Taft earthquake, California, USA, which measured at a magnitude of 7.3 on the Richter scale. The corresponding accelerogram, displayed in Figure 6 with a peak ground acceleration 0.179g, was loaded into the RS-DAM model.
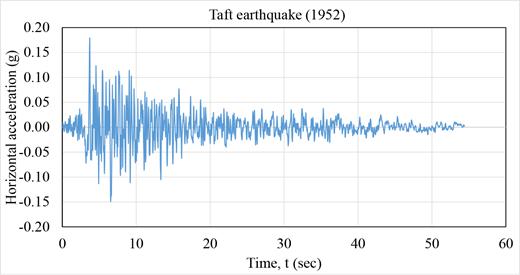
Accelerogram of Taft earthquake (1952)
The relevant input parameters of Wadi Dayqah Dam were also obtained from Prisk et al. (2009) and Hieatt et al. (2010) and summarized in Table 1. Analyses were performed per 1 m length (L) of the dam. The reservoir level was selected based on a 1:1000 flood frequency (Prisk et al., 2009). Any openings, drainage gallery or additional masses (e.g., fixed equipment) on the dam were ignored in the analysis. Furthermore, variable friction coefficients (0.5 – 1.0) were applied to the model to investigate the variation in responses.
Specifications of the Wadi Dayqah Dam required for RS-DAM
| Parameter | RS-DAM input |
|---|---|
| RCC density (ρc) | 2500 kg/m3 |
| Reservoir density (ρw) | 1000 kg/m3 |
| Total dam height (hd) | 75 m |
| Total base width (b) | 55 m |
| Total dam length (L) | 410 m |
| Crest width (bc) | 5 m |
| Reservoir level (h) | 72.5 m |
| Concrete cohesion (c) | 600 kPa |
| Static friction coefficient (μs) | 0.5 – 1.0 |
| Dynamic friction coefficient (μd) | 0.5 – 1.0 |
| Elastic spectral accelerations (SA) | 0.1 – 0.5 |
According to OSC (2013)), the design earthquake is characterized by a probability of exceedance of 10% in 50 years, which corresponds to a return period of 475 years. Based on this, the elastic spectral accelerations (SA) for different seismic zones and soil classes in Oman are defined in Clause 1.3 of OSC (2013)). The ranges of short period SA in Table 1 were selected for Zone 1 (Muscat) and soil classes A-F.
5 Results and discussions
5.1 Validation using an example of a triangular dam
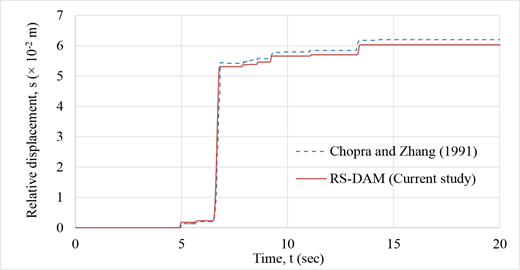
To validate the methodology employed in this study, one of the classical examples in Chopra and Zhang (1991) is considered. The geometry of the dam is triangular, with the dam height (hd) at 60.96 m, equal to the reservoir level, and base width 48.77 m (Note: all parameters were converted to metric units). The coefficients of friction were equal to 1.0, i.e., μs = μd = 1.0. Both hydrostatic and hydrodynamical effects were included in the analysis, as well as an uplift force of 5586. kN exerted by the foundation. The seismic load on the dam was induced by the Taft (1952) accelerogram in Figure 3 amplified to a peak ground acceleration of 0.5g.
The relative displacement of the dam as predicted by Chopra and Zhang (1991) and the current study (RS-DAM) is shown in Figure 7. Comparatively, the predictions of the sliding behaviour of the dam are in very close agreement, particularly in the period when displacements begin to diverge rapidly (t = 5–7 s). The maximum displacement recorded by the two predictions are 6.20×10⁻² m and 6.03×10⁻² m, respectively, corresponding to a 2.6% difference. These results also conform with the observations of Leclerc et al. (2002).
5.2 Effect of spectral acceleration
As per the OSC (2013)) guidelines, the elastic spectral accelerations (SA) in Oman are set in the range 0.1g – 0.5g. Hence, three different SA’s on the Wadi Dayqah Dam model were considered: 0.1g (low action), 0.3g (moderate action) and 0.5g (high action). These were achieved by amplifying the 1952 Taft accelerogram in Figure 6 to a scaling factor of 0.559, 1.676 and 2.793, respectively.
Figure 8 displays the relative displacement (s) of the dam as a function of time (t). The coefficients of static and dynamic friction were both set to 0.5. It is apparent that the effect of SA on the displacement is substantial, as the displacements increase by an order of magnitude of one and two with increasing strength of the earthquake from 0.1g, 0.3g and 0.5g, respectively. All three relationships indicate a gradual increase of displacements over time. Furthermore, the sliding duration is prolonged to a greater extent with increasing SA. At 0.1g, the sliding behaviour terminates within the first 10s, while at 0.2g the sliding is dominant for the first 20s, and at 0.5g the sliding continues for more than 40s. A longer duration of motion generally allows more stresses and cracks to develop in the dam.
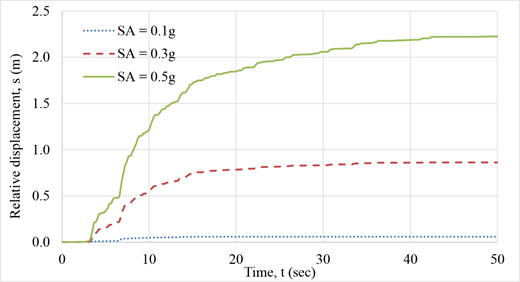
Sliding displacements for varying spectral accelerations (SA)
Table 2 summarizes the maximum displacement (smax) and minimum factor of safety (FSmin) experienced by the dam in the duration of the seismic loading. It is evident that the displacements and the safety factors increase and decrease significantly, respectively, at each 0.1g increment of the SA. On the contrary, the displacements seem to decrease with increasing friction coefficient (μ), but the safety factors increase. However, the safety factors fall below 1.0 in most cases, which is considerably lower than the acceptable safety factor of 1.5 – 2.0 for sliding stability in most design standards.
Maximum displacements and minimum safety factors for varying spectral accelerations (SA) and friction coefficients (μ)
| Spectral acceleration (SA) | ||||||
|---|---|---|---|---|---|---|
| 0.1g | 0.2g | 0.3g | ||||
| Friction coefficient (μ) | smax (m) | FSmin | smax (m) | FSmin | smax (m) | FSmin |
| 0.5 | 0.058 | 0.843 | 0.862 | 0.592 | 2.226 | 0.456 |
| 0.6 | 0.000 | 1.012 | 0.083 | 0.711 | 0.440 | 0.548 |
| 0.7 | 0.000 | 1.181 | 0.019 | 0.829 | 0.120 | 0.639 |
| 0.8 | 0.000 | 1.349 | 0.002 | 0.948 | 0.049 | 0.730 |
| 0.9 | 0.000 | 1.518 | 0.000 | 1.066 | 0.021 | 0.822 |
| 1.0 | 0.000 | 1.687 | 0.000 | 1.184 | 0.006 | 0.913 |
5.3 Effect of uplift forces
In this section, a series of separate uplift forces (U) were subjected to the Wadi Dayqah Dam model: 1000 kN, 2000 kN and 4000 kN to represent the possibility of pore-water pressure developing at the dam-foundation interface. The uplift forces were exerted at a distance of 15 m from the heel of the dam. Downstream water levels were ignored in determining the uplift pressures on the dam. The spectral acceleration was set to 0.3g.
The relative displacements (s) for changing uplift forces are depicted in Figure 9. The fiction coefficient was taken to be 0.7. As expected, when compared to no uplift force (0 kN), the displacements tend to increase by a factor 1 – 2 as the uplift forces are increased from 1000 kN, 2000 kN and 4000 kN, respectively. This is because of the reduction in the effective weight of the dam due to the uplift forces, consequently also reducing the restoring forces. The overall sliding behaviour, however, is similar in that the motion is terminated at about 12s for all uplift force cases. Also, a rapid increase in displacement is observed at approximately time of 7s, indicating that it may correspond to the time when the dam becomes most unstable.
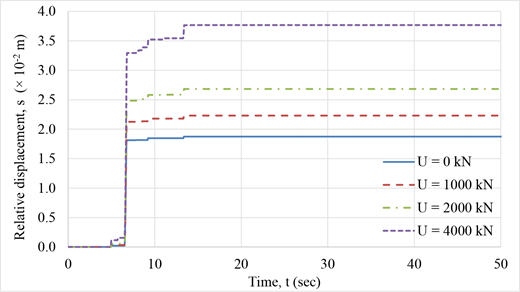
Sliding displacements for varying uplift forces (U)
In Table 3, the effect of uplift forces and friction coefficients on the maximum displacements (smax) and minimum safety factors (FSmin) can also be inspected. The displacements increase more significantly with a decrease in friction coefficient as compared to an increase in uplift force, a similar pattern to that of Table 2. The safety factors, however, display an opposite pattern as they increase with increasing friction coefficients, but decrease with increasing uplift forces. For high friction coefficients (0.9 – 1.0), the safety factors are maintained at > 1.0, however for lower friction coefficients the safety factors gradually decrease to about 0.55. It is important to note that while the safety factor at the end of the seismic load simulation may again exceed 1.0, it is the minimum safety factor exhibited at any time during the simulation that dictates the stability of the dam.
Maximum displacements and minimum safety factors for varying uplift forces (U) and friction coefficients (μ)
| Uplift force (U) | ||||||||
|---|---|---|---|---|---|---|---|---|
| 0 kN | 1000 kN | 2000 kN | 4000 kN | |||||
| Friction coefficient (μ) | smax (m) | FSmin | smax (m) | FSmin | smax (m) | FSmin | smax (m) | FSmin |
| 0.5 | 0.862 | 0.592 | 1.152 | 0.582 | 1.638 | 0.571 | 36.013 | 0.549 |
| 0.6 | 0.083 | 0.711 | 0.104 | 0.698 | 0.132 | 0.685 | 0.212 | 0.659 |
| 0.7 | 0.019 | 0.829 | 0.022 | 0.814 | 0.027 | 0.799 | 0.038 | 0.769 |
| 0.8 | 0.002 | 0.948 | 0.004 | 0.930 | 0.005 | 0.913 | 0.010 | 0.879 |
| 0.9 | 0.000 | 1.066 | 0.000 | 1.047 | 0.000 | 1.027 | 0.000 | 0.989 |
| 1.0 | 0.000 | 1.184 | 0.000 | 1.163 | 0.000 | 1.142 | 0.000 | 1.099 |
5.4 Effect anchorage forces on stabilization
To investigate a stabilizing factor on the Wadi Dayqah Dam model, anchorage forces were considered, which can ideally be delivered using post-tension cables. In this study, the cables were assumed to be drilled at mid-point of the crest width and penetrates through the foundation at 2.5 m from the heel. The anchorage forces (A) were varied from 5 MN, 10 MN, 20 MN and 50 MN. The forces were applied directly at the dam-foundation interface per 1m length of the dam. The spectral acceleration is set to 0.3g and an uplift force of U = 2000 kN is applied.
The effect of the anchorage forces (A) on the relative displacements (s) is illustrated in Figure 10, corresponding to a friction coefficient of 0.5. Clearly, the inclusion of anchorage forces significantly reduces the displacements on the dam, approximately by an order of magnitude of two at the maximum anchorage force level (20 MN). In the case of no anchorage force (0 MN), the sliding motion is continued gradually almost throughout the full duration of the applied seismic load (> 50s). This sliding behaviour is notably improved as the anchorage forces are implemented, controlling the sliding to approximately 8 – 15s.
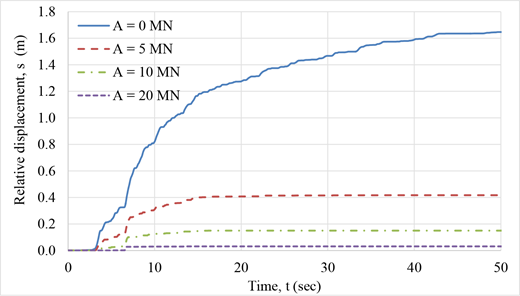
Sliding displacements for varying anchorage forces (A)
Table 4 highlights how the magnitude of anchorage forces improve the maximum displacements (smax) and minimum factors of safety (FSmin). As predicted, the displacements are reduced by one order of magnitude at each increase of anchorage force 10 MN, 20 MN and 50 MN, respectively. In the case of no anchorage force (0 MN), the safety factor falls below 1.0 for the range of friction coefficients 0.5 – 0.8, while for friction coefficients of 0.9 – 1.0 the safety factor is just above 1.0. An anchorage force of 50 MN is required to raise the safety factor to > 1.0 for lower friction coefficients of 0.5 – 0.6. For higher friction coefficients of 0.7 and above, an anchorage force of 10 – 20 MN is sufficient to increase the safety factor to > 1.0. In summary, for design purposes and to achieve acceptable safety factor levels, anchorage forces need to be increased as the friction coefficient decreases. However, it is also worthwhile to note that the anchorage forces are considerably larger than the uplift force in this example, which should be taken into consideration when explaining the effectiveness in improving the displacements and safety factors. While the economics and viability are usually examined in selecting a stabilizing option for dams, such as post-tension cables, these factors are not prevailing for the purposes of this study and are therefore not considered.
Maximum displacements and minimum safety factors for varying anchorage forces (A) and friction coefficients (μ)
| Anchorage force (A) | ||||||||
|---|---|---|---|---|---|---|---|---|
| 0 MN | 10 MN | 20 MN | 50 MN | |||||
| Friction coefficient (μ) | smax (m) | FSmin | smax (m) | FSmin | smax (m) | FSmin | smax (m) | FSmin |
| 0.5 | 1.638 | 0.571 | 0.150 | 0.678 | 0.031 | 0.786 | 0.000 | 1.108 |
| 0.6 | 0.132 | 0.685 | 0.023 | 0.814 | 0.003 | 0.942 | 0.000 | 1.329 |
| 0.7 | 0.027 | 0.799 | 0.002 | 0.949 | 0.000 | 1.100 | 0.000 | 1.550 |
| 0.8 | 0.005 | 0.913 | 0.000 | 1.085 | 0.000 | 1.257 | 0.000 | 1.772 |
| 0.9 | 0.000 | 1.027 | 0.000 | 1.221 | 0.000 | 1.414 | 0.000 | 1.994 |
| 1.0 | 0.000 | 1.142 | 0.000 | 1.356 | 0.000 | 1.571 | 0.000 | 2.215 |
6 Conclusion
Most existing large structures in Oman, such as Wadi Dayqah Dam, have been designed without much focus on its seismic behaviour (Al-Sayed, 2017). However, recent research indicates that there is an adequate basis for the consideration of seismic loads on structures (El-Hussain et al., 2012). Therefore, seismic assessment of existing dams is an integral step in the reduction and mitigation of seismic risks, particularly in a country like Oman where water resources are invaluable and flash floods are common.
In this study, the sliding stability of Wadi Dayqah Dam under seismic loads was investigated. The computational modelling of the dam was achieved with the aid of RS-DAM (Leclerc et al., 2002), which was used to perform a pseudo-dynamic rigid body analysis of the dam. The seismic loading of the dam was simulated using the historic data of the 1952 Taft earthquake. The main findings of the study are summarised as follows:
The magnitudes of sliding displacements are strongly influenced by the spectral acceleration and friction coefficients (static and dynamic).
Higher spectral accelerations induced on the dam will lead to a longer duration of sliding motion, which may lead to further cracks and stress build-up.
In most cases analysed, the minimum factor of safety against sliding fell below 1.0 at a specific time within the duration of the seismic loading.
For low coefficient of frictions (≤ 0.6), a gradual increase in the uplift forces (subjected to the base of the dam) can significantly increase the maximum displacements and reduce the sliding factor of safety. This may be due to the fact that as the frictional resistance is reduced below a certain threshold, the slipping condition is induced much quicker and more severely.
Anchorage forces can substantially facilitate in the controlling of sliding motion of the dam (i.e. reduce the time duration of sliding), and further stabilize the dam to acceptable levels of safety factors against sliding.
Moreover, the outcomes of this research provide a clear indication of how the Wadi Dayqah Dam may perform in terms of sliding under the potential seismic loads in accordance to the Oman Seismic Code (OSC) (2013). Although the predictions are solely based on the RS-DAM computations, no experimental or analytical reports are currently available to support the data presented herein to the best of the authors’ knowledge. However, the current information allows engineers and researchers a reference guide to verify any future modelling or experimental works on Wadi Dayqah Dam. Furthermore, while a range of parameters were explored in this study, other relevant seismic stability factors of dams could not be considered due to the limitations of RS-DAM, such as the foundation flexibility, water compressibility and stress distributions along the dam-foundation interface. Nevertheless, these attributes remain a motivation for possible directions of future research on Wadi Dayqah Dam.