
ABSTRACT
Buckling of thin shell concrete arch dams attracts the attention of researchers due to the potential damage resulting from large displacements. Regardless of a few studies that explored the subject, there is no explicitly established design procedure to assess the dam buckling capacity. Other researchers have investigated the buckling behaviour of dams, considering the loads for which the model stiffness matrix becomes singular without accounting for the geometrical nonlinearities effect on the buckling load. Consequently, this study sought to examine the effect of geometrical nonlinearities on the buckling response using finite element analysis. A broad range of aspect ratios was used for this purpose. For a small rise-to-width ratio, e.g. 5%, the linear buckling analysis under-estimated the buckling load for all aspect ratios. Moreover, an appropriate domain to define the dam height category is established, including the geometrical nonlinearities effect. Medium dams influenced slightly when the large displacement effect included, whereas short and long shells impacted substantially due to the existence of the large displacement theory. Furthermore, linear and nonlinear deformations at the limit load were compared concerning the effect of changing the height- to-width ratio on the location of the critical displacement over the dam’s body.
Notation
- pcrit
Critical pressure
- papp
Maximum applied pressure (bottom)
- LBA
Linear Buckling Analysis (reference)
- GNA
Geometric Nonlinear Analysis
- b/a
Height-to-width ratio (aspect ratio)
- h/a
Rise-to-width ratio (rise ratio)
- t
Wall thickness
- LF
Load Factor
- CLF
Critical Load Factor
- γw
Water unit weight (=10 kN/m3)
- E
Modulus of elasticity (= 28 GPa)
- ν
Poisson’s ratio (= 0.15)
1 Introduction
Thin shell structures exist in a wide range of applications at a variety of engineering fields. This can include, but is not limited to, concrete dams, pressure vessels, silos, tanks, pipelines, chimneys. The fact is that thin shell structures are exposed to failure due to buckling, and thus dominate the design criterion. As a result, it is vital to have a more in-depth view of such a phenomenon which is sudden and catastrophic.
Numerous studies have been conducted in the past to investigate the buckling response of thin shells. This involved steel and concrete shells; however, emphasis was placed on metal shells because of their thinner walls. As an example, Rotter and Al-Lawati (2016) studied the length effect on the elastic buckling strength of imperfect cylindrical shells under axial compression. Furthermore, Al-Lawati and Rotter (2015) investigated the strain hardening influence on the buckling resistance of axially loaded medium cylinders with imperfections. Comprehensive knowledge about the buckling of thin metal shell structures is available in Teng and Rotter (2004). As for thin concrete shells, Hamed et al. (2010) and Chang et al. (2010) examined the buckling failure in shallow spherical concrete domes subjected to uniform pressure.
There are three major groups of dams: arched dams, gravity dams and buttress dams (Breeze, 2018). Concrete arch dams can sustain significant pressures applied to their wall by a lateral thrust in their abutments (Jansen, 2003). These pressures (e.g., water) may lead to significant membrane compressive stresses formation away from the boundaries (Zingoni et al., 2013). On top of that, this kind of dam comprises of a thin wall compared to other dams, and hence, failure of the buckling mode may control the design.
When it comes to dams, Zingoni et al. (2013) stated in their paper that the majority of studies accomplished in the past focused on particular case studies of real dams founded in different countries. As the information provided was specific and not generalised, it is difficult to adopt in the design of other arch dams. Most importantly, few studies have been carried out in the literature to examine the buckling behaviour of thin shell concrete arch dams. For instance, Zingoni et al. (2013) compared the critical pressures of two different thin concrete arch dams, cylindrical and elliptic-paraboloidal. This has been done using a wide range of height-to-width and rise-to-width ratios. Also, multiple wall thicknesses were studied. However, this study considered linear buckling behaviour, excluding nonlinear effects. The critical pressures of both arch dams were shown to be comparable. A theoretical analysis, applying two disparate approaches (crown cantilever method and classical buckling theory) to study the buckling response of high arch dams was accomplished elsewhere (Li et al., 2012). An examination of the stability safety issue of the arch dam was carried out by Zhou and Chang (2004). But in their paper, an eigenvalue buckling theory was adopted without implication of nonlinear influence on the buckling strength. Besides, only high arch dams were scrutinized.
As far as the design of arch dams is concerned, the popular existing standards are the American standard, EM 1110-2-2201 (1994), and the Chinese standards, SL 282-2003 (2003) and DL 5346-2006 (2007). Although essential provisions included in these standards about general design consideration, static and dynamic analyses, temperature effects, construction, etc., neither provided explicit design procedures of thin shell arch dams to resist buckling.
In view of the above, and since this topic requires further attention in the open literature, this research was performed to build the first brick in establishing the initial steps for designing thin concrete arch dams, of different heights against buckling. This was done not only by allowing for linear buckling concept, but also by incorporating the effect of geometrical nonlinearities, which were not considered earlier.
2 Modelling of the thin shell concrete arch dam
A finite element model was developed for the arch dam using ABAQUS finite element package. The dam with width, a = 50 m, rise, h = 2.5 m, height, b (variable), and thickness, t = 0.5 m was modelled as a thin shell structure since all thickness-to-height ratios, t/b used is smaller than 0.2 (Bureau of Reclamation, 1977). An 8-node doubly curved thick shell element with reduced integration was implemented as in Zingoni et al. (2013). Figure 1 below shows the boundary conditions and loads applied to the model. Three edges are fixed as shown in Figure 1, while keeping the top edge free since this boundary condition type represents the practical situation (Zingoni et al., 2013). Hydrostatic water pressure (unit weight, γw = 10 kN/m3) is applied to the dam, which varies from zero at the top of the dam to the maximum at the bottom (papp = γwb). For example, at b/a ratio of 1.5, a is constant as outlined above with a value of 50 m, then the height b is 75 m, this means that the applied pressure at the bottom of the dam is 750000 N/m2.
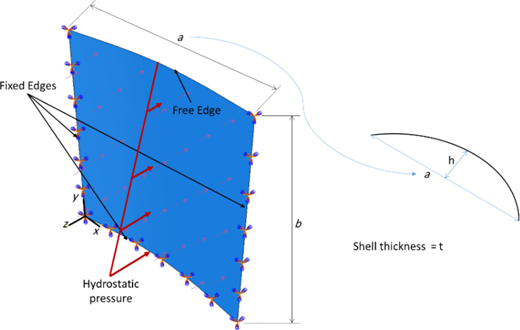
The finite element model – boundary conditions and loads.
Model validation and mesh convergence were both sought by linear buckling (bifurcation) analysis without considering the geometrical nonlinearities. The results were compared to those obtained by Zingoni et al. (2013) as shown in Table 1 for different element sizes and b/a ratios. The developed finite element model showed convergence at an element size of 1 m, which was then adopted for all models.
Mesh sensitivity analysis
| b/a | |||
|---|---|---|---|
| 0.75 | 1.5 | 2 | |
| Element size (m) | Load Factor (LF) | ||
| 15 | 1.216 | 0.339 | 0.214 |
| 10 | 1.140 | 0.300 | 0.186 |
| 5 | 0.928 | 0.269 | 0.170 |
| 3 | 0.922 | 0.267 | 0.170 |
| 1 | 0.920 | 0.267 | 0.170 |
| Zingoni et al. (2013) | 0.920 | 0.270 | 0.170 |
It may also be useful to provide the number of elements generated as well as the relevant analysis time (in seconds) for each element size for the b/a ratios shown in Table 1. This information comes from several analyses, which is seen in Table 2.
Element size and number, and time analysis for different b/a ratios
| b/a = 0.75 | b/a = 1.5 | b/a = 2 | ||||
|---|---|---|---|---|---|---|
| Element size (m) | Elem. No. | Analysis time (s) | Elem. No. | Analysis time (s) | Elem. No. | Analysis time (s) |
| 15 | 9 | 0.6 | 15 | 0.6 | 21 | 0.7 |
| 10 | 20 | 0.9 | 40 | 0.9 | 50 | 0.7 |
| 5 | 80 | 1.1 | 150 | 1.8 | 200 | 2.1 |
| 3 | 221 | 2.1 | 425 | 4.4 | 561 | 4.5 |
| 1 | 1900 | 16 | 3750 | 42.5 | 5000 | 47.2 |
For all models, concrete is assumed to be linear elastic with modulus of elasticity, E of 28 GPa and Poisson’s ratio, ν of 0.15. Geometrical nonlinearity was included in the model for static analysis of the same linear buckling problem. However, geometrical nonlinearity may involve buckling or collapse behaviour, where the load-displacement response shows a negative stiffness, and the structure must release strain energy to remain in equilibrium. ABAQUS implements the modified Riks method, which converges to the static equilibrium states during the unstable phase of the response. Consequently, the ABAQUS static analysis with Riks method was adopted for the inclusion of geometrical nonlinearity in the buckling analysis of thin-shelled arch dams.
As shown in Figure 2, the critical load factors produced using the current model and those acquired from Zingoni et al. (2013) were compared. This is achieved for a practical range of aspect ratios, i.e., 0.75 ≤ b/a ≤ 2. A rise-to-width ratio of 5% is considered. Figure 2 depicts almost corresponding results to those obtained by Zingoni et al. (2013). The results shown in this study are all based on an assumption of a uniform wall thickness along the dam height. However, the effect of nonuniform wall thickness on the buckling response of axially compressed thin cylindrical shells can be found in Rotter and Al-Lawati (2017), from which some useful information may be extracted.
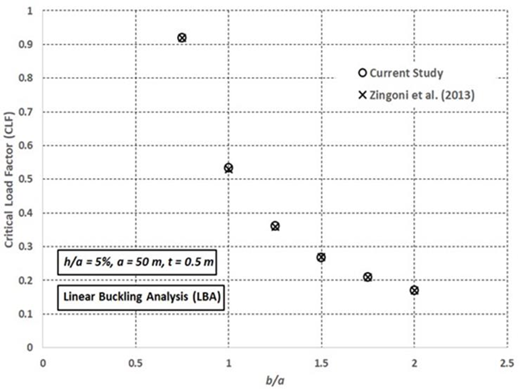
Critical load factor vs height-to-width ratio (validation).
3 Results and discussion
Figure 3 shows the variation in the critical load factor of the thin arch dam over a wide range of aspect ratios, b/a. The concrete structure has a width of 50 m, the thickness of 0.5 m, and the rise ratio equals to 5%. Two different analyses were used for comparison, linear buckling analysis (LBA) and geometrically nonlinear analysis (GNA). From Figure 3, as the height-to-width ratio increased, the buckling loads decreased for both analyses. However, the large displacement effect (i.e. GNA) led to a further reduction in the resistance compared to those obtained from the linear buckling analysis. For instance, the critical load factor (CLF) declined from 0.92 to 0.17 (approximately 82% reduction) between aspect ratios of 0.75 and 2.0. While when the geometric nonlinearity effect is included, the critical pressure, pcrit decreased from 0.82 papp to 0.14 papp (a capacity decline of about 83 per cent) along the same b/a values. Figure 3 also indicates that the critical load factors become less sensitive to an increase in the height of the dam. In other words, although there is a drop in strength when b/a is increased, the rate of fall is diminished. For example, under the linear buckling condition, only around 22% (much smaller than 82%) of descending in load is observed when the thin shell height, b risen from 1.5 to 1.75 times the shell width, a. Whereas according to the GNA results, just roughly 28% (well below 83%) of fall in CLF is demonstrated over the same height-to-width ratios.
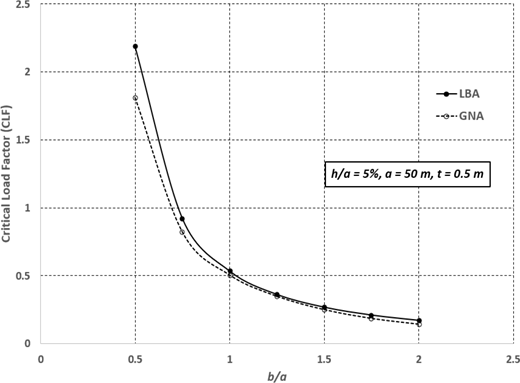
Critical load factor vs height-to-width ratio using LBA and GNA.
The change in the critical hydrostatic pressure ratios because of different b/a values is depicted in Figure 4. The critical pressure has been made dimensionless to investigate the geometric nonlinearity influence on the linear buckling behaviour. As can be seen from Figure 4, for all aspect ratios, the overall critical pressure ratios decreased because of the large displacement effect. The effect of large displacement is more dominant at smaller and higher b/a values. For example, the critical pressure ratio dropped from 1.0 to around 0.89 and 0.88 at b/a = 0.75 and 1.75, respectively. However, it reduced from 1.0 to about 0.96 at b/a = 1.25. This result entailed considering the classification of the dam in terms of its height. It is quite possible for the arch dam to move to the low height range when b/a < 1.25. Conversely, at the aspect ratio above 1.25, the dam tends to be placed at the high height regime. Alternatively stated, the nonlinear geometric response may reveal trivial effects on the resistance when the thin shell is categorised as a medium height dam. This finding may be more understandable when examining Figure 5, where the difference between the critical linear buckling and nonlinear limit pressures is plotted.
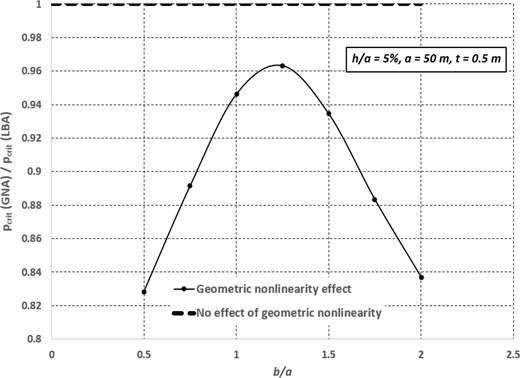
Critical pressure ratio vs height-to-width ratio with and without GNA.
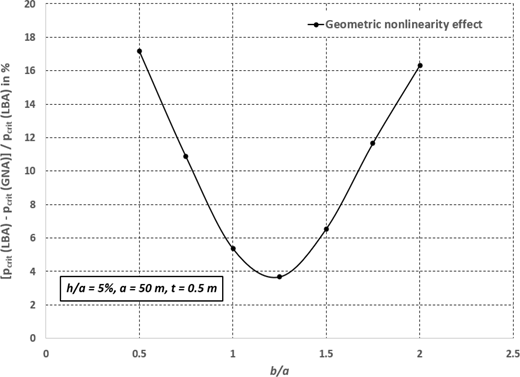
The difference in critical pressure ratio (%) over width-to-height ratio.
In Figure 5, the difference in the critical pressures, obtained from two different behaviours, at each aspect ratio is presented. In connection with the low-rise dam’s region (b/a < 1.25), the difference in the load carrying capacity is increased significantly until it reached to about 17% at the aspect ratio equal to 0.5. This means that the linear buckling analysis led to an underestimation of strengths.
Similarly, the gap in the resistance is increased substantially at b/a > 1.25, within the high-rise dam’s zone, attaining a little more than 16%, when the height-to-width ratio is 2. However, outside the defined domain of b/a, where the dam is deemed to be medium in height, the difference in the critical pressures is insignificant (in the range of 5%). In other words, the nonlinear geometrical effect is pronounced when it comes to shorter and longer thin arch dams, but not medium ones, where the LBA can be considered sufficient to some extent. To draw attention, this may apply to smaller h/a ratios.
Figure 6 presents the displacement contours of thin arch dams with h/a = 5% at b/a = 0.75 and 1.75. Figure 6 (a) and (b) indicate the buckling modes, from which it can be manifested that as the aspect ratio increases from 0.75 to 1.75, the critical displacement moved from the middle zone area towards the base region. Also, it is noticed that the displacement at the top is considerably decreased as b/a increases. On the other hand, the deformations of dams (with heights equal to 0.75 and 1.75 times the width) at the limit loads are shown in Figure 6 (c) and (d) with the inclusion of geometrical nonlinearities. From Figure 6 (c) and (d), the critical displacement is shown within the centre area of the dam wall for both b/a values. However, a higher magnitude is attained at bigger aspect ratio. Generally speaking, linear and nonlinear displacements patterns may be quite different in both axial and circumferential directions as presented in Figure 6.
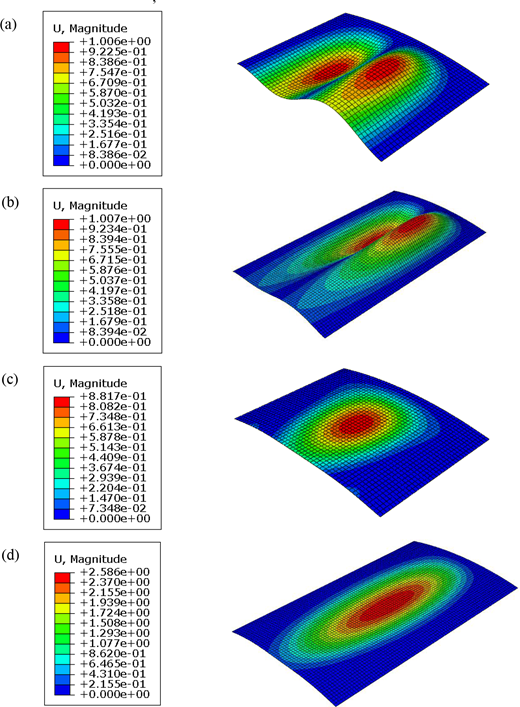
Critical displacements (in meters) from (a) LBA (b/a = 0.75) (b) LBA (b/a = 1.75), (c) GNA (b/a = 0.75), and (d) GNA (b/a = 1.75).
Critical displacements (in meters) from (a) LBA (b/a = 0.75) (b) LBA (b/a = 1.75), (c) GNA (b/a = 0.75), and (d) GNA (b/a = 1.75).
4 Conclusions
An examination of the buckling behaviour of thin-walled concrete arch dams was carried out in this study. A horizontally curved circular cylinder dam was adopted. A water hydrostatic pressure has been applied to the thin wall, which can result in severe membrane compressive stresses, and therefore failure under the buckling phenomenon. To the best of the authors knowledge, few studies have investigated the buckling response of these structures, concentrating primarily on the hypothesis of small displacements. However, no research has been conducted to discover the influence of geometric nonlinearity on the critical pressure. Therefore, this article is aimed to gain an overview of this behaviour, using specific geometric parameters. The considered thin arch dam has a width, a of 50m, thickness, t of 0.5m, and rise ratio, h/a of 5%. A convenient range of aspect ratios was implemented during the analysis, i.e., 0.5 ≤ b/a ≤ 2 (in increments of 0.25). Two analysis approaches were compared, linear buckling and nonlinear geometrical analyses, utilising the finite element software, ABAQUS, implementing Riks method for modelling nonlinearities. In this study, several interesting results appeared as follows:
Higher b/a ratios led to a fall in the critical pressure, but more reductions were observed when the large displacements intervened.
The effect of nonlinear geometric behaviour was more pronounced at b/a < 1.25 as well as b/a > 1.25, with a minor influence between these boundaries. This resulted in the dam being classified into three distinct groups concerning its height.
Although linear buckling analysis (LBA) yields almost safe critical pressures for the medium dams, it provided unconservative strengths for short and long dams because of geometrical nonlinearities (GNA).
Linear buckling modes revealed that at smaller b/a ratios, the critical displacements were distributed within the half-height region. Nevertheless, at larger aspect ratios, these displacements were relocated near the dam bottom edge. Furthermore, when the height-to-width ratio increased, the displacement at the dam summit decreased appreciatively. On the other hand, the nonlinear geometrical behaviour showed a critical displacement (at the limit load) around the dam’s wall centre. This was evident for both, b/a = 0.75 and 1.75. However, as b/a increased, the critical displacement in the vicinity of the middle area increased. From this study, using the current parameters, it can be deduced that by knowing the place of the critical displacement, the designer or the failure investigator may have better insight about the strengthening location(s) within the dam wall against buckling.
Despite new findings deduced from this study, which can be useful in the development of the design rules and provisions of the practical thin shell concrete arch dams, there are additional key factors (e.g., imperfections, shapes of dam valleys, the variation of the wall thickness, different geometries of the arch dam.) that may affect the buckling behaviour. For this reason, it is undoubtedly substantial to expand the current study further by exploring the impact of these prime parameters.