
ABSTRACT
Frequent regional extreme flash floods events have been hitting Egypt and the Arabian Peninsula and are considered among the most severe disasters in the region in terms of fatalities and economic loss. Meanwhile, these floods are a vital source of water for such arid regions. Until today, there is no proper integrated basin scale management for most of the Arabian wadis, especially in Egypt. The main objectives of the present paper are to simulate flash floods and assess different mitigation scenarios in Wadi Abadi at the Eastern Desert of Egypt. Remote sensing data was used along with a Hydro-BEAM model to predict and evaluate different mitigation scenarios of flash floods at the target basin. Digital Elevation Model (DEM) data and satellite imagery have been used also to propose suitable locations of dams based on available reservoirs’ total volumes and delineated watershed. Mitigation scenarios using a single concentrated dam or group of distributed dams have been assessed. Both scenarios could mitigate flash floods at the downstream efficiently. The distributed dams can additionally manage and harvest water at the upstream sub-basins. However, the concentrated dam approach is better when cost and operational issues are considered.
1 Introduction
The Arab region is affected by many disasters that are mainly flash floods and drought where flash floods have become more frequent in the last decade (Abdel-Fattah et al., 2016, Abdel-Fattah et al., 2018). Climate change could be the driving force for this increasing rate of flash floods or it is just due to the growing media coverage and the wide spreading of advanced monitoring tools. For instance, Gonu-2007 event caused 50 fatalities and 3.9 billion USD of economic losses in Oman only (Al Khatry and Helmi, 2008), while May-2014 flash flood in Egypt caused losses of 1 billion EGP in Taba city only. Flash flood is a flood which is characterized by its quick occurrence resulting in a very limited opportunity for warnings to be prepared and issued (Collier, 2007). Flash flood causes could be excessive rainfall or an accident like a dam or levee break.
Egypt is one of the arid countries that face flash floods in the coastal and Nile River wadis (Abdel-Fattah et al., 2015). Flash floods frequently occur in Egypt, several flood events happened in Sinai Peninsula, Eastern Desert and the Red Sea wadis. In Egypt most highways roads and other infrastructure are constructed across wadis that surround the main cities. The rapid increase of population urbanization and economic developments have pushed people to construct in high disaster risk zones such as on the wadi flood plains (Abdel-Fattah et al., 2017). Until today, no inclusive proper protection from flash floods has applied at all wadis in Egypt. More hydrological studies are urgently needed to evaluate current mitigation measures in Egypt and propose innovative mitigation technologies. This paper objectives are to i) adopt a sophisticated methodology which faces limited data coverage in the Egyptian wadis and ii) to evaluate the mitigation scenarios by a single concentrated and by distributed dams using a hypothetical design rainfall storm of 100 year return period.
1.1 Facts findings for wadi flash flood management in Egypt
In Egypt, several measures are adopted to mitigate flash flood such as a combination of obstacle dams. Detention dams at the upstream regions and artificial lakes at the downstream regions lead to better management of flood retention and groundwater recharge. A group of researchers from Kyoto University and Japan Dam Engineering Center (JDEC) made a number of field investigations for several wadis in Egypt, between 2014 and 2018, for fact finding and selecting the type of suitable integrated flash flood measures and their design criteria. The main objectives of these field investigations were to obtain hydrological, geological, structural and operational conditions of existing flood mitigation dams at wadi basins in the Red Sea coast and the Eastern Desert, and clarify the possible cooperation on the selected pilot project. During the trip wadi basins were surveyed along the Eastern Desert between the Nile River and Red Sea coast as well as investigating flash flood mitigation and management strategies in Egypt.
The Egyptian government’s flash flood mitigation and harvesting master plan includes (a) a short-term plan for high-risk wadis and, (b) a long-term plan for low-risk wadis. There are different flash flood management structures in Egypt such as storage dams, obstacle dams, artificial lakes, diversion dikes, embankments and artificial drainage channels as indicated in Figure 1. Selection and design of the best mitigation measures combination is based on expected floodwater quantity, wadi risk degree, potentially affected infrastructures and flash flood return period (Abdel-Fattah, 2017).
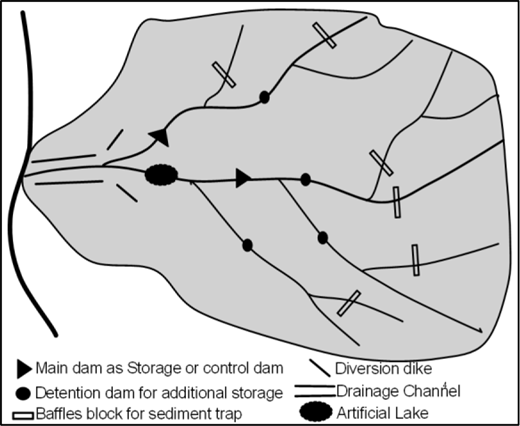
flood mitigation and management structures in Egypt (Abdel-Fattah et al., 2015).
Figures 1 and 2 show the main flash flood mitigation and management structures in Egypt and their characteristics as following:
Obstacle dam: low dam (less than 4-6m), only for reducing flood impact (velocity reduction),
Storage retention dam: middle height dam (around 10m), for flood retention and additionally water harvesting, and
Artificial lake: excavated, depth (2-4m), for flood retention and water harvesting.
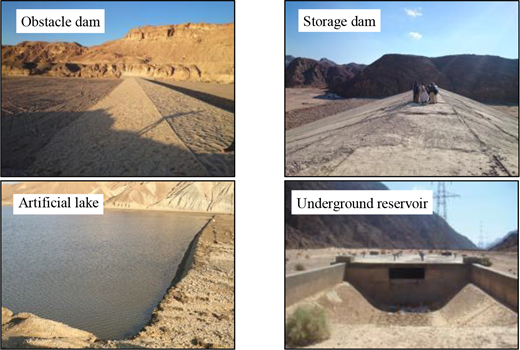
Samples of some established flash flood mitigation and management structures in Egypt (Abdel-Fattah et al., 2015).
Samples of some established flash flood mitigation and management structures in Egypt (Abdel-Fattah et al., 2015).
Accurate prediction and early warning for flash floods in a form that is readily understood by related authorities and the public are required so that they are prepared against such hazards before they become disasters (Khan, 2013, Abdel-Fattah et al., 2021). By doing so, lives and property can be protected. However, although a warning system is a vital tool for forecasting the potential flash flood, there is only one system in Egypt. This system installed at W. Watier, South of Sinai Peninsula, is considered as one of the most active wadis in Egypt with respect to flash floods. The Ministry of Water Resources and Irrigation in collaboration with Belgium has installed this early warning system called Flash Flood Manager (FlaFloM).
2 Case Study
W. Abadi is located in the southern part of the Eastern Desert of Egypt, which is bounded by the Red Sea and the Gulf of Suez from the east, and the Nile River valley from the West as shown in Figure 3. W. Abadi watershed area is about 6800 km2. W. Abadi is cited with various names in the literature as W. Abbad, W. Abad or W. El-Btur. In the study area the general flow direction is NE-SW and at the end drains into Nile River east of Idfu city. The downstream part of W. Abadi contains the delta of W. Abadi, where agricultural land cover is about 29 km2.
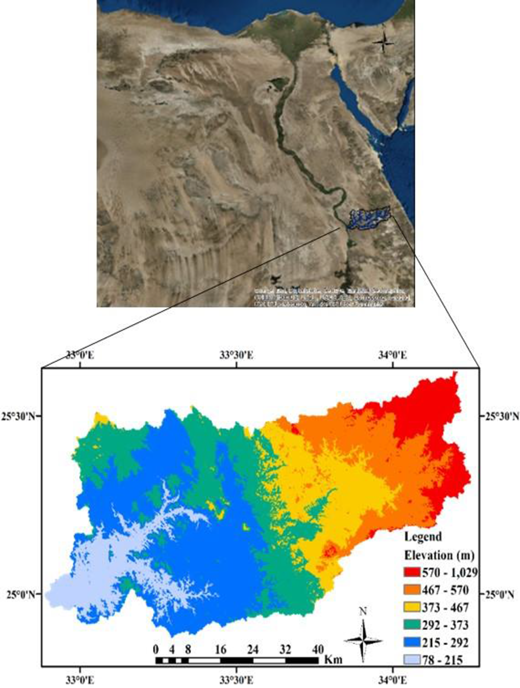
Map of Egypt and location of W. Abadi with elevations.
The wadi climate is characterized by an arid climate with an average annual rainfall of 25 mm and high evaporation rate. The rainfall has uneven geographical and temporal distribution, where sometimes there is no rainfall in the year and sometimes heavy rainfall intensity occurrs in a short time. Due to sudden heavy rainfall, the study area is frequently affected by extreme flash flood events such as in October 1991, November 1994, October 1997 and March 2014 (Ibrahim et al., 2011). W. Abadi is classified as medium flash floods risk degree by the Ministry of Water Resources and Irrigation at Egypt (MWRI, 2012).
The target area was studied by Milewski et al. (2009) estimating the annual averages of precipitation, runoff, and recharge through transmission losses. In addition, flash floods simulation for some rainfall events was made by Saber et al. (2010). Ibrahim et al. (2011) assess and evaluated the hydrology of W. Abadi including the potentiality of both surface and groundwater resources in the wadi.
As a result of the increasing pressure of population and unmanaged development people started reclamation of new lands for agriculture, even building their houses in more prone areas for flash floods in W. Abadi. The study area is crossed by some highway roads eg Idfu-Marsa Alam road. This road is frequently damaged by flash floods and the Egyptian government has started to make flash floods mitigation for this important road.
3 Methodology
To face data scarcity, remote sensing data and geographic information system (GIS) were used with Hydrological River Basin Environmental Assessment Model (Hydro-BEAM) to simulate several flash floods events and evaluate different management scenarios of flash floods at the target basins. Hydro-BEAM is a hydrological and environmental model (Kojiri et al., 1998), which was developed for humid areas but later calibrated and used for flash floods simulation in arid environments by Saber (2010). Hydro-BEAM model has been modified to consider mitigation scenarios by adding reservoir routing and dam operation routine. Reservoir water evaporation and infiltration have been ignored in this version of Hydro-BEAM (Abdel-Fattah et al., 2021).
The proposed dam locations and their characteristics are based on the following main steps:
estimation of the flow directions of each mesh and watershed boundary using GIS and Digital Elevation Model (DEM) data;
use of a rainfall-runoff model (Hydro-BEAM) and synthetic design storms to make a geographical distribution of the surface runoff and allocate the potential prone area of flash floods;
estimation of cross sections capacity of the wadi drainage channels using DEM and Google Earth images to detect the safe passing flow capacity of each channel;
proposing several dams locations according to the surrounding topography;
establishment of the height and volume curve (H-V) for each dam using in-house developed code, DEM and the flow direction of each mesh;
estimation of the expected design flood volume and the required dam height;
subsequent integration of outlet setting in each dam compatible with the downstream channel capacity and
evaluation for the different dams locations to decide the best option that can retain the flood volume with the lowest dam height and does not affect the surrounding developed areas such as agricultural and residential areas.
3.1 Hydro-BEAM model
This approach is based on Hydrological River Basin Environmental Assessment Model (Hydro-BEAM) which is a computer based hydrological model. This model was developed by Kojiri et al. (1998). The first purpose of Hydro-BEAM is to be used as a tool for simulating long-term fluctuations in water quantity and quality in rivers through understanding the hydrological processes that occur within a watershed (Kojiri et al., 1998). It has since been used in research as a river basin environment assessment model through comprehensive simulation including the control of water quantity, quality, and sediment. The watershed is modelled as a uniform array of multi-layered mesh cells, each mesh containing information regarding surface land use characteristics, hillslope gradient, flow direction, runoff coefficient, and the presence or absence of a channel. Basic structure of Hydro-BEAM model is shown in Figure 4.
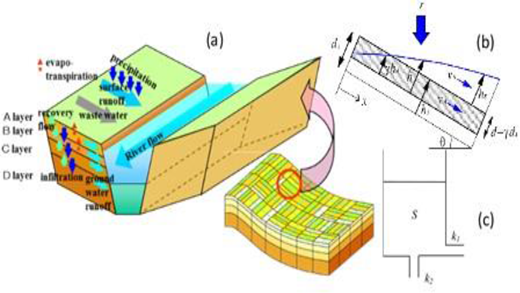
Conceptual illustration of Hydro-BEAM: (a) the considered hydrological processes; (b) the surface layer model; (c) subsurface storage tank layers (Kojiri et al., 1998).
Conceptual illustration of Hydro-BEAM: (a) the considered hydrological processes; (b) the surface layer model; (c) subsurface storage tank layers (Kojiri et al., 1998).
With Hydro-BEAM, the target basin is divided into an array of unit mesh cells. Each mesh contains a combination of surface layer and three subsurface layers, labeled as A, B, C and D. The first layer, A, is composed of the surface and soil surface layer where, the kinematic wave model is used to estimate the surface runoff. B, C and D layers are subsurface layers that are evaluated using the linear storage model. It is assumed that both of B and C layers have flow toward the river, but D-layer is represented, as a groundwater storage and does not have influence in river flow. When storage water content reaches a saturated state, water content flows into the upper layer of model as a returned style.
The integrated kinematic wave model used to describe layer A considering the diverse surface characteristics of different land use types, as expressed in Figure 4-b and the following equations:
where, h is the water depth (m), q is the discharge per unit width (m2s-1), r is the rainfall intensity (ms-1), f is the direct runoff rate, t is the time (s), x is the distance from the upstream edge (m), d is the equivalent water height on saturation (m), Al and A are a subscription referring to land use and layer A respectively, mb is a constant concerning friction, n is the equivalent roughness (m-1/3s), k is the hydraulic conductivity (ms-1), d is the saturation pondage (m), λ is the porosity (%), D is the layer thickness (m), and sinθ is the slope gradient.
The kinematic wave model is also employed to describe the water behaviour in the river channel using Manning equation as following:
where, Ar is the river cross section area (m2), Qr is the river discharge rate (m3s-1), qr is the total river inflow rate per unit width (m2s-1), I is the river channel gradient, n is the channel roughness (m-1/3s), m is the river slope gradient. Each mesh has river channel and its geometry (depth and width) identified using the upstream area the measurement of the channel geometry at standard locations as following:
where H is the channel depth (m), B is the river width (m), std is shortcut for standard point, i is referring to the target point, Ai is the upstream catchment area (m2), f and b are constants related to basin characteristics. The subsurface layers (B, C and D layers) are modelled using the linear storage mode (Figure 4-c) as following:
where S is the storage amount (m), I is the inflow (ms-1), O is the outflow (ms-1) and k1, k2 are outlet coefficients. The model estimate the initial, transmission losses using Natural Resources Conservation Service (NRCS) method (SCS, 1997) and Walter’s equation (Walters, 1990) respectively as following:
The hydraulic design of dam bottom outlets were to retard flood wave, cut the peak flow discharges and safely passing the floodwater only through the bottom outlet. The developed dam routine is suitable for the proposed mitigation measures with a low dam height (less than 20 m) and rectangular shaped outlet. The key parameter that detects the operation stage is the dam outlet discharge, which is calculated based on the water depth behind the dam as indicated in Figure 5 and in the following equations:
where Qo is the dam outlet discharge rate (m3s-1), C is the state outlet coefficient calculated based on the water height and the dimensions of the outlet, B is the outlet horizontal dimension (m), H is the water depth above the dam bottom (m), L is the outlet length through the dam base (m), D is the outlet vertical dimension (m).
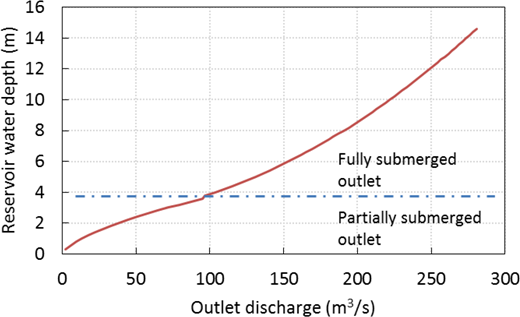
The established dams outlet discharge versus the reservoir water depth as indicated in Equation (12).
The established dams outlet discharge versus the reservoir water depth as indicated in Equation (12).
By using the established curves of reservoir volume-water depth above the dam bottom (V-H) and reservoir area-water depth above the dam bottom (A-H), dam operation status updated simultaneously within Hydro-BEAM model every time step (30 seconds in this study). Dam operation status corresponds to one of the following: (1) Reservoir filling if the inflow rate is higher than the current outlet discharge; (2) Reservoir water release if the inflow rate is lower than the current outlet discharge or (3) Overflow in case of the current water depth is higher than the maximum dam height.
3.2 Input data
Digital Elevation Model (DEM): Topographic data were obtained by the Shuttle Radar Topography Mission (SRTM) data (USGS, 2008). The used data set is void filled 3arc-second elevation data that are the result of additional processing to address areas of missing data or voids. The study area is characterized by a middle range of relief with elevation ranges from 1029 m above sea level (a.s.l.) at the upstream, where the basement outcrops existed, to 78 m a.s.l. at the downstream, and generally slopes towards the west discharge the flow into the Nile River as shown in Figure 3. DEM data was used for watershed delineation (including sub-basin boundaries and stream network detection), flow direction and mesh slope identification. Furthermore, DEM data was used for dam location and reservoir volume detection.
Rainfall data: The used precipitation data are Global Satellite Mapping of Precipitation (GSMaP) data (TRMM, 2013). This data have 1-hour temporal resolution, global domain (60N - 60S) and spatial resolution Grid resolution 0.1 degree. GSMaP geographic distribution maps of Jan-2010 and Mar-2014 events (Figure 5) in W. Abadi catchment shows that there is a high variability of rainfall distribution in space and time. The rainfall events of Mar-2014 have more intensity and uniform distribution than Jan-2010 event, which was mainly concentrated on the upstream part especially the north eastern part of the watershed.
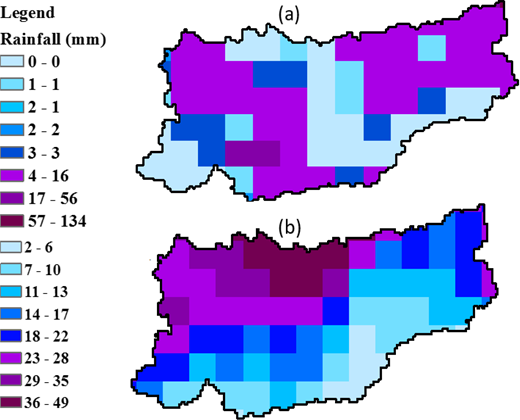
Samples from daily GSMaP rainfall for (a) 18/1/2010 and (b) 9/3/2014 flash flood events.
Samples from daily GSMaP rainfall for (a) 18/1/2010 and (b) 9/3/2014 flash flood events.
Land Use Data: Global Land Cover Characterization (GLCC) data were used to identify the different land use types. GLCC is a 1-km resolution have been used in a wide range of environmental research and modelling applications (GLCC, 2008). Five land use types, desert, agriculture, urban, water and forest have been identified.
3.3 Watershed delineation
The watershed delineation for W. Abadi to detect the main streams network, watershed and sub-basins boundaries, were built using ArcMap 10.2 GIS software and SRTM DEM (90m) as shown in Figure 3. By comparing the generated streams to the available satellite images, Google Earth and the geological map, it is confirmed that the streams generation produced good results.
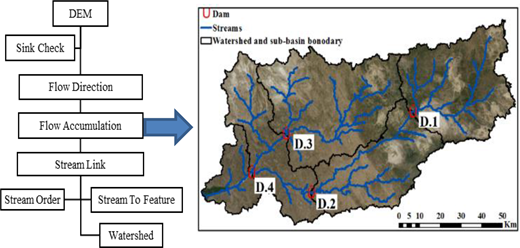
Watershed modelling flowchart and watershed delineation with the proposed dam location
Watershed modelling flowchart and watershed delineation with the proposed dam location
4 Comparison between mitigation scenarios
There is an urgent need to mitigate and utilize flood water as a new supply to sustain a minimum water resources base in rural desert areas. The management approach should involve developing a strategic methodology for evaluating wadi flash floods potential, mitigation, and floods water resource management as well as a rainfall-runoff simulation model (Kantoush et al., 2011, Sumi et al., 2013). This research about flash floods management approach was based on the hard structure measures concept and comparison between applying single concentrated or several distributed dams.
The first investigated scenario is to apply one concentrated dam at the downstream (D4) and the second scenario is to apply four distributed dams at D1, D2, D3 and D4 as indicated in Table 1 that shows the different characteristics of each dam. The dam height is based on the calculated reservoir volumes that was estimated using the DEM data. Figure 8 shows the expected inundated areas. Distributed dams application decreases the concentrated dam height and its reservoir volume. The design storm is selected based on statistical rainfall analysis that estimates the maximum rainfall storm depth for 100-year return period is 44mm (MWRI, 2012). This peak rainfall value distributed as indicated in the flowing hyetographs (Figure 9) and applied homogeneously all over the watershed.
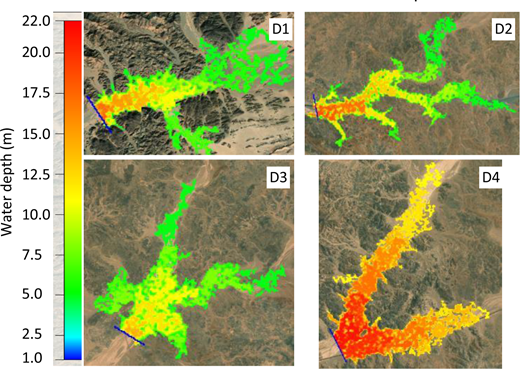
The potential inundated areas due to the proposed dams.
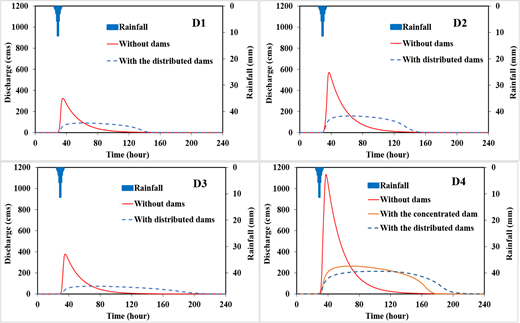
Simulated hydrographs before and after mitigation scenarios application (100 year return period storm)
Simulated hydrographs before and after mitigation scenarios application (100 year return period storm)
Characteristics of the proposed dams
| D4 (Conc.) | D4 (Dist.) | D3 (Dist.) | D2 (Dist.) | D1 (Dist.) | |
|---|---|---|---|---|---|
| Height (m) | 16 | 12 | 10 | 14 | 14 |
| Length (m) | 1000 | 1000 | 500 | 550 | 600 |
| Reservoir volume (*106 m3) | 86.61 | 40.32 | 20.347 | 19.36 | 13.89 |
| Outlets (2.5*3m) number | 3 | 3 | 1 | 2 | 1 |
From the simulated hydrographs and the geographical distribution maps of the surface runoff (Figures 9 and 10), it can be noticed that both strategies could be effective in flood mitigation at the downstream part of W. Abadi. Where mitigation dams application decrease the surface runoff rate from 1200 cubic meters per second (cumecs) to 20 cumecs at the downstream reach. There are some difficulties for dam construction in the upstream areas, where usually these locations are remote with no convenient accessibility. However, the distributed dams will have better mitigation for the upstream part. As shown in Figure 9 of (D.4) the distributed dams can delay the surface runoff at wadi channel for longer time than the concentrated one giving more opportunity for water use in different applications. Other merits of the upstream dams that it could manage the water resources and sediment all over the watershed for water use and development for the upstream area beside the downstream area. The distributed dams could be used for local groundwater recharge.
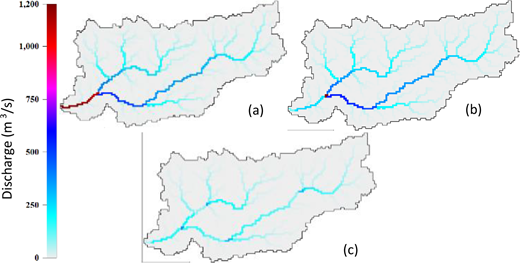
Surface runoff distribution maps before and after mitigation scenarios application: (a) without dams, (b) with concentrated dam and (c) with distributed dams.
Surface runoff distribution maps before and after mitigation scenarios application: (a) without dams, (b) with concentrated dam and (c) with distributed dams.
5 Conclusion
With increasing stress due to flash flood disasters and water resources limitation in Egypt, the application of rainfall-runoff models can be a part of the solution to mitigate flash floods, and at the same time manage and sustain the water resource. The main problem of studying flash floods is obviously the lack of observations in most of the flash floods prone basins, so there is an urgent necessity to adopt a new methodology to simulate and forecast flash floods in arid regions. This study aims to discuss flash floods simulation and management in wadi system and evaluate different concepts of flash floods mitigation. Wadi Abadi at the Eastern Desert is selected as a case study for this target. A trial to simulate two flash flood events at our target study case was implemented: remote sensing data was utilized to face the scarcity of observed data and Hydro-BEAM hydrological model used as a main tool. This flash floods simulation methodology, which is presented in this manuscript, should be further calibrated and validated at some wadi systems in Egypt. The simulation results highlight the main feature of wadi flash floods as its hydrographs have extreme steep and rapid rising to peak flow after a few hours, which increase the degree of risk of flash floods compared to normal floods. The distributed map of simulated discharge for flash floods events indicates high spatial variability of runoff. Not all flash floods have a homogenous geographic distribution, due to rainfall, geomorphologic and land use variation. The distributed dams have an advantage of water resources management all over the watershed for water use and development for the upstream area beside the downstream area. Other comparison aspects should be considered in the future as economical assessment, sediment management and water evaporation for better evaluation of the different management scenarios.
6 Acknowledgements
This research reported in this study was supported by the Ministry of Education, Culture and Sports (MEXT), Japan.