
ABSTRACT
The primary function of impounding water at the Kainji Dam is to generate hydropower, while it also offers opportunities for development of fishery, irrigation, recreation and navigation. The operation of the Kainji dam reservoir in Nigeria over the years has concentrated solely on power generation with little or no cognizance given to environmental aspect. The objectives of the study were to model concentration of selected heavy metals in sediment of the reservoir using Multilayer Perceptron Neural Network (MLPNN) and Radial Basis Function Neural Network (RBFNN) were used to model sediment quality parameters at selected location in the reservoir. The results showed that the application of the NN approaches to model the sediment quality parameters gives good outcomes for all the selected locations with strong correlation coefficient of at least 0.72. Also the Root Mean Square Error (RMSE) and Mean relative Error (MRE) are found within acceptable limits. Concentrations of Cu2+, Pb2+ and Cr3+ in sediment vary between 27.9 to 68.6 mg/kg, 21.9 to 35.0 mg/kg and 39.7 to 95 mg/kg respectively. These fell within the tolerance limits of 80, 35 and 95 mg/kg stipulated by Washington Department of Ecology Sediment Quality Guidelines (WDOESQG) for concentration of heavy metals in sediment. The modelling approaches can be adopted in similar studies.
1 Introduction
Reservoirs play an important role in the livelihood of the humans in Africa and worldwide. They contribute to water supply, irrigation, hydropower generation, fishery development and flood control. They are also tourist attraction and set up new areas for development. However, contamination of aquatic ecosystems in reservoirs with a wide range of pollutants has been always a matter of concern. Reservoirs have been subjected to various forms of degradation due to pollution arising from domestic wastes, industrial effluent, agricultural run offs and bad fishing practices (Nzeve et al., 2014). A good sediment quality is crucial to maintain a healthy aquatic ecosystem, which ensures good protection of human health and aquatic life (Nzeve et al., 2014). Heavy metals have high risk impacts due to their toxicity, abundance, persistence and bio-accumulation in sediment. Identification of contamination level and ecological risks associated with heavy metal pollution of sediments in specific case study in Bulgaria was done on the base of index analyses approach (Todorova et al., 2016).
Lopez et al. (2006) studied elemental ratios in sediments as indicators of ecological processes in Spanish reservoirs. Sediment data were obtained from Catalonian and Lozoya reservoirs. A preliminary study of the limnological significance of the major elemental composition and ratios in sediments were analysed and two data-sets from different limnological regions were obtained. Reservoirs from eastern and western Spain presented significant differences in the chemical composition of their sediments: higher average values for calcium and magnesium appear in the eastern reservoirs, while, in western Spain, higher mean values were found for alumino-silicate elements (i.e. silicon (Si), aluminium (Al) and potassium (K), iron and phosphorus. Ca/Al ratio appears related to water mineralization and in the eastern region, the slope of the regression line between Ca/Al and conductivity reflected catchment mineralogy. In superficial sediments from both eastern and western regions, Fe/Al was linked to the authigenic precipitation of iron oxides and appears closely related to sedimentary phosphorus accumulation above background levels.
2 Methodology
Sediment quality data such as Chromium (Cr3+), Lead (Pb2+) and Copper (Cu2+) were collected from the Environmental unit of Kainji hydropower station (EUKHS, 2015). The monthly sediment quality data was available for power intake, boatyard, turbine discharge and tailrace locations for a period of six years (2008-2013). Figure 1 is the map of Nigeria showing Kainji Lake while Figure 2 is the Google imagery of Kainji reservoir showing the location of water quality sampling.
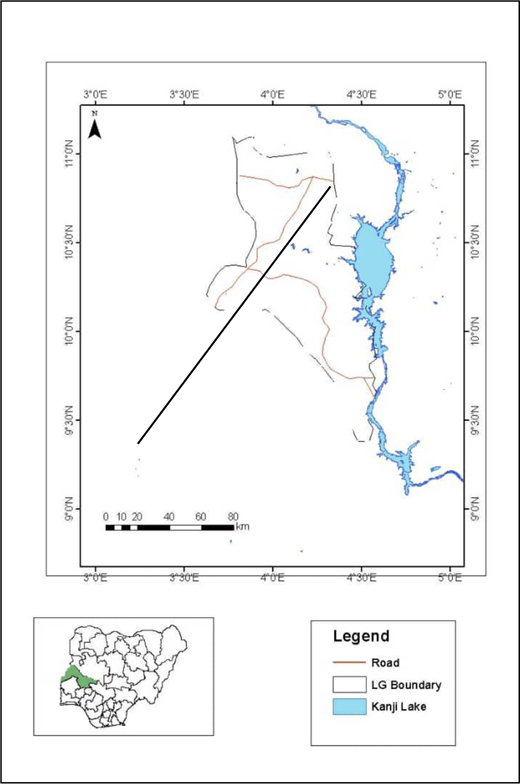
Map of Kainji lake with Nigeria inset
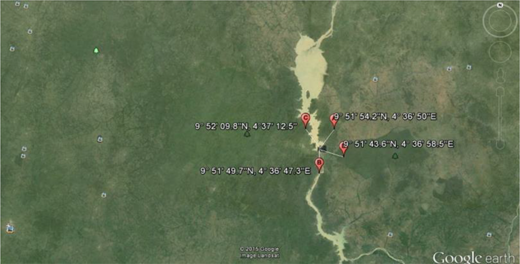
Google imagery of Kainji reservoir showing sampling locations
MLPNN and RBFNN modelling approaches were used in this study due to their applications in modelling linear and non-linear events. Concentration of heavy metals: Cu2+, Pb2+ and Cr3+ in the reservoir sediment were modelled using ANN approaches as explained in (El Badaoui et al., 2013). Physico-chemical variables like: pH, PO43-, Ca2+, Mg2+, K+, Na+ and TSS were used as model inputs while the output were Cu2+, Pb2+ and Cr3+. ANN software tool box in the SPSS 16.0 version was applied to model the heavy metals in the reservoir sediment at the selected locations. The performance evaluation of the model was carried out using the correlation coefficient (r), root mean square error (RMSE) and mean relative error (MRE) as shown in Equations (1) to (3) respectively (Giri and Singh, 2014).
where:
ypi = predicted parameter
yoi = observed parameter
= mean predicted parameter
= mean observed parameter
n = total number of observations
3 Results and discussion
Actual and modelled results for the Cu2+, Pb2+ and Cr3+ concentrations in sediment at the selected locations at the station are presented in Figures 3 to 14. Results of the performance evaluation of the two neural network (NN) approaches for the concentration of selected heavy metals in sediment at different locations are shown in Tables 1-12.
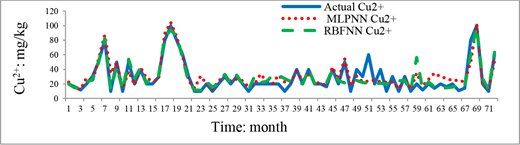
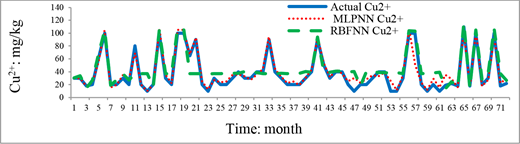
Actual and modelled Cu2+ in sediment at power intake for Tailrace
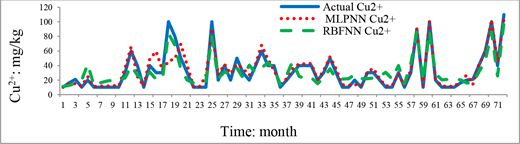
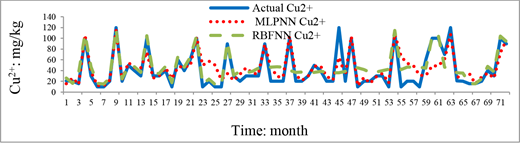
Actual and modelled Cu2+ in sediment at boatyard for Tailrace
Actual and modelled Cu2+ in sediment at tailrace for Tailrace
Actual and modelled Cu2+ in sediment at turbine discharge for Tailrace
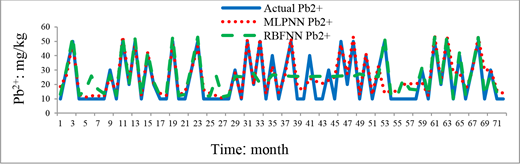
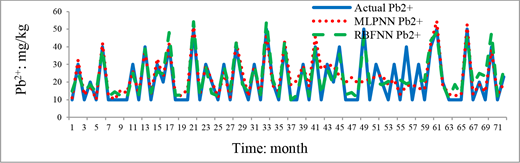
Actual and modelled Pb2+ in sediment at power intake for Tailrace
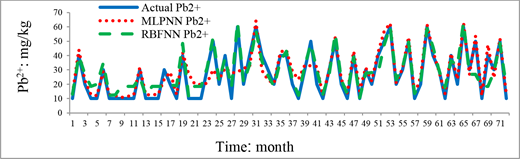
Actual and modelled Pb2+ in sediment at boatyard for Tailrace
Actual and modelled Pb2+ in sediment at tailrace for Tailrace
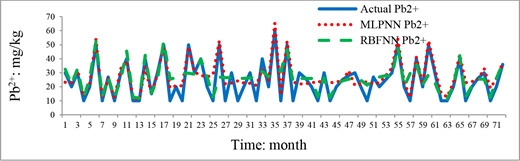
Actual and modelled Pb2+ in sediment at turbine discharge for Tailrace
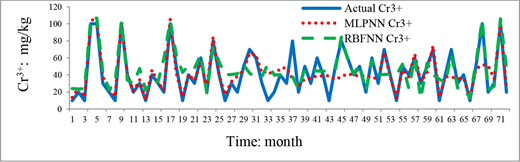
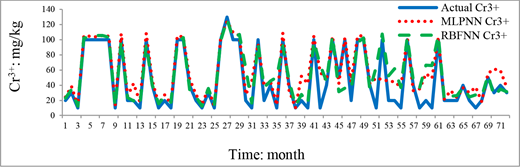
Actual and modelled Cr3+ in sediment at power intake for Tailrace
Actual and modelled Cr3+ in sediment at boatyard for Tailrace
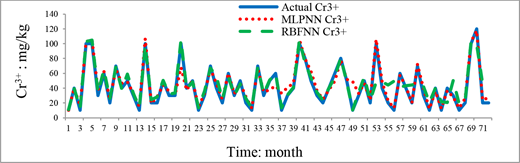
Actual and modelled Cr3+ in sediment at tailrace for Tailrace
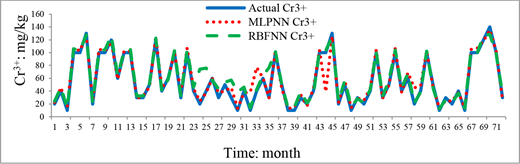
Actual and modelled Cr3+ in sediment at turbine discharge for Tailrace
ANN model results for Cu2+ in sediment at power intake
| MLPNN | RBFNN | ||||||
|---|---|---|---|---|---|---|---|
| Sample | Percentage (%) | RMSE | MRE | r | RMSE | MRE | r |
| Training | 77.8 | 4.491 | 0.807 | 0.90 | 4.155 | 0.691 | 0.89 |
| Validation | 22.2 | 1.828 | 0.806 | 2.063 | 1.027 | ||
| Total | 100 | ||||||
ANN model results for Cu2+ in sediment at boatyard
| MLPNN | RBFNN | ||||||
|---|---|---|---|---|---|---|---|
| Sample | Percentage (%) | RMSE | MRE | r | RMSE | MRE | r |
| Training | 77.8 | 4.366 | 0.763 | 0.92 | 4.905 | 0.875 | 0.86 |
| Validation | 22.2 | 2.208 | 0.892 | 2.311 | 0.910 | ||
| Total | 100 | ||||||
ANN model results for Cu2+ in sediment at tailrace
| MLPNN | RBFNN | ||||||
|---|---|---|---|---|---|---|---|
| Sample | Percentage (%) | RMSE | MRE | r | RMSE | MRE | r |
| Training | 77.8 | 4.489 | 0.806 | 0.96 | 5.236 | 0.997 | 0.85 |
| Validation | 22.2 | 2.208 | 0.865 | 2.930 | 1.044 | ||
| Total | 100 | ||||||
ANN model results for Cu2+ in sediment at turbine discharge
| MLPNN | RBFNN | ||||||
|---|---|---|---|---|---|---|---|
| Sample | Percentage (%) | RMSE | MRE | r | RMSE | MRE | r |
| Training | 77.8 | 4.226 | 0.714 | 0.82 | 5.194 | 0.981 | 0.76 |
| Validation | 22.2 | 4.511 | 0.951 | 2.520 | 1.028 | ||
| Total | 100 | ||||||
ANN model results for Pb2+ in sediment at power intake
| MLPNN | RBFNN | ||||||
|---|---|---|---|---|---|---|---|
| Sample | Percentage (%) | RMSE | MRE | r | RMSE | MRE | r |
| Training | 77.8 | 4.804 | 0.923 | 0.89 | 4.692 | 0.881 | 0.78 |
| Validation | 22.2 | 2.893 | 0.974 | 3.000 | 1.046 | ||
| Total | 100 | ||||||
ANN model results for Pb2+ in sediment at boatyard
| MLPNN | RBFNN | ||||||
|---|---|---|---|---|---|---|---|
| Sample | Percentage (%) | RMSE | MRE | r | RMSE | MRE | r |
| Training | 77.8 | 4.741 | 0.899 | 0.89 | 4.602 | 0.770 | 0.92 |
| Validation | 22.2 | 2.372 | 0.974 | 3.570 | 0.994 | ||
| Total | 100 | ||||||
ANN model results for Pb2+ in sediment at tailrace
| MLPNN | RBFNN | ||||||
|---|---|---|---|---|---|---|---|
| Sample | Percentage (%) | RMSE | MRE | r | RMSE | MRE | r |
| Training | 77.8 | 5.153 | 1.062 | 0.85 | 4.922 | 0.969 | 0.91 |
| Validation | 22.2 | 3.337 | 0.946 | 3.550 | 1.069 | ||
| Total | 100 | ||||||
ANN model results for Pb2+ in sediment at turbine discharge
| MLPNN | RBFNN | ||||||
|---|---|---|---|---|---|---|---|
| Sample | Percentage (%) | RMSE | MRE | r | RMSE | MRE | r |
| Training | 77.8 | 4.763 | 0.907 | 0.89 | 5.130 | 0.957 | 0.75 |
| Validation | 22.2 | 2.365 | 0.788 | 2.540 | 1.244 | ||
| Total | 100 | ||||||
ANN model results for Cr3+ in sediment at power intake
| MLPNN | RBFNN | ||||||
|---|---|---|---|---|---|---|---|
| Sample | Percentage (%) | RMSE | MRE | r | RMSE | MRE | r |
| Training | 77.8 | 4.987 | 0.907 | 0.84 | 4.462 | 0.724 | 0.8 |
| Validation | 22.2 | 2.878 | 0.921 | 2.490 | 0.925 | ||
| Total | 100 | ||||||
ANN model results for Cr3+ in sediment at boatyard
| MLPNN | RBFNN | ||||||
|---|---|---|---|---|---|---|---|
| Sample | Percentage (%) | RMSE | MRE | r | RMSE | MRE | r |
| Training | 77.8 | 4.220 | 0.712 | 0.96 | 4.676 | 0.795 | 0.91 |
| Validation | 22.2 | 1.957 | 0.921 | 2.300 | 1.019 | ||
| Total | 100 | ||||||
ANN model results for Cr3+ in sediment at tailrace
| MLPNN | RBFNN | ||||||
|---|---|---|---|---|---|---|---|
| Sample | Percentage (%) | RMSE | MRE | r | RMSE | MRE | r |
| Training | 77.8 | 5.238 | 1.098 | 0.93 | 4.835 | 0.850 | 0.89 |
| Validation | 22.2 | 2.915 | 0.998 | 3.024 | 1.026 | ||
| Total | 100 | ||||||
ANN model results for Cr3+ in sediment at turbine discharge
| MLPNN | RBFNN | ||||||
|---|---|---|---|---|---|---|---|
| Sample | Percentage (%) | RMSE | MRE | r | RMSE | MRE | r |
| Training | 77.8 | 4.768 | 0.910 | 0.96 | 4.780 | 0.831 | 0.96 |
| Validation | 22.2 | 3.028 | 0.822 | 2.628 | 1.501 | ||
| Total | 100 | ||||||
4 Discussion of results
The plots of the actual and modelled Cu2+ at the sampling locations presented in Figures 3 to 6 indicated strong relationship between the actual and modelled Cu2+ concentration at the locations. The correlation coefficients (r) of Cu2+ concentration in sediment using MLPNN were: 0.90, 0.92, 0.96 and 0.82 for power intake, boatyard, tailrace and turbine discharge locations respectively while r for RBFNN approach 0.72, 0.89, 0.86 and 0.85 respectively (Tables 1-4). The values of RMSE for training and validation at the power intake location range between 1.828 to 4.491, while the MRE for both training and validation at the power intake location varies between 0.691 and 1.027 (Table 1). Also the RMSE for training and validation were found between 2.208 and 4.905 while that of the MRE were observed to be within 0.763 and 0.910 at the boatyard station. The RMSE for the training and at the tailrace location varied between 2.208 and 5.236 (Table 2) while the MRE for training and validation ranged between 0.806 and 1.044 (Table 3). The RMSE for the training and validation at the turbine discharge location varied between 2.52 and 5.1939 while the MRE for training and validation ranged between 0.7144 and 1.0276 (Table 4).
The plots of the actual and simulated Pb2+ at the sampling locations presented in Figures 7-10 revealed a strong relationship between the actual and simulated Pb2+ concentrations in sediment at the locations. The correlation coefficients (r) of Pb2+ concentration in sediment using MLPNN were: 0.89, 0.89, 0.85 and 0.89 for power intake, boatyard, tailrace and turbine discharge locations respectively while r for RBFNN were found to be 0.78, 0.92, 0.91 and 0.75 respectively (Tables 5-8). The values of RMSE for training and validation at the muscle intake location using the two NN approaches varied between 2.893 to 4.804, while the MRE for both training and validation at the power intake location ranged between 0.881 and 1.046 (Table 5). Also the RMSE for training and validation were found between 2.372 and 4.741 while that of the MRE were observed to be within 0.770 and 0.994 at the boatyard station (Table 6). The RMSE for the training and testing at the tailrace location varied between 3.337 and 5.153 while the MRE for training and validation ranged between 0.946 and 1.069 (Table 7). The RMSE for the training and validation at the turbine discharge location ranged between 2.365 and 5.130 while the MRE for training and validation ranged between 0.788 and 1.244 (Table 8).
The plots of the actual and simulated Cr3+ at the sampling locations presented in Figures 11-14 also revealed a strong relationship between the actual and simulated Cr3+ concentrations in sediment at the locations. The correlation coefficients (r) of Cr3+ concentration in sediment using MLPNN were: 0.84, 0.96, 0.93 and 0.96 for power intake, boatyard, tailrace and turbine discharge locations respectively while r for RBFNN were found to be 0.80, 0.91, 0.89 and 0.96 respectively (Tables 9-12). The values of RMSE for training and validation at the power intake varied between 2.490 to 4.987, while the MRE for both training and validation at the power intake location ranged between 0.724 and 0.925 (Table 9). Also the RMSE for training and validation using the two NN approaches were found between 1.957 and 4.676 while that of the MRE were observed to be within 0.7124 and 1.019 at the boatyard station (Table 10). The RMSE for the training and validation at the tailrace location varied between 2.915 and 5.238 while the MRE for training and validation ranged between 0.850 and 1.098 (Table 11). The RMSE for the training and validation at the turbine discharge location ranged between 2.628 and 4.780 while the MRE for training and validation ranged between 0.822 and 1.501 (Table 12). The RMSE and MRE obtained for Cu2+, Pb2+ and Cr3+ concentration in sediment are in the same range with the RMSE values varying between 0.33 to 23.6 and MRE values varying between 0.15 to 15.23 that were obtained in similar studies as reported by (Giri and Singh, 2014; Ay & Kisi, 2013; Ranković et al., 2010; Palani et al., 2008; Chokananporn & Tansakul, 2008). Concentrations of Cu2+, Pb2+ and Cr3+ in sediment vary between 27.9 to 68.6 mg/kg, 21.9 to 35.0 mg/kg and 39.7 to 95 mg/kg respectively. These fell within the tolerance limits of 80, 35 and 95 mg/kg stipulated by Washington Department of Ecology Sediment Quality Guidelines (WDOESQG) for concentration of heavy metals in sediment (Easthouse, 2009).
5 Conclusion
Modelling the Cu2+, Pb2+ and Cr3+ concentrations in sediment at all the sampling locations around the Lake using MLPNN and RBFNN approaches revealed that the two modelling methods modelled the parameters very well. The evaluation statistics of the models using: r, MRE and RMSE showed that the application of the NN approaches to model the sediment quality parameters gives good outcomes for all the selected locations. These modelling approaches can be adopted in similar studies.
6 Acknowledgements
The authors wish to thank the management of the Kainji Hydropower Station, Nigeria, for providing the data for this study. Also, the management of the National Centre for Hydropower research and development is also appreciated for providing logistic support in the course of this study.