
ABSTRACT
The supply of high-quality drinking water is challenging during the rainy season and floods because of the contamination of raw water by colloidal particles which increased the turbidity of water. This research presents an alternative method to repetitive use of jar test to determining the real-time values of optimum alum dosage required in coagulation-flocculation units of water treatment plants. The Radial Basis Neural Network (RBNN) was utilized to forecast the effluent turbidity and pH in water treatment. Raw water source was simulated by mixing kaolinite-clay with tap water to yield a series of initial turbidity values (20 to 200) NTU and twelve alum dosages, from 5 to 60 mg/l at 5 mg/l increment were applied for treatment. The final effluent turbidity and pH of the water were determined along with the optimum alum dosage. The results show that there is a consistent close relationship between the actual and the predicted effluent turbidity and pH values in all cases tested. The correlation coefficient of the mathematical model was 0.812 and 0.945 for pH and effluent turbidity, respectively. Overall, the results confirm the suitability of RBNN model to predict and monitor water treatment parameter values.
Notation
1 Introduction
Coagulations and flocculation processes are vital operations among the water treatment processes (León-Luque et al., 2016). The turbidity of water is a measure related to contaminants in water, such as pathogen microorganisms (Post et al., 2011). Increased turbidity in water certainly obstructs the disinfection process, effectively protecting microorganisms from contacts with the disinfectant (Baxter et al., 1999). Generally, removal of turbidity depends on coagulant dosage and type, along with other parameters of raw water quality such as temperature, electrical conductivity (EC), total dissolved solid (TDS), and pH (León-Luque et al., 2016). The coagulant dosages are basically determined empirically by operators based on their experience, jar-testing and other parameters of water quality. The determination of coagulant dosages by utilizing jar tests requires relatively longer time, costly and not effective for real time change in water quality (Al-Baidhani and Alameedee, 2017a).
The demands for continuous supply of high-quality treated water in big cities are more pressing than before. The quality of water from natural sources fluctuates because of natural causes such as heavy rain. In contrast, the capability to simulate the water treatment process perfectly is highly challenging because of the complex phenomena taking place at the several stages of the water treatment. Therefore, the efficacy of a drinking water treatment plant often depends on operator’s decision. While it is uneconomical to use more than the required dosage of coagulant, the usage of lower dose leads to the production of lower quality water (Haghiri et al., 2018). Hence, there is a need for a fast, easy, efficient and reliable method of obtaining optimum coagulant dosage rate that can be utilized instead of the jar-test method.
Engineers have used computers to manage the design and operation of treatment plants more accurately and quicker by developing mathematical models for forecasting turbidity removal and optimal coagulant dosing based on parameters of raw water quality (Al-Baidhani and Alameedee, 2017b; Baxter et al., 1999, 2001; León-Luque et al., 2016). An example is the use of Artificial Neural Networks (ANN) to predict the dosage of coagulant and control coagulation dose; the quality and completeness of training data improved the program performance which resulted in the significant saving in coagulant usage (McArthur and Andrews, 2015). The potentials of applying ANNs in this field has attracted much interest due to its efficiency in showing nonlinear phenomena like those observed in drinking water treatment plant (Dash et al., 2016; McArthur and Andrews, 2015). ANN is an appropriate technique to solve problems with intensive data due to its flexibility, rapidity and cost effectiveness (León-Luque et al., 2016; Wu and Lo, 2010).
The Radial Basis Neural Network (RBNN) is a type of Neural Networks (NNs). The RBNN has many benefits over other NNs: It can easily add or delete training information (Al-Nima, 2017); It is not affected by the local minima in the error performance function as in the networks trained with the backpropagation algorithm (Al-Nima et al., 2017); It requires no more than one iteration to fulfil the training phase (Kisi and Ay, 2012; Parsaie, 2016); and requires a very short training time (Kennedy et al., 2015; Kou et al., 2010). This study utilises RBNN to determine the effluent turbidity and pH at varied coagulant dosages for different initial turbidity of raw water. This will be useful in the determination of optimum Alum dosage and aid against excessive or deficient usage of coagulant.
2 Materials and methods
2.1 Experimental methods
The kaolinite Clay, Al2Si2O5(OH)4 and tap water were utilized to generate the synthetic turbid water needed as input for all the experimental work. The synthetic turbid water was used to simulate stormwater resulting from heavy rains. Alum (Al2(SO4)3.18H2O) was utilized as a coagulant material in the rapid mixing tank. The experimental work consists of four runs with different turbidity and coagulant dose; every run was ten sets of different influent turbidity (20, 40, 60, 80, 100, 120, 140, 160, 180, and 200) Nephelometric Turbidity Units (NTU) and twelve incremental series of Alum dose ranging from (5 to 60) mg/l for every turbidity set. The first three runs were utilised as training sets for the RBNN, while the fourth run was used as the main experimental data to test the RBNN. To reach the required concentration of the coagulant, the desired weight of dry Alum was dissolved in a litre of tap water. Five water quality parameters; Turbidity, pH, TDS, EC, and Temperature were examined and recorded.
Jar tests were conducted according to ASTM D2035 – 13 (ASTM, 2013) to determine the optimum Alum dosage for each sample. 12 samples were prepared for each turbidity level, and the concentration of Aluminium Sulphate were added from 5 mg/L to 60 mg/L, with a variation of 5 mg/L between each sample. Then, rapid mixing was done at 80 rpm for 60 seconds intervals to homogenize the distribution of coagulant in the beaker and catalyse the flocs formation. The slow mixing was carried out at a speed of 30 rpm for 15 minutes intervals to ensure the flocs were properly bonded, the flocs were then allowed to sediment for 20 minutes.
Figure 1 shows a part of the jar test experiment. After completing the Jar Tests, the five water quality parameters (Turbidity, pH, TDS, EC and Temperature) were measured again. PH levels of the solutions were monitored using CyberScan pH 510, while TDS, EC and Temperature were also determined by using CyberScan CON 510.
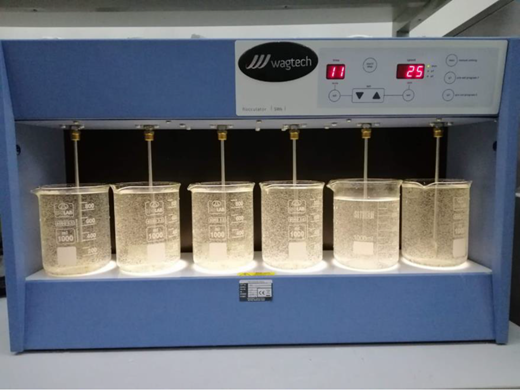
Jar test in progress
2.2 Radial basis neural network (RBNN)
The RBNN involves three essential layers namely: input, hidden and output. Radial Basis Function (RBF) is utilized in the hidden layer, while a pure linear function is exploited in the output layer (Parsaie, 2016). The inputs of this research to the RBNN are: Alum dosage, TurbidityIn and pHIn, while the outputs are TurbidityOu and pHOu. Figure 2 shows the employed RBNN structure.
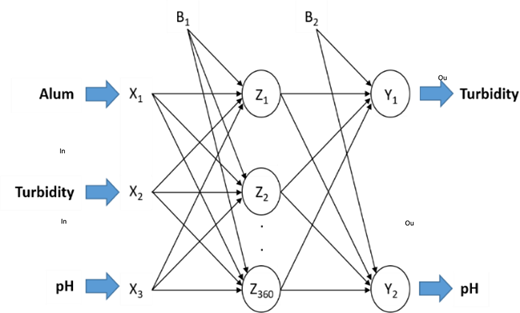
The essential architecture of the utilized RBNN
The RBNN produces the required weights in the training phase by using the determined training information. In the testing phase, these weights are important to examine the new information which are not provided before. Fundamentally, Equation (1) was implemented to calculate the outcome values of the hidden layer (Fausett, 1994; Kou et al., 2010).
where zb represents the outcome of a hidden node, x represents the input vector and represents the vector of connection weights between the hidden layer and input layer, β represents the smoothing factor of Gaussian distribution function and q represents the number of hidden neurons (q = 360). The relationship between the hidden layer and the output layer is shown in Equation (2).
Where yc the output value of an output node and the weights between the output layer and hidden layer.
3 Results and discussions
The observed values of effluent turbidity and pH at different concentration of alum and initial turbidity were obtained from the fourth experimental run. Meanwhile, the predicted values of effluent turbidity and pH were obtained from the RBNN model based on the input values. The observed and predicted values are shown in Figures 3 and 4. Figures 3(a-e) are for the initial turbidity values of 20, 40, 60, 80 and 100 NTU, respectively; while Figures 4(a-e) are for the initial turbidity values of 120, 140, 160, 180 and 200 NTU, respectively.
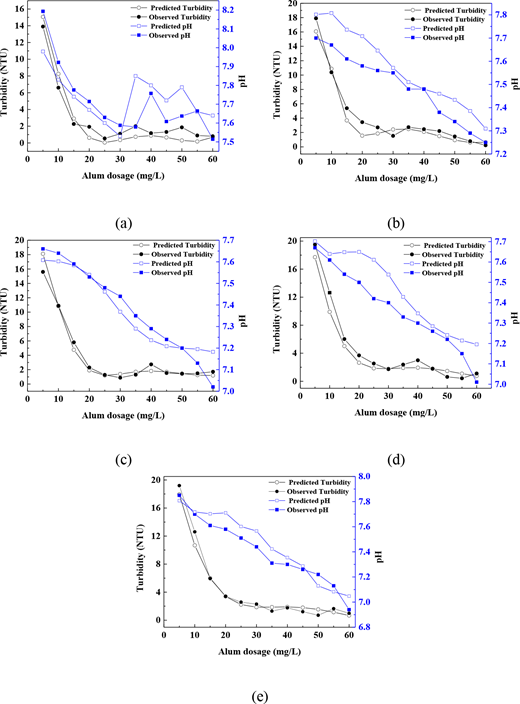
Observed and predicted effluent turbidity and pH at (a) 20, (b) 40, (c) 60, (d) 80 and (e) 100 NTU initial turbidity
Observed and predicted effluent turbidity and pH at (a) 20, (b) 40, (c) 60, (d) 80 and (e) 100 NTU initial turbidity
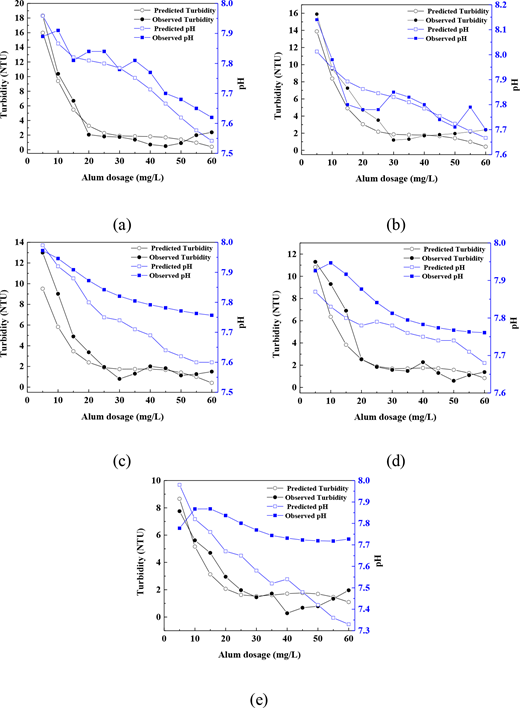
Observed and predicted effluent turbidity and pH at (a) 120, (b) 140, (c) 160, (d) 180 and (e) 200 NTU initial turbidity
Observed and predicted effluent turbidity and pH at (a) 120, (b) 140, (c) 160, (d) 180 and (e) 200 NTU initial turbidity
The results show that there is a consistent close relationship between the actual and the predicted effluent turbidity and pH values for the different concentrations of initial turbidity and Alum dosages. Figures 3 and 4 portray that the optimum Alum dosages, which translates to lower effluent turbidity also yielded low pH values for all the initial turbidity values. In fact, all the initial turbid water has higher pH values and the pH only reduces as the Alum dosages increase until the optimum Alum dosage was reached. Figures 5(a) and (b) shows the correlation between the predicted and observed values of pH and turbidity for all the initial turbidity values and Alum dosages. The correlation coefficients of turbidity and pH on the validation set were determined to be 0.945 and 0.812, respectively, and these values are close to the optimal value of R2=1. The correlation coefficients proved that RBNN model predicts the results precisely, therefore, the RBNN is effective for the predicted data.
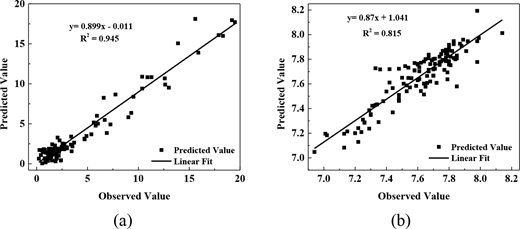
Relationship between observed and predicted effluent turbidity and pH
Table 1 shows error measurements of RBNN model, and the sum of the mean squared errors of turbidity and pH were found to be 1.282 and 0.013, respectively. Likewise, the Mean Absolute Deviation (MAD), Mean Square Error (MSE), Mean Absolute Percentage Error (MAPE) and Root Mean Square Error (RMSE) are computed between the output of RBNN and desired testing target. All the employed statistical measurements show the close relationships between the observed and predicted parameters. This confirmed the validity of the RBNN model to forecasts the effluent turbidity and pH.
Error measurements of neural network model
| Parameter | Turbidity | pH |
|---|---|---|
| Mean Absolute Deviation (MAD) | 0.854 | 0.086 |
| Mean Square Error (MSE) | 1.282 | 0.013 |
| Mean Absolute Percentage Error (MAPE) | 7.945 | 1.140 |
| Root Mean Square Error (RMSE) | 1.132 | 0.112 |
Tables 2 and 3 show the range of values of tested parameters for both synthesis raw water (input) and treated water (output), respectively. Coagulation reactions of forming floc particles are considerably more ideal at higher temperatures leading to more efficient coagulation. This revealed the influence of temperature on settling of floc particle, when temperature decreases, the water viscosity increases causing slower settlement (Kennedy et al., 2015). There are no significant changes in the values of minimum and maximum TDS for both the raw and treated water, however the values are below 300 mg/L which is ideal for drinking water (Edzwald, 2010). The EC increases in the output water because of the reduction in the effluent turbidity compared to the initial turbidity values (Kalavathy et al., 2017). The training elapsed time for all training samples was 0.35 seconds, while the testing elapsed time for all testing samples was 0.17 seconds. Obviously, these benchmarked times confirmed the effectiveness of our proposed approach for producing a training or testing output in real-time implementation.
Characteristics of the input water
| Turb. (NTU) | pH | Temp. (°C) | TDS (ppm) | EC (µm/cm2) | |
|---|---|---|---|---|---|
| Max. | 200 | 8.73 | 18.7 | 293 | 567 |
| Min. | 20 | 7.31 | 11.3 | 228 | 457 |
Characteristics of the output water
| Turb. (NTU) | pH | Temp. (°C) | TDS (ppm) | EC (µm/cm2) | |
|---|---|---|---|---|---|
| Max. | 20.0 | 8.2 | 19.3 | 283 | 587 |
| Min. | 0.11 | 6.9 | 11.8 | 223 | 448 |
4 Conclusion
This research presented an alternative method to the repetitive use of jar test to determining the real-time values of optimum alum dosage required in coagulation-flocculation units of water treatment plants. An intelligent multiple layer RBNN was proposed to carry out the prediction of effluent turbidity and pH values. The results revealed that predicted values from the RBNN are quite close to those obtained from the experimental method. When the desired effluent turbidity and pH are known, the RBNN can be effectively used to estimate optimum alum dosage in coagulation-flocculation units of water treatment plant, and this will reduce the cost, efforts and time spent on manual jar test procedures.