

This paper examines the relationship between poison pills, real earnings management and initial public offering (IPO) failure.
The authors sampled 2,997 IPO firms that went public during 1993-2015.
The authors find that IPO firms manipulate earnings upward using real earnings management. The authors also find that IPO firms exhibiting a higher level of real earnings management have a higher probability of IPO failure. In addition, the authors find that weak shareholders' governance is positively associated with IPO failure.
These results suggest that poor governance structures in failed firms open the door to manipulating real activities and increasing operational risk.
The study findings are of most significant interest to potential investors and other stakeholders affiliated with a firm going public, an auditor, an underwriter, the lawyers who consult with the firm and employees or executives who might consider joining that firm.
Introduction
In April 2022, the board of Twitter voted unanimously to adopt a poison pill plan after Elon Musk offered to buy the company for $43bn, putting poison pills back in the headlines. Many well-known companies such as Papa John's, Netflix, JCPenney and Avis Budget Group have successfully used poison pills to fend off hostile takeovers. Furthermore, nearly 100 companies adopted poison pills in 2020 because they were worried that their careening stock prices, caused by the pandemic market swoon, would make them vulnerable to hostile takeovers. On the one hand, poison pills are considered a poor corporate governance practice that can hurt a company's value and performance. They are considered impediments to the ability of shareholders and outsiders to monitor management and are more about protecting the board and management than attracting more generous offers from potential buyers. On the other hand, shareholders may benefit from poison pills if they lead to a higher bid for the company. This paper examines the relationship between poison pills, real earnings management and initial public offering (IPO) failure.
We examine the poison pill as opposed to other entrenchment index governance provisions for several reasons. First, poison pills represent the most severe impediment to hostile takeovers and are, therefore, one of the most effective antitakeover provisions. Second, prior research examines three conflicting arguments on poison pills: the entrenchment argument, the shareholders' interest argument and the no-effect argument. The entrenchment argument revolves around poison pills entrenching managers at shareholders' expense, implying that poison pill adoption has a value destruction impact. In contrast, the shareholders' argument argues that poison pill adoption improves the firm's operations or increases expected takeover premiums, implying that poison pill adoption has a value creation impact. The last argument is the no-effect argument whereby the adoption of a poison pill has little impact, either because the actual adoption of a pill is not meaningful (because all firms have latent pills) or because the director labor market does not react strongly to directors' actions. Third, there needs to be much consensus regarding the motivation behind poison pill adoption. The first stream of the research argues that poison pills provide wealth to shareholders (Stein, 1988; DeAngelo & Rice, 1983; Schwert, 1996). Conversely, the second stream shows that they entrench management and destroy shareholder wealth (Jensen & Meckling, 1976; Fama, 1980). Hence, whether poison pill adoption increases the likelihood of IPO failure remains an important unanswered empirical research question.
Based on two main arguments, we predict that poison pill adoption is positively associated with IPO failure. On the one hand, under the shareholder alignment mechanism view, firms experiencing financial distress could adopt poison pills as a “self-defense” mechanism against potential hostile takeovers that would protect shareholder interests and maximize wealth. On the other hand, under the entrenchment mechanism view, managers could use extreme market devaluations as an excuse to promote managerial entrenchment by adopting poison pills under the pretext of protecting shareholders' interests.
To test our hypothesis, we use a U.S. panel data set of 2,997 firm-year observations from 1993 to 2015. Following Demers and Joos (2007), we first classify firms as “failures” within the five years subsequent to their IPO if their CRSP (The Center for Research in Security Prices) delisting codes are in the 400 range (“liquidations”) or the 500 range (“dropped”). We exclude firms with delisting codes 501–503 (“stopped) trading on current exchange to move to “NYSE (The New York Stock Exchange), AMEX (The American Stock Exchange) or NASDAQ” and 573 (“delisted by company request—gone private”). All other firms that did not fail during their sixth year after the IPO are considered non-failures. We use the modified cross-sectional Jones model to measure accrual earnings management described by Dechow, Sloan, and Sweeney (1995), and we follow Roychowdhury (2006) to estimate real earnings management. Data on poison pills are collected from the Institutional Shareholder Services database (Bebchuk, Cohen & Ferrell, 2006).
We find that IPO firms exhibiting a higher level of real earnings management have a higher probability of IPO failure. In addition, we find that weak shareholders' governance is positively associated with IPO failure. These results suggest that poor governance structures in failed firms open the door to manipulating real activities and increasing operational risk. More importantly, we find that the association between the interaction of poison pill adoption and both real and accrual earnings management and the IPO failure is positive and statistically significant. Our results suggest that poison pill adoption is conducive to poor governance and incentivizes managers to manipulate accounting numbers using real and accrual earnings management types.
We further explore whether or not our main results that poison pill adoption increases the likelihood of IPO failure is solid to an alternative measure of IPO failure, model specification and other cross-sectional analyses. Our additional analyses document that the positive and significant relationship between IPO failure and poison pill adoption remains unchanged after using Altman's (1968) Z-Score. We also show that high-growth companies that adopt poison pills exhibit higher levels of real earnings management and are more likely to fail than low-growth firms. Finally, our results highlight that the positive relationship between IPO failure and poison pill adoption is more pronounced in the subsamples of the high-tech and high-product market competition firms.
Our contributions are threefold. First, we contribute to the literature on the economic consequences of poison pill adoption. Our paper shows that poison pill adoption is an aggressive managerial entrenchment mechanism when a firm faces a higher likelihood of IPO failure risk, thereby not benefiting investors (Garcia-Sanchez et al., 2020). Second, we contribute to the literature on poison pills because, to the best of our knowledge, this is the first study to examine the effect of poison pill adoption on IPO failure. Thus, we complement previous research (Azevedo, Schwarz, Gomes, & Ambrozini, 2023; Bhargava, Faircloth, & Zeng, 2017; Bhojraj, Sengupta, & Zhang, 2017; Eldar & Wittry, 2021) by examining whether poison pill adoption contributes to IPO failure.
Finally, our paper has several corporate governance implications. First, we shed light on the cost of poison pill adoption that is not in the shareholders' best interest. Given the controversy surrounding poison pill adoption by U.S. policymakers, our results could be useful for shareholders and stakeholders since, by identifying the costs of poison pills, boards can adopt corporate governance strategies to avoid them. Second, our study extends Bhargava et al. (2017) work, which documents that state antitakeover laws in the U.S. decreased poison pill adoption in several ways. Also, we look at the cost, not the drivers, of adopting poison pills.
Furthermore, we use the IPO setting to explore how poison pill adoption could compromise the success of an IPO. In the IPO context, firms could adopt poison pills to protect shareholders' interests and the firm's strategy and business models or for the managers to seek private benefit. This unique setting enables us to test the entrenchment hypothesis proposed by Bhargava et al. (2017) and, consequently, expand prior findings by looking at whether poison pill adoption in the IPO setting is related to aggressive managerial entrenchment practices through earnings manipulations. Finally, we primarily focus on scrutinizing one specific antitakeover defense instead of examining antitakeover laws spanning various mechanisms, each with different characteristics that do not always focus on benefiting shareholders, such as golden parachutes, as discussed by Maskara and Miller (2018).
The remainder of the paper is organized as follows. Section 2 provides the background of our research and hypothesis development. Section 3 describes the sample and data and presents the research design. Section 4 reports the main analysis of the impact of real earnings management, shareholders' governance on IPO failure and cross-sectional analyses. Section 5 reports additional analyses, and Section 6 concludes.
Literature review and hypothesis development
Corporate governance practices, earnings management and IPO failure
Strong shareholder governance limits opportunistic managerial behavior and reduces the information asymmetry between insiders and external stakeholders. Establishing effective corporate governance that protects minority shareholders is arguably most important during an IPO because the IPO represents the first time that most firms raise equity from dispersed investors. Shareholders primarily exercise influence through voting rights, litigation and threatening to sell their shares, while other mechanisms, such as auditors and board members, have a more direct role in financial reporting (Bebchuk & Cohen, 2005; Chiu, Teoh, & Tian, 2013). Zhao and Chen (2008) used the entrenchment, alignment and quiet life theories to test the relationship between takeover protection and the accrual type of earnings management. They find that takeover protection is associated with lower levels of abnormal working capital accruals, lower performance-adjusted abnormal accruals and timelier recognition of losses supporting quiet life theory. Zhao and Chen's (2008) results imply that takeover protection allows managers to enjoy a quiet life and reduces earnings management. In a follow-up study, Zhao, Chen, Zhang, and Davis (2012) found that less-protected firms are associated with higher levels of real earnings management, consistent with Stein's (1988) prediction that takeover pressure induces managerial myopia.
Based on the agency explanation, Gompers, Ishii, and Metrick (2003) show that stronger shareholder rights are associated with higher abnormal returns, lower capital expenditures, fewer corporate acquisitions and firm value, as measured by Tobin's Q. In addition, John, Litov, and Yeung (2008) conclude that better shareholder protection mitigates the extraction of private benefits. They argue that firms with weak shareholder governance may be willing to render their company safe by adopting conservative investment policies. Thus, managers may engage in inefficient projects to extract private benefits. In the same context, Bebchuk et al. (2006) argue that the high level of entrenchment might lead to further deterioration in future performance and large negative abnormal returns during the 1990–2003 period. In other words, entrenchment would harm firm value. Hochberg (2012) argues that aggressive firms have a lower probability of survival; they may be more willing to be aggressive initially since, due to the probability of failure, they are less likely to incur the reputational cost at a later date. He finds that non-venture-backed firms have higher levels of earnings management, less positive reactions to adopting shareholder rights agreements and less independent board structures than similar venture-backed firms. Thus, the risk of failure increases with weak governance. Also, Baker and Gompers (2003) argue that the IPO is a time of significant change in the firm's governance and showed that firms not backed by venture capital have a higher failure rate.
Moreover, holding a constant CEO (Chief Executive Officer) and backing venture capital reduces the probability of failure by about 7%. Gertner and Kaplan (1996) emphasize that firms undertaking a public offering are more likely to improve their governance characteristics than public firms because insiders bear the financial effect of such features. The delisting phenomenon is both interesting and important. Goktan, Kieschnick, and Moussawi (2006) examined the relationship between corporate governance structures and a company's likelihood of going private, acquired or bankrupt. They find that selected features of corporate governance are related to the likelihood that a firm will be acquired or goes private but not to the likelihood that it will go bankrupt.
Colak, Gounopoulos, Loukopoulos, and Loukopoulos (2021) examined the prediction that higher tournament incentives significantly reduce the likelihood of IPO failure risk. They show that an interquartile change in the CEO pay gap distribution translates into a failure risk probability decline of approximately 27%. These results suggest that everything else being equal, pay disparities among top managers signal the provision of value-enhancing incentives that support IPO survival odds.
The drivers and economic consequences of poison pill adoption
Several studies have examined the drivers and economic consequences of poison pill adoption. These determinants can be classified into (1) corporate governance practices, (2) accounting metrics and (3) financial market metrics.
Previous research on corporate governance mechanisms shows that board interlocking (Davis, 1991), CEO tenure (Arikawa & Mitsusada, 2011), executive compensation plans (Azevedo et al., 2023), institutional ownership (Bhojraj et al., 2017) and staggered boards (Heron & Lie, 2015) are corporate governance practices that determine the adoption of poison pills, whereas board size (Azevedo et al., 2023; Loh, 1994) and CEO/managerial ownership (Al Dah, Michael, & Dixon, 2017; Arikawa & Mitsusada, 2011; Heron & Lie, 2006, 2015) influence negatively. However, previous literature findings also diverge regarding the relationship between the adoption of poison pills and board independence. Bhojraj et al. (2017) document that board independence increases the likelihood of adopting poison pills, suggesting that good governance practices complement the takeover protections to influence the long-term orientation. In contrast, Al Dah et al. (2017) found a negative relationship between board independence and poison pill adoption, supporting the entrenchment argument.
The second line of inquiry, grounded in accounting-based drivers, shows the controversial relationship between accounting-based measures and poison pill adoption. Previous research shows that leverage and R.D. expenditures are positively associated with adopting poison pills (Eldar & Wittry, 2021), whereas firm performance, sales growth and excess cash are negatively associated (Azevedo et al., 2023).
In the third line of inquiry, Davis (1991) employs market value as an alternative proxy for firm size and shows consistent results indicating that larger firm size decreases a firm's risk of takeover, thus lowering the incentive to adopt poison pills. Further results also show the positive influence of market-to-book ratio on the adoption of poison pills (Harris & Madura, 2010; Heron & Lie, 2006), corroborating the view that firms with higher growth opportunities are more attractive targets for takeovers (Cyert, Kang, & Kumar, 2002). Therefore, these firms must adopt poison pills to prevent hostile takeover attempts.
Hypothesis development
Whether and how poison pill adoption is related to the likelihood of IPO failure is an open-ended question – unclear, ex ante. We predict that poison pill adoption is positively related to IPO failure mainly through two channels. Firms facing a higher likelihood of IPO failure through the shareholder alignment channel could adopt poison pills as a “self-defense” mechanism against potential hostile mergers and acquisitions, protecting shareholder interests and maximizing wealth. However, under the entrenchment mechanism, managers could use IPO financial challenges to perpetuate managerial entrenchment under the claim of looking after shareholders' interests. DeAngelo and Rice (1983) argue that entrenched CEOs are more protected from being targeted by a hostile takeover than those not entrenched. This can cause shareholder value destruction as real and financial decisions focus on maximizing the CEO utility function rather than shareholder interests.
Poison pill adoption is associated with a higher likelihood of IPO failure.
Research design
Sample selection
We collect data on American firms from COMPUSTAT annual industrial and research files from 1993 to 2015. The details of the sample selection process are summarized in Table 1 (Panel A). Our initial sample includes 186,543 firm-year observations. We require that each firm-year observation contains sufficient data to calculate the discretionary accruals metrics and real earnings management proxies employed in our analysis. Data on corporate governance are obtained from risk metrics. Data on IPO firms are obtained from Jay Ritter's IPO website and SDC Platinum database. In order to distinguish between continuing and failed firms, we identified corporate delisting from the CRSP event file. We classified firms as (“failures”) first if their CRSP delisting codes were in the 400 range (“liquidations”) or the 500 range (“dropped”), excluding firms with delisting codes of 501–503 (“stopped) trading on current exchange to move to NYSE, AMEX or NASDAQ and 573 (“delisted by company request—gone private”) and second if they failed to survive within the five years subsequent to their IPO. All other firms that had not failed by their sixth year after the IPO were considered to be “non-failures.” As a further specification check on our dependent variable, we use the SDC Corporate Restructurings Database. We classify all firms identified in either the SDC Corporate Restructurings database or those that do not have a CRSP code of 100 as failures. Following Hribar and Collins (2002), we use cash flows from operations obtained from the Statement of Cash Flows reported under the Statement of Financial Accounting Standards No. 95 (SFAS No. 95, FASB 1987). Then, we eliminate firms in regulated industries (SIC (The Standard Industrial Classification) codes between 4400 and 5000) and banks and financial institutions (SIC codes between 6000 and 6500). The models for normal and expected CFO (Chief Financial Officer), production costs, discretionary expenses, and accruals are estimated for every year and industry. This process results in a final sample of 2,997 firm-year observations. In order to reduce the potential effect of extreme observations, all the continuous variables are winsorized at 1% and 99%.
Sample selection and industry distribution for the IPO sample (1993-2015; N = 2,997)
| Panel A: Sample selection procedure | Firm-year |
|---|---|
| Total number of firm-year observations from 1993–2015 with Compustat, CRSP, IPO Ritter, SDC and ISS Database | 186,543 |
| Less: financials and utility firm | 7,673 |
| Less: missing values for variables used in the regressions | 171,626 |
| Final sample | 2,997 |
| Number of unique firms | 642 |
| Failure firms | 220 |
| Non-failure firms | 422 |
| Panel B: Industry distribution of IPOs | |||||||
|---|---|---|---|---|---|---|---|
| Pooled sample | Delisted for negative reasons | Survivors | |||||
| Industry | SIC | Freq | % | Freq | % | Freq | % |
| Mining | 10-14 | 127 | 4.24 | 29 | 3.88 | 98 | 4.36 |
| Construction | 15-17 | 25 | 0.84 | 1 | 0.13 | 24 | 1.07 |
| Manufacturing | 20-39 | 1,561 | 52.09 | 414 | 55.24 | 1,148 | 51.03 |
| Transportation | 50-51 | 22 | 0.73 | 2 | 0.27 | 20 | 0.89 |
| Wholesale trade | 52-59 | 370 | 12.34 | 78 | 10.41 | 292 | 12.98 |
| Retail trade | 70-89 | 892 | 29.76 | 224 | 30.07 | 667 | 29.67 |
| Total | 2,997 | 100 | 748 | 100 | 2,249 | 100 | |
Note(s): This table reports time and industry distributions for the pooled IPO sample, IPOs delisted for negative reasons and non-failed IPOs. Panel A presents the time distribution, while Panel B presents the industry distribution
Source(s): Table by authors
Table 1, Panel B, reports the distribution of IPO failure relative to the industry standard classification measured by two-digit SIC codes. It shows that manufacturing and retail trade industries represent most of the failures in the sample (85%). This type of industry has a high litigation risk (Barton & Simko, 2002); thus, these firms have a higher likelihood of delisting than other industries.
The measure of real earnings management
Models of real earnings management have been developed in recent empirical studies (Gunny, 2005; Roychowdury, 2006; Cohen & Zarowin, 2010). These studies showed that managers manipulate their results through real activities, including sales manipulation, overproduction and reduced discretionary expenditures. Roychowdhury (2006) and Cohen, Dey and Lys (2008) approximated the level of real earnings management by focusing on the following three methods of manipulation of real activities that allow companies to increase their reported results:
Sales manipulation: Managers can temporarily increase sales volume during the year by offering a price discount or more lenient credit terms, causing the inflow per sale to be lower than inflows related to regular operations. Indeed, in the normal operating cycle, the effect of sales on operating cash flows is habitual (positive). However, if managers engage in this activity more intensively than normal, intending to achieve a threshold of income, the impact will be unusual (negative). The manipulation of sales leads to discretionary (abnormal) levels of operating cash flows. In general, Roychowdhury (2006) assumes that real earnings management reduces the level of cash flows from operating activities during the year compared to a normal level of sales. However, he expects that the results of the year will increase globally. In addition, increased sales volumes will likely disappear when the firm re-establishes its old prices. Indeed, Herrmann, Inoue, and Thomas (2003) showed that Japanese firms increased their results by managing their sales when operating outcomes during the year dropped compared to management's expectations. They note that companies may increase (or decrease) results by selling fixed assets and marketable securities when the current operating income falls below the forecasts of directors.
Reduction of discretionary expenditures: Discretionary expenditures, research and development, advertising and maintenance expenditures are usually expended during the same period they are incurred. The firm can reduce reported expenses and achieve the desired earnings by reducing discretionary expenditures. This will likely occur when such expenditures do not generate immediate revenues and income. Discretionary expenditures were defined by Roychowdhury (2006) as the sum of expenditures on research and development (R&D), advertising (e.g. packaging) and general and administrative expenses (e.g. staff training, maintenance, travel). Indeed, these costs are generally high during the period they are incurred. In addition, they are characterized by several attributes. For example, Holmstrom (1989) shows that investment in R&D is characterized by a long-time horizon and a high risk associated with a high probability of failure due to the illiquidity and uncertainty of future profits. Therefore, companies that want to improve their performance have more incentives to reduce discretionary spending.
Overproduction: To increase earnings, managers can produce more goods than necessary to attain the expected demand. Indeed, firms can reduce the cost of goods sold by increasing their production, spreading the fixed cost over a larger number of units and reducing the unit cost of production. In this way, firms can improve operating margins (Roychowdhury, 2006). Thomas and Zhang (2002) argued that U.S. firms engage in excessive production in year 0 to reduce the cost of goods sold and subsequently present an increase in their results. Roychowdhury (2006) uses the model of Dechow, Kothari, and Watts (1998) to obtain normal levels of CFO, discretionary expenses and production costs for each firm year. Deviations from normal levels are called abnormal CFO, production costs and discretionary expenditures. Zang (2012) and Gunny (2005) provide evidence of the construct validity of these proxies. We focus on three individual metrics, abnormal levels of cash flow from operations (AbnCFO), abnormal levels of production costs (AbnPROD), abnormal levels of discretionary expenses (AbnDISX) and an aggregate metric to measure the level of real earnings management. We run the following cross-sectional regression for every industry and year:
Abnormal cash flow from operations is the actual CFO minus the normal CFO for every year-firm. The model for normal COGS (cost of goods sold) is estimated as follows:
Besides, we estimate the model for normal inventory growth using the following regression:
Finally, we estimate normal production costs using the following regression:
If the company manipulates sales upward to increase reported earnings and does not reduce discretionary expenses, this can result in unusually low residuals from the aforementioned regression in that year. Roychowdhury (2006) proposes that discretionary expenses should be expressed as a function of lagged sales:
The abnormal CFO, abnormal production costs and abnormal discretionary expenses are defined as the actual values minus the normal levels predicted from equations (1), (4) and (5). We use these three variables as proxies for real earnings management. In addition, we compute the aggregate measure of real earnings management by combining the three individual estimates. Specifically, we compute RM_PROXY as the sum of the standardized variables of AbnCFO, AbnPROD and AbnDISX. We also report results corresponding to this single real earnings management proxy. We acknowledge that the underlying three individual variables may have different implications for earnings that may dilute any aggregate measure results. We thus report results corresponding to the three individual real earnings management proxies (AbnCFO, AbnPROD and AbnDISX). The definition of our variables is presented in Table A1.
Variable definitions
| Variable name | Definition |
|---|---|
| Failure | The indicator variable is equal to 1 if the firm failed within five years after IPO and 0 otherwise |
| Altman Z-Score | Equal to the sum of [1.2 × (current assets - current liabilities)/total assets + 1.4 × retained earnings/total assets +3.3 × earnings before interest and taxes/total assets + 0.6 × market value of equity/book value of total liabilities + 0.1 × sales/total assets] |
| Earnings management variables | |
| AbnCFO | Abnormal cash flow from operations is measured as deviations from the predicted values from the corresponding industry-year regression |
| AbnPROD | Abnormal production is measured as deviations from the predicted values from the corresponding industry-year regression |
| AbnDISX | Abnormal discretionary expenses are measured as deviations from the predicted values from the corresponding industry-year regression |
| Rm_PROXY | The sum of the standardized three real earnings management proxies |
| Abs_DA | The absolute value of discretionary accruals is computed using the Modified Jones model |
| Entrenchment variable | |
| Poison pill | A shareholder right is triggered in the event of an unauthorized change in control that typically renders the target company financially unattractive or dilutes the voting power of the acquirer |
| Control variables | |
| Offer_price | IPO offer price |
| Firstday_ret | First-day initial returns: closing price on the IPO date less offer price as % of the offer price |
| Leverage | Total liabilities are divided by the sum of total assets plus the proceeds raised at the IPO date |
| Gross_margin | The ratio of sales minus cost of goods sold to sales |
| Big4 | The indicator variable equals 1 if the firm has Big 4 and 0 otherwise |
| BTM | The book-to-market ratio is calculated as the book value of equity divided by the market value of equity |
| Nidummy | The indicator variable equals 1 if the firm has negative earnings and 0 otherwise |
| VC dummy | Dummy variable that equals 1 if the IPO firms are backed by VC and 0 otherwise |
| Logage | Measured as the natural logarithm of 1 + IPO firm age, where firm age is calculated as the difference between the firm's founding date and its IPO date |
| Overhang | Overhang is defined as the number of shares outstanding prior to the issue minus secondary shares offered in the IPO, all divided by the total shares offered in the IPO |
| Investment opportunity | We measure investment opportunities as the ratio between research and development (R&D) expense and net sales |
| Product market competition | The product market competition is measured as (−1) times Herfindahl–Hirschman Index (Hj) computed as the sum of squared market shares of all firms on Compustat in an industry based on a three-digit SIC code. Market share is calculated based on the ratio of firm i's sales to the industry j's total sales |
| High-/low-technology firms | The dummy variable takes a value of 1 if the firm belongs to the high-tech industry (DHTECH) and 0 if it belongs elsewhere |
Source(s): Table by authors
In this section, we report our main tests of H1. The logistic regression model is appropriate in our analysis to test the association between real earnings management and IPO failure. However, as we indicate earlier, we use different measures of real earnings management, as suggested by Zang (2012) and Cohen and Zarowin (2010), such as sales manipulation, reduction of discretionary expenditures, overproduction and aggregated measures. The research design in this study is based on prior studies that examine the impact of real earnings management on IPO failure. The baseline specification is therefore as follows:
The measure of accrual-based earnings management
We include discretionary accruals in our baseline regression as several studies have found that accounting information is useful in predicting IPO failure (Joseph et al., 2006; Ward, 1994; Demers & Joos, 2007; Wu, Gaunt, & Gray, 2010). Using a cross-sectional discretionary accruals model, we estimate the model for every industry classified by its 2-digit SIC code and for each year (Kasznik, 1999; DeFond & Jiambalvo, 1994). We use the modified cross-sectional Jones model estimated for each 2-digit SIC-year.
TA represents total accruals, defined as earnings before extraordinary items and discontinued operations minus the operating cash flows from continuing operations. Assetit-1 represents total assets at the beginning of the year; ΔSalesit is the change in sales during a year scaled by total assets at the beginning of the year and PPEit is the gross value of property, plant and equipment scaled by total assets at the beginning of the year. The coefficient estimates from equation (1) are used to estimate the firm-specific normal accruals (NAit) for our sample firms:
where ΔRECit is the change in receivables during the year scaled by total assets at the beginning of the year. The discretionary accruals measure is the total accruals minus the fitted normal accruals, DAit= (TAit/Assetit−1)–NAit. We compute the absolute value of discretionary accruals to proxy for earnings management because accruals reverse over time.
The measure of shareholder governance: poison pill
Previous literature documents two competing effects of takeover protection on real earnings management. Based on the entrenchment theory, takeover protection is a type of weak governance that exacerbates agency conflicts between managers and shareholders and is associated with poor performance, which encourages managers to engage in accrual and real earnings management at the expense of shareholder value. A competing view suggests that takeover protection improves the alignment between managers' and shareholders' long-term interests, thus mitigating opportunistic managerial behavior. To address this issue, we create a dummy variable capturing the enhanced takeover protection that takes 1 for firms with a poison pill provision and 0 otherwise. As a robustness check, we also adopt a dummy variable with a value of 1 for firms with a staggered board structure as well as a poison pill and 0 otherwise because the combined effect has a far more powerful antitakeover device than the classified board alone (Bebchuk & Cohen, 2005; Chen, 2012). In doing so, we focus only on the provisions that matter and avoid giving weight to other provisions of little significance. Therefore, to investigate the association between real earnings management, Poison pill and IPO failure, we test this hypothesis using the following model:
We regress real earnings management aggregates, discretionary accruals and shareholder governance on IPO failure. Teoh, Welch, and Wong (1998a) argued that during the IPO, managers manipulate earnings upward in order to mislead investors. Managers switch between accrual and real earnings management based on the costs associated with each type (Zang, 2012). Cohen et al. (2008) found that firms use real earnings management in the post-SOX (Sarbanes–Oxley Act) period or the presence of high-quality auditors heightened scrutiny of accounting practices. Other studies find that managers use both types of earnings management as complementary tools. Also, we expect that high managerial entrenchment is associated with a high probability of IPO failure. Following previous studies, we consider many variables for explaining IPO failures. We include proxies for expert intermediaries such as venture capitalists and auditors. Unlike non-VC-backed IPOs, Jain and Kini (2000) show that IPO firms backed by VC have a higher probability of survival. The results of Brav and Gompers (1997) indicate that over five years, VC-backed IPOs outperform non-VC-backed firms only in cases when returns are weighted equally. Accordingly, we include a dummy variable (VC_Dummy) for whether a company was VC backed at the IPO date. We include audit quality as firms are motivated to employ high-quality auditors to signal their quality to the market. Consistent with this, Michaely and Shaw (1994) found a negative association between prestigious auditors and IPO firms that seem risky.
In addition, Charitou, Lambertides, and Trigeorgis (2007) found that qualified audit opinions and more prestigious auditors are associated with IPO firms that are less likely to fail and less risky. In the reported results, we use an indicator variable (Big 4) equal to 1 if the auditor is a Big 4 firm and 0 otherwise. We also include IPO-related deal and firm characteristic proxies such as first-day initial returns (Firstday_ret) as the closing price on the first day of trading minus the offer price, all scaled by the offer price. Underpricing is widely discussed in the IPO literature. As Ritter (1984) explained about the model of Rock, there is a relation between underpricing of an IPO and investors' uncertainty. We expect this variable to be positively associated with the probability of failure if it captures the uncertainty in the valuation. Alternatively, if high-quality firms use underpricing to signal their quality, we expect Firstday_ret to be negatively associated with failure.
Consistent with prior studies (Demers & Joos, 2007; Jain and Kini, 2000 and Yung, Çolak, & Wang, 2008), we control for the IPO firm's age (Logage) as the natural log of one plus the number of years from the firm's incorporation date to the date of its IPO. We also control for the IPO offer price (Offer_price) and expect a negative association between this variable and the probability of failure as previous studies show that established firms have a lower risk of failing within a few years of IPO. We also control the shares retained by pre-IPO shareholders over the shares issued in the offering (Overhang). If the number of shares issued in the IPO is small relative to the shares retained by pre-IPO shareholders, the market price will be higher (Habib & Ljungqvist, 2001 and Ljungqvist & Wilhelm, 2003). This would result in less underpricing. Finally, we include financial accounting variables and fundamental risk measures as they have been documented to be important predictors of firm failure. First, we control for leverage (Leverage), defined as the total liabilities divided by the sum of total assets plus the proceeds raised at the IPO date. We also include the gross profit margin percentage (Gross_margin), defined as sales minus cost of goods sold, all divided by sales. This variable captures the production efficiencies, pricing power and company brand names. Thus, we expect a negative relationship between IPO failure and gross margin. In order to control for growth opportunities, we include in the baseline regression the book-to-market (BTM) ratio, calculated as the book value of equity divided by the market value of equity. We include a variable to capture the firms' accumulated deficits (Nidummy). By definition, firms with prominent negative retained earnings balances have a history of losses, but in the technology sector, these losses are presumed to result from expenditures on the creation of intangible assets. Furthermore, we control for profitability, proxied by return on assets (ROA). Finally, we include Fama-French 48 industry and year fixed effects to control for industry and time-invariant factors that affect the relationship between earnings manipulation, poison pill and IPO failure.
Main empirical results
We begin with an exploratory analysis of the trends over time in the various earnings management metrics and shareholder governance variables. Table 2 (Panel A) provides summary statistics of the full sample, while Panels B and C present the descriptive statistics of IPOs for both delisted for negative reasons and survivor IPO firms. The means of real earnings management proxies (AbnCFO, AbnPROD and AbnDISX) for survival IPOs are lower than those for failed firms, suggesting that failed IPO firms engage in real earnings management behavior than non-failed firms. This result suggests that managers prefer cutting discretionary expenses to increase reported earnings, reduce cost production and manipulate sales. The average aggregate measure of real earnings management for the pooled, delisted and survivor samples was approximately 0.087, 0.109, and 0.080, respectively. Furthermore, the average for absolute discretionary accruals is higher for failed firms (0.068) than for non-failed firms (0.059). This result confirms previous studies finding that during the IPO, managers manipulate earnings upward in order to mislead investors.
Descriptive statistics
| Variables | Obs | Mean | Std. Dev | Median | Min | Max |
|---|---|---|---|---|---|---|
| Panel A: Pooled sample | ||||||
| AbnCFO | 2,997 | −0.053 | 0.094 | −0.051 | −0.485 | 0.495 |
| AbnPROD | 2,997 | 0.094 | 0.193 | −0.090 | −0.984 | 1.239 |
| AbnDISX | 2,997 | 0.128 | 0.251 | 0.095 | −1.086 | 1.75 |
| Rm_PROXY | 2,997 | 0.087 | 0.163 | 0.060 | −0.772 | 1.169 |
| Poison Pill | 2,997 | 0.307 | 0.461 | 0 | 0 | 1 |
| Accruals | 2,997 | −0.075 | 0.101 | −0.062 | −1.998 | 0.399 |
| Abs_DA | 2,997 | 0.061 | 0.08 | 0.039 | 0 | 1.827 |
| Offer_price | 2,997 | 29.511 | 26.592 | 21.500 | 0.1 | 265 |
| Firstday_ret | 2,997 | 19.64 | 17.331 | 16.200 | −0.188 | 279 |
| BTM | 2,997 | 0.511 | 0.369 | 0.421 | 0.054 | 2.392 |
| Leverage | 2,997 | 0.542 | 0.444 | 0.400 | 0.105 | 2.454 |
| Log_age | 2,997 | 2.611 | 0.986 | 2.564 | 0 | 7.643 |
| ROA | 2,997 | 0.039 | 0.116 | 0.054 | −0.768 | 0.282 |
| VC_Dummy | 2,997 | 0.468 | 0.499 | 0 | 0 | 1 |
| big4 | 2,997 | 0.654 | 0.476 | 1 | 0 | 1 |
| Gross_margin | 2,997 | 0.514 | 0.335 | 0.453 | 0.002 | 2.504 |
| Nidummy | 2,997 | 0.201 | 0.400 | 0 | 0 | 1 |
| Panel B: IPO delisted for negative reasons | ||||||
| AbnCFO | 748 | −0.042 | 0.109 | −0.042 | −0.440 | 0.495 |
| AbnPROD | 748 | 0.112 | 0.188 | 0.119 | −0.595 | 0.888 |
| AbnDISX | 748 | 0.180 | 0.260 | 0.145 | −0.68 | 1.491 |
| Rm_PROXY | 748 | 0.109 | 0.178 | 0.078 | −0.738 | 1.169 |
| Poison Pill | 748 | 0.398 | 0.490 | 0 | 0 | 1 |
| Accruals | 748 | −0.080 | 0.119 | −0.064 | −1.998 | 0.325 |
| Abs_DA | 748 | 0.068 | 0.102 | 0.042 | 0 | 1.827 |
| Offer_price | 748 | 27.683 | 22.298 | 20 | 0.833 | 178.5 |
| Firstday_ret | 748 | 20.247 | 11.404 | 16.15 | −0.063 | 68 |
| BTM | 748 | 0.560 | 0.406 | 0.459 | 0.054 | 2.392 |
| Leverage | 748 | 0.547 | 0.392 | 0.429 | 0.104 | 2.153 |
| Log_age | 748 | 2.626 | 1.015 | 2.397 | 0 | 7.643 |
| ROA | 748 | 0.013 | 0.146 | 0.042 | −0.767 | 0.211 |
| VC_Dummy | 748 | 0.517 | 0.500 | 1 | 0 | 1 |
| big4 | 748 | 0.650 | 0.477 | 1 | 0 | 1 |
| Gross_margin | 748 | 0.508 | 0.333 | 0.462 | 0.002 | 2.420 |
| Nidummy | 748 | 0.258 | 0.438 | 0 | 0 | 1 |
| Panel C: IPO survivors | ||||||
| AbnCFO | 2,249 | −0.058 | 0.088 | −0.054 | −0.485 | 0.377 |
| AbnPROD | 2,249 | 0.089 | 0.194 | 0.082 | −0.983 | 1.239 |
| AbnDISX | 2,249 | 0.111 | 0.245 | 0.075 | −1.086 | 1.75 |
| Rm_PROXY | 2,249 | 0.080 | 0.158 | 0.053 | −0.772 | 1.107 |
| Poison Pill | 2,249 | 0.276 | 0.447 | 0 | 0 | 1 |
| Accruals | 2,249 | −0.073 | 0.094 | −0.062 | −0.975 | 0.399 |
| Abs_DA | 2,249 | 0.059 | 0.070 | 0.039 | 0 | 0.984 |
| Offer_price | 2,249 | 30.118 | 27.852 | 22 | 0.100 | 265 |
| Firstday_ret | 2,249 | 19.438 | 12.107 | 16.2 | 0.750 | 68 |
| BTM | 2,249 | 0.495 | 0.354 | 0.411 | 0.054 | 2.392 |
| Leverage | 2,249 | 0.540 | 0.459 | 0.390 | 0.104 | 2.453 |
| Log_age | 2,249 | 2.607 | 0.976 | 2.564 | 0 | 4.977 |
| ROA | 2,249 | 0.047 | 0.102 | 0.059 | −0.432 | 0.282 |
| VC_Dummy | 2,249 | 0.452 | 0.498 | 0 | 0 | 1 |
| big4 | 2,249 | 0.66 | 0.475 | 1 | 0 | 1 |
| Gross_margin | 2,249 | 0.517 | 0.339 | 0.451 | 0.002 | 2.504 |
| Nidummy | 2,249 | 0.181 | 0.385 | 0 | 0 | 1 |
Note(s): This table presents descriptive statistics for the pooled IPO sample, IPOs delisted for negative reasons and survivor IPO firms. All variables are defined in Appendix
Source(s): Table by authors
The mean governance score (poison Pill) for continuing and failed firms is 0.398 and 0.276, respectively. Thus, it appears that failed firms have a higher level of entrenchment than survivor firms, which might lead to further deterioration in future performance, a decline in stock price and a significant negative abnormal return (Schepkeret al., 2018; Sikes, Tian, & Wilson, 2014; Yeh, 2014). Regarding control variables, the means of ROA for continuing and failed firms are 0.047 and 0.013, respectively. This result suggests that continuing firms are more efficient in generating profits than failed firms. By constructing the samples, the firm's first-day underpricing, leverage, Big 4 and net losses (Nidummy) for failed firms are predictably higher than those for continuing firms. However, continuing firms' gross margin is higher as they have greater production efficiencies and higher pricing power than failed samples.
Table 3 reports descriptive statistics of differences between failed firms and survivors in real and accrual earnings management during the IPO year. We employ the t-test and Wilcoxon test to test the significance of the accrual and real earnings management proxies. Medians are used because extreme observations are less likely to influence them. Table 3 shows that failed firms have higher real activities-based and accrual-based manipulations during the IPO year than survivor IPO firms. The differences in the mean and median aggregate measure of real earnings management are statistically significant at the 1% level. In summary, Table 3 presents preliminary evidence that IPO firms delisted for negative reasons exhibit higher real and accrual earnings management during the IPO year than survivor IPO firms.
Univariate tests
| Abs_DA | AbnCFO | AbnPROD | AbnDISX | Rm_PROXY | |
|---|---|---|---|---|---|
| Panel A: Means | |||||
| 1. Non-failures | 0.058 | −0.057 | 0.088 | 0.111 | 0.080 |
| 2. Failures | 0.068 | −0.041 | 0.111 | 0.179 | 0.108 |
| Difference (1) – (2) | −0.01 | −0.016 | 0.023 | −0.068 | −0.028 |
| t-stat | −2.836*** | −4.206*** | −2.877*** | −6.527*** | −4.152*** |
| Panel B: Medians | |||||
| 1. Non-failures | 0.039 | −0.042 | 0.082 | 0.075 | 0.053 |
| 2. Failures | 0.042 | −0.054 | 0.119 | 0.145 | 0.078 |
| Difference (1) – (2) | |||||
| Z-stat | −2.032*** | −3.809*** | −4.281*** | −7.040*** | −3.709*** |
Note(s): Panel A presents the mean, and Panel B presents the median comparison tests for individual and aggregate measures of real earnings management across subsamples of failure (above median) and survivor (below median) firms. All variables are defined in Appendix
* Statistical significance at the 10% level
** Statistical significance at the 5% level
*** Statistical significance at the 1% level
Source(s): Table by authors
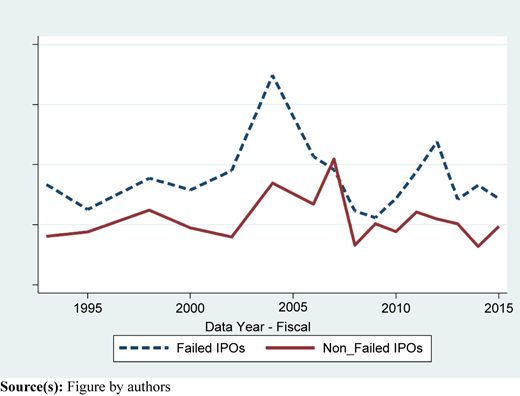
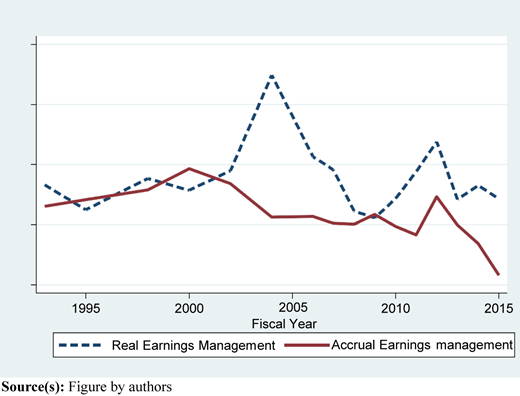
These univariate descriptive results are reinforced by Figures 1 and 2, plotting the time series of both real accrual earnings management for failed and survived IPOs. Figure 1 shows that even though real earnings management went down after SOX, IPO-failed firms exhibit, on average, a higher level of real earnings management activities. Figure 2 compares the time series distribution of real and accrual earnings management among IPO-failed firms. The two plots show that managers of failed IPOs undertake real (versus accrual) earnings management to manipulate reported earnings, and most earnings management in IPO-failed firms is achieved via real actions as opposed to accounting manipulations. This descriptive evidence confirms the Graham, Harvey, and Rajgopal (2005) survey showing that executives engage more in real earnings management.
To test the severity of multicollinearity in the data, a correlation matrix and the variance inflation factor (VIF) method were employed. Table 4 presents the Pearson product–moment correlation coefficients among the various variables used to compute accounting earnings management, real earnings management and shareholder governance measured by poison pill, control variables and IPO failure. IPO failure is positively and significantly correlated with the four individual estimates of real earnings management. Furthermore, discretionary accruals (Abs_DA) are positively related to IPO failure and significant at the level of 1%. This supports the previous finding that IPO firms manage accrual earnings during the IPO year (Teoh, Welch, and Wong, 1998b). We find a positive and significant relationship by examining the correlations between accrual-type earnings management, real earnings management proxies and IPO failure. We interpret this result as evidence that IPO firms engage in accounting earnings management, sales manipulations and overproduction by reducing the cost of goods sold and reducing their discretionary expenses. Finally, we report a positive correlation coefficient between abnormal cash flow from the operation, abnormal production, abnormal discretionary expenses and poison pill. We interpret these results as evidence that distressed firms have higher entrenchment levels that open the door to manipulating real activities and increase operational risk.
Pearson correlations
| Variables | (1) | (2) | (3) | (4) | (5) | (6) | (7) | (8) | (9) | (10) | (11) | (12) | (13) | (14) | (15) | (16) | (17) |
|---|---|---|---|---|---|---|---|---|---|---|---|---|---|---|---|---|---|
| (1) Failure | 1.000 | ||||||||||||||||
| (2) AbnCFO | 0.077 | 1.000 | |||||||||||||||
| (3) AbnPROD | 0.053 | −0.477 | 1.000 | ||||||||||||||
| (4) AbnDISX | 0.118 | −0.099 | 0.719 | 1.000 | |||||||||||||
| (5) Rm_PROXY | 0.033 | 0.899 | −0.803 | −0.351 | 1.000 | ||||||||||||
| (6) Poison Pill | 0.115 | 0.009 | 0.034 | 0.043 | −0.009 | 1.000 | |||||||||||
| (7) Abs_DA | 0.052 | −0.030 | 0.043 | 0.175 | −0.018 | 0.055 | 1.000 | ||||||||||
| (8) Offer Price | −0.040 | −0.025 | 0.035 | 0.001 | −0.037 | −0.015 | −0.013 | 1.000 | |||||||||
| (9) Firstday_ret | 0.020 | −0.032 | 0.077 | 0.090 | −0.053 | −0.023 | 0.004 | 0.242* | 1.000 | ||||||||
| (10) BTM | 0.077 | 0.334 | −0.268 | −0.145 | 0.350 | 0.048 | 0.093 | −0.042 | −0.052 | 1.000 | |||||||
| (11) Leverage | 0.007 | 0.001 | 0.009 | −0.027 | −0.009 | 0.035 | 0.061 | 0.014 | −0.030 | 0.024 | 1.000 | ||||||
| (12) Logage | 0.008 | 0.146 | −0.144 | −0.191 | 0.150 | −0.024 | −0.109 | −0.056 | −0.079 | 0.028 | −0.132 | 1.000 | |||||
| (13) ROA | −0.099 | −0.373 | 0.149 | −0.071 | −0.335 | −0.052 | −0.481 | 0.021 | −0.040 | −0.322 | −0.203 | 0.085 | 1.000 | ||||
| (14) VC_Dummy | 0.057 | −0.067 | 0.199 | 0.239 | −0.128 | 0.092 | 0.105 | 0.130 | 0.103 | −0.060 | 0.068 | −0.410 | −0.097 | 1.000 | |||
| (15) Big4 | −0.005 | 0.041 | −0.014 | 0.027 | 0.038 | −0.037 | −0.020 | −0.009 | −0.040 | 0.000 | 0.034 | 0.037 | −0.006 | 0.036 | 1.000 | ||
| (16) Gross_Margin | −0.096 | −0.131 | 0.096 | 0.020 | −0.138 | −0.069 | −0.046 | 0.253 | 0.115 | −0.153 | −0.138 | −0.003 | 0.097 | 0.040 | 0.087 | 1.000 | |
| (17) Nidummy | 0.083 | 0.334 | −0.095 | 0.099 | 0.281 | 0.063 | 0.320 | −0.001 | 0.010 | 0.378 | 0.174 | −0.078 | −0.521 | 0.083 | −0.004 | −0.098 | 1.000 |
Note(s): The table presents the matrix of Pearson correlations. The sample period encompasses 1993 to the 2015-time horizon. All variables are defined in Appendix. Italics font highlights significant effects at p < 0.001
Source(s): Table by authors
In Table 5, we report the results of a multicollinearity test. Brooks (2019) indicates severe multicollinearity if the correlation between 2 variables exceeds 0.80 and the VIF index exceeds 5. Our results indicate that the VIF for each explanatory variable was under 5, with a total mean of 1.6. Supported by the correlation matrix, multicollinearity was not a problem for the model.
Variation inflation factor (VIF)
| Variable | VIF | 1/VIF |
|---|---|---|
| Logage | 5.48 | 0.182635 |
| Gross_Margin | 3.83 | 0.261339 |
| BTM | 3.30 | 0.303105 |
| Big4 | 2.80 | 0.356598 |
| ROA | 2.48 | 0.402459 |
| Offer_price | 2.48 | 0.403600 |
| Leverage | 2.45 | 0.408901 |
| Nidummy | 2.38 | 0.420171 |
| Firstday_ret | 2.36 | 0.423355 |
| VC_Dummy | 2.18 | 0.458764 |
| Abs_DA | 1.89 | 0.529769 |
| Poison pill | 1.46 | 0.684285 |
| Rm_PROXY | 1.33 | 0.754113 |
| Overhang | 1.04 | 0.957858 |
| Mean VIF | 2.53 | |
Note(s): According to Brooks (2019), a VIF index over 5 indicates severe multicollinearity. Appendix outlines definitions and data sources for the variables
Source(s): Table by authors
Table 6 reports the result of the relationship between IPO failure and real earnings management. Models 1, 2 and 3 report the results using individual estimates for real earnings management activities. However, model 4 reports the results for the aggregate measure of real earnings management. We find a positive association between the different measures of real earnings management (abnormal cash flows from operations [sales manipulation], abnormal production and abnormal discretionary expenses) and IPO failure. This result suggests that IPO firms reduce discretionary expenditures to improve reported margins and overproduction or increase production to report lower COGS and manage their sales. In model 4, we test the association between the aggregate measure of real earnings management and IPO failure. We find a positive association between the aggregate measure of real earnings management and IPO failure. Economically, the estimated coefficient in model 1 of Table 6 implies that a one-standard-deviation increase in real earnings management leads firms' failures to increase, on average, by 8.55%. However, there is no significant relationship between accrual earning management and IPO failure. This result confirms Zang's (2012) findings that managers switch between accrual and real earnings management based on the relative costs of each manipulation strategy. Concerning control variables, the firm's first-day underpricing (Firstday_ret) is positively associated with a higher likelihood of failure for IPOs in models 2 to 4 but is not informative. This finding is consistent with the fact that first-day initial returns capture the uncertainty in the valuation of the IPO. Leverage is positively related to the probability of failure, consistent with the results from prior literature. This indicates that leveraged firms are more likely to fail as greater debt means more interest to be paid in the future (Black & Scholes, 1973).
Real earnings management and IPO failure
| Model 1 | Model 2 | Model 3 | Model 4 | |
|---|---|---|---|---|
| AbnCFO | 0.141*** | |||
| (2.418) | ||||
| AbnProd | 0.873*** | |||
| (−2.779) | ||||
| AbnDISX | 0.115*** | |||
| (5.094) | ||||
| Rm_PROXY | 0.130*** | |||
| (4.043) | ||||
| abs_DA | −0.614 | −0.561 | −0.725 | −0.928 |
| (−0.754) | (−0.787) | (−1.076) | (−1.253) | |
| Offerprice | −0.005** | −0.003 | −0.003 | −0.003 |
| (−2.572) | (−1.450) | (−1.308) | (−1.453) | |
| Firstday_ret | −0.000 | 0.003 | 0.003 | 0.003 |
| (−0.115) | (1.141) | (1.155) | (1.180) | |
| BTM | 0.422*** | 0.319** | 0.377** | 0.323** |
| (2.903) | (2.132) | (2.538) | (2.178) | |
| Leverage | 0.040 | 0.334** | 0.281* | −0.261* |
| (0.317) | (2.320) | (1.941) | (−1.815) | |
| Logage | 0.107* | 0.019 | 0.034 | 0.042 |
| (1.871) | (0.289) | (0.502) | (0.631) | |
| ROA | −0.574 | −3.004*** | −2.588*** | −2.777*** |
| (−1.077) | (−5.148) | (−4.523) | (−4.836) | |
| Overhang | −0.000 | −0.000 | −0.000 | −0.000 |
| (−0.536) | (−0.896) | (−0.845) | (−0.853) | |
| VC_Dummy | 0.242** | 0.150 | 0.115 | 0.165 |
| (2.232) | (1.296) | (0.994) | (1.442) | |
| Big4 | −0.039 | −0.021 | −0.041 | −0.056 |
| (−0.380) | (−0.197) | (−0.385) | (−0.525) | |
| Gross_Margin | 0.352** | −0.398** | −0.399** | −0.232 |
| (2.164) | (−2.259) | (−2.278) | (−1.471) | |
| Nidummy | 0.014 | −0.139 | −0.166 | −0.130 |
| (0.092) | (−0.866) | (−1.038) | (−0.818) | |
| Constant | −1.217* | 2.592 | 2.627* | 2.396 |
| (−1.923) | (1.641) | (1.668) | (1.529) | |
| Firm and year fixed effects | Yes | Yes | Yes | Yes |
| Wald χ2 | 359.89 | 332.66 | 344.09 | 333.98 |
| Log pseudolikelihood | −1408.68 | −1470.55 | −1461.52 | −1466.38 |
| Observations | 2,997 | 2,997 | 2,997 | 2,997 |
| Pseudo R2 | 0.163 | 0.127 | 0.132 | 0.129 |
Note(s): This table reports results from regressing IPO real earnings management on IPO failure and controls over the period 1993–2015. Our dependent variable is a dummy variable equal to 1 if the firm failed within five years. Models 1 to 3 report the logistic regression results from regressing AbnCFO, AbnPROD and AbnDISX on IPO failure. Model 4 presents the results from regressing the aggregate measure of real earnings management. Appendix outlines definitions and data sources for the regression variables. Robust t-statistics adjusted for clustering by the firm are reported inside the parentheses
* Statistical significance at the 10% level
** Statistical significance at the 5% level
*** Statistical significance at the 1% level
Source(s): Table by authors
Regarding net losses (Nidummy), firms with high negative balances of retained earnings have a history of losses and may simply be an indicator of riskier firms (Demers & Joos, 2007). Consistent with Demers and Joos (2007), we find that firms with lower offer prices have a higher probability of failure. The coefficient of Logage is positive and non-significant, consistent with the intuition that established firms are more likely to take the risk and engage in earnings manipulation strategies. As expected, ROA, Big4 and gross margin are significantly negatively associated with failure. This indicates that failed firms are less likely to squeeze more profits out of each dollar they own in assets, are audited by a low-level auditor and exhibit lower pricing power in their product markets. Finally, these results suggest that managers heavily use sales manipulation, overproduction and cut discretionary expenditures as these activities are not easily detectible by underwriters and auditors, given that IPO firms are expected to be on an upward trajectory in performance.
Table 7 presents the regression results of the association between shareholder governance and IPO failure for the full sample using the poison pill as a proxy for shareholder governance. The results indicate that a stronger poison pill (managerial entrenchment) is associated with a high probability of IPO failure. This suggests that poison pills are considered poor corporate governance practices that can hurt a company's value and performance and are more likely to delist than others. The three individual measures of real earnings management and the aggregate measure are positively associated with IPO failure. We interpret these results as adopting poison pills has a value destruction impact as they encourage IPOs to engage more in real earnings management behavior. Thus, weak governance structures of failed firms open the door to manipulating real activities and increasing operational risk (Charitou et al., 2007).
Real earnings management, poison pill and IPO failure
| Model 1 | Model 2 | Model 3 | Model 4 | |
|---|---|---|---|---|
| AbnCFO | 0.098 | |||
| (1.534) | ||||
| AbnProd | 0.758** | |||
| (2.435) | ||||
| AbnDISX | 0.109*** | |||
| (4.818) | ||||
| Rm_PROXY | 0.129*** | |||
| (4.032) | ||||
| Abs_DA | 0.066 | −0.686 | −0.831 | −1.067 |
| (0.088) | (−0.890) | (−1.149) | (−1.337) | |
| Poison Pill | 0.526*** | 0.516*** | 0.507*** | 0.534*** |
| (5.019) | (4.874) | (4.816) | (5.070) | |
| Offerprice | −0.003 | −0.003 | −0.003 | −0.003 |
| (−1.579) | (−1.364) | (−1.204) | (−1.320) | |
| Firstday_ret | 0.003 | 0.003 | 0.003 | 0.003 |
| (0.937) | (0.854) | (0.878) | (0.879) | |
| BTM | 0.347** | 0.289* | 0.349** | 0.299** |
| (2.369) | (1.916) | (2.326) | (1.998) | |
| Leverage | −0.220 | 0.325** | −0.277 | −0.257* |
| (−1.554) | (2.256) | (−1.906) | (−1.786) | |
| Logage | −0.001 | 0.005 | 0.018 | 0.027 |
| (−0.018) | (0.075) | (0.262) | (0.392) | |
| ROA | −0.753 | −3.063*** | −2.674*** | −2.870*** |
| (−1.368) | (−5.099) | (−4.543) | (−4.839) | |
| Overhang | −0.000 | −0.000 | −0.000 | −0.000 |
| (−0.814) | (−0.775) | (−0.729) | (−0.727) | |
| VC_Dummy | 0.154 | 0.100 | 0.066 | 0.108 |
| (1.350) | (0.862) | (0.570) | (0.933) | |
| Big4 | −0.036 | −0.015 | −0.033 | −0.048 |
| (−0.342) | (−0.139) | (−0.311) | (−0.452) | |
| Gross_margin | −0.189 | −0.349** | −0.369** | −0.205 |
| (−1.189) | (−1.992) | (−2.097) | (−1.301) | |
| Nidummy | 0.089 | −0.157 | −0.182 | −0.150 |
| (0.592) | (−0.974) | (−1.132) | (−0.939) | |
| Constant | 1.887 | 2.263 | 2.597 | 2.076 |
| (1.241) | (1.425) | (1.637) | (1.313) | |
| Firm and year fixed effects | Yes | Yes | Yes | Yes |
| Wald χ2 | 332.49 | 357.42 | 365.60 | 354.89 |
| Log pseudolikelihood | −1467.31 | −1458.30 | −1449.76 | −1453.26 |
| Observations | 2,997 | 2,997 | 2,997 | 2,997 |
| Pseudo R2 | 0.129 | 0.134 | 0.139 | 0.137 |
Note(s): This table reports results from regressing IPO real earnings management on IPO failure while controlling for poison pill from 1993 to 2015. Our dependent variable is a dummy variable equal to 1 if the firm failed within five years. Models 1 to 3 report the logistic regression results of from regressing AbnCFO, AbnPROD and AbnDISX on IPO failure controlling for poison pill. Model 4 presents the results from regressing the aggregate measure of real earnings management. Appendix outlines definitions and data sources for the regression variables. Robust t-statistics adjusted for clustering by firm are reported inside the parentheses
* Statistical significance at the 10% level
** Statistical significance at the 5% level
*** Statistical significance at the 1% level
Source(s): Table by authors
Additional analyses and sensitivity checks
In this section, we run a bunch of sensitivity tests to document whether or not our main results reported in Table 6 are solid to an alternative measure of IPO failure, model specification and other cross-sectional analyses. Table 8 reports the results of the additional analysis. First, in model 1, we look at the interaction of real earnings management, accrual earnings management and the poison pill on the likelihood of IPO failure. The results indicate that the interaction term is positively associated with IPO failure. The coefficient of both real and accrual earnings management remains economically significant. This result suggests that weak shareholder governance exacerbates real earnings management and yields IPO failure.
Additional analyses
| Model 1 | Model 2 | Model 3 | ||
|---|---|---|---|---|
| Coefficient | Hazard ratios | Altman measure | ||
| Rm_PROXY | 0.098*** | 0.611*** | 1.842 | 2.153*** |
| (4.682) | (2.462) | (3.579) | ||
| Poison Pill | 0.441*** | 0.375*** | 0.960 | 0.025 |
| (4.026) | (4.274) | (0.164) | ||
| Abs_DA | −0.024 | −0.041 | 1.454 | −1.566** |
| (−0.237) | (−0.476) | (−1.973) | ||
| Rm_proxy* Poison Pill*Abs_da | 1.320** | 1.047** | 2.848 | |
| (1.786) | (1.830) | |||
| Offerprice | −0.003 | −0.004** | 0.996 | −0.003 |
| (−1.243) | (−2.135) | (−1.186) | ||
| Firstday_ret | 0.003 | 0.008*** | 1.008 | 0.007* |
| (1.063) | (3.717) | (1.681) | ||
| BTM | 0.451*** | 0.280** | 1.323 | 0.532** |
| (3.117) | (2.390) | (2.341) | ||
| Leverage | −0.137 | −0.182 | 0.833 | 2.380*** |
| (−1.089) | (−1.576) | (13.201) | ||
| Logage | 0.014 | −0.028 | 0.972 | −0.258*** |
| (0.202) | (−0.527) | (−2.587) | ||
| ROA | −0.683* | −1.751*** | 0.173 | −7.192*** |
| (−1.647) | (−4.500) | (−6.655) | ||
| Overhang | −0.000 | −0.000*** | 1 | 0.000 |
| (−0.658) | (−5.077) | (0.368) | ||
| VC_Dummy | 0.087 | 0.231** | 1.259 | −0.248 |
| (0.749) | (2.416) | (−1.507) | ||
| Big4 | −0.039 | 0.090 | 1.094 | 0.111 |
| (−0.374) | (1.020) | (0.681) | ||
| Gross_Margin | −0.368** | −0.455*** | 0.634 | 0.116 |
| (−2.088) | (−3.029) | (0.385) | ||
| Nidummy | 0.021 | −0.024 | 0.976 | 0.946*** |
| (0.141) | (−0.192) | (4.650) | ||
| Constant | 2.251 | – | −1.945 | |
| (1.401) | (−1.208) | |||
| Firm and year fixed effects | Yes | Yes | Yes | |
| Wald χ2 | 355.80 | 729.7 | 556.73 | |
| Log pseudolikelihood | −1453.73 | −5044.74 | −738.81 | |
| Observations | 2,997 | 2,994 | 2,883 | |
| Pseudo R2 | 0.136 | – | 0.392 | |
Note(s): In this table, model 1, we report the moderating effect of shareholder governance on IPO failure. The interaction term is the product of Rm_proxy, Abs_DA and poison pill. We also illustrate in Model 2 the estimation of the Cox proportional hazards model of the probability of failure. Finally, in Model 3, we report the result of our logistic regression using the Altman Z-Score as a proxy for IPO failure. Appendix outlines definitions and data sources for the regression variables. Robust t-statistics adjusted for clustering by the firm are reported inside the parentheses
* Statistical significance at the 10% level
** Statistical significance at the 5% level
*** Statistical significance at the 1% level
Source(s): Table by authors
Second, to assess our prediction of whether the likelihood of IPO failure firms is a function of real earnings management measures, shareholder governance measures and accounting data, we employ a nonparametric approach, namely the Cox (1972) proportional hazard model. The hazard function uses an exponential distribution that follows a firm over a specific period and identifies when a firm experiences an event of delisting. In our context, our dependent variable in the hazard model is the “number of years after IPO until delisting” and is right censored for firms that delist for reasons other than failure (Demers & Joos, 2007; Jain & Kini, 2000). Our explanatory variables remain the same with the forecast horizon. We estimate the following model:
Our findings suggest that all of the significant coefficients in the logit model reported in Table 8, model 2, remain significant in the hazard model estimation. In other words, the coefficient for real earnings management proxy and poison pill is positive and significant at the 1% level. This finding supports our previous results that failed firms are more likely to manipulate earnings through real earnings activities than continuous firms. Furthermore, poison pills are considered as a poor corporate governance practice that can hurt a company's value and performance. They can be seen as impediments to the ability of shareholders and outsiders to monitor management and are more about protecting the board and management than attracting more generous offers from potential buyers.
Finally, in model 3, we run our baseline regression using a different measure of IPO failure. The evaluation of failure has taken particular importance in accounting research. Altman (1968) was the first one who uses the following five ratios to predict distressed firms: working capital to the total asset (liquidity indicator), retained earnings to the total asset (an indicator of the firm's age), earnings before interest and taxes to total assets (productivity of the firm's assets), the market value of equity to book value of total debt and sales to total assets. We construct a dichotomous variable that takes 1 if Z-score is below 1.8, while companies with scores above 3 are not likely to go bankrupt. The positive and significant relationship between IPO failure and poison pill adoption remains unchanged.
Investment opportunities
We run our main regression analysis by splitting our sample into high-growth and low-growth firms with investment opportunities. Skinner and Sloan (2002) show that growth companies experience a sharper decline in share price than value firms after missing consensus forecasts. Further, the extant literature on IPOs shows that IPO underpricing positively affects growth opportunities. They argue that IPO activities and prices in a given industry improve the informational environment and will likely signal growth opportunities (Chung, Li, & Yu, 2005). This evidence suggests that IPO firms and managers of growth companies experience higher real earnings management than others. Following previous research, a company has high investment opportunities if the ratio of R&D expenditures to lagged book value over the entire sample period is above the median; otherwise, we classify it as a firm with low-investment opportunities. This measure has an ultimate advantage, unaffected by either the market's mis-valuation of distressed firm's equity or the erosion of book value due to accumulated losses (Lyandres & Zhdanov, 2013). Table 9, models 1 and 2, report the logistic regression results for high- and low-growth firms. As expected, our results confirm that managers of growth companies exhibit significantly higher levels of real earnings management and weaker governance and are more likely to fail than those of low-growth firms.
Real earnings management, poison pill and IPO failure
| High-/low-growth firms | High-/low-tech firms | High/Low PMC | ||||
|---|---|---|---|---|---|---|
| Model 1 | Model 2 | Model 3 | Model 4 | Model 5 | Model 6 | |
| Rm_proxy | 1.626*** | 0.126** | 1.505*** | 0.928* | 1.625*** | 0.300 |
| (3.236) | (2.023) | (2.702) | (1.789) | (3.079) | (0.542) | |
| Abs_DA | −1.252 | 0.591 | −1.551 | 0.391 | 0.488 | −2.834*** |
| (−1.220) | (0.389) | (−1.319) | (0.279) | (0.600) | (−2.580) | |
| Poison Pill | 0.465*** | 0.498** | 0.450*** | 0.445** | 0.291* | 0.642*** |
| (2.947) | (2.487) | (2.817) | (2.375) | (1.854) | (3.853) | |
| Offerprice | −0.005* | −0.006 | −0.005* | −0.006 | −0.017*** | 0.000 |
| (−1.924) | (−1.295) | (−1.921) | (−1.571) | (−3.613) | (0.094) | |
| Firstday_ret | 0.005 | −0.010 | 0.008** | −0.036*** | 0.012** | −0.001 |
| (1.625) | (−0.680) | (2.080) | (−3.137) | (2.265) | (−0.183) | |
| BTM | 0.333 | 0.348 | 0.541* | 0.309 | 0.576*** | 0.093 |
| (1.195) | (1.515) | (1.800) | (1.460) | (2.636) | (0.327) | |
| Leverage | 0.277 | −1.102*** | 0.238 | −1.099*** | −0.610** | 0.020 |
| (1.287) | (−3.869) | (1.043) | (-4.097) | (−2.419) | (0.088) | |
| Logage | 0.078 | −0.097 | 0.149 | −0.051 | 0.447*** | −0.233** |
| (0.665) | (−0.892) | (1.096) | (−0.512) | (4.202) | (−2.101) | |
| ROA | −2.225*** | −0.682 | −1.868** | −2.218* | −2.536** | −3.712*** |
| (−2.782) | (−0.506) | (−2.249) | (−1.753) | (−2.474) | (−4.141) | |
| Overhang | −0.000* | −0.000** | −0.000* | −0.000** | −0.000*** | −0.000* |
| (−1.730) | (−2.295) | (−1.802) | (−2.467) | (−3.120) | (−1.883) | |
| VC_Dummy | 0.275 | −0.125 | 0.342* | −0.285 | 0.054 | 0.412** |
| (1.503) | (−0.581) | (1.789) | (−1.413) | (0.260) | (2.448) | |
| Big4 | 0.129 | 0.001 | 0.044 | −0.096 | 0.003 | −0.138 |
| (0.824) | (0.004) | (0.277) | (−0.482) | (0.016) | (−0.884) | |
| Gross_margin | −0.938*** | 0.674* | −0.844** | 0.135 | −0.498** | −0.772** |
| (−2.866) | (1.751) | (−2.491) | (0.380) | (−2.220) | (−2.132) | |
| Nidummy | −0.184 | 0.067 | −0.035 | −0.127 | 0.041 | −0.236 |
| (−0.859) | (0.228) | (−0.157) | (−0.460) | (0.154) | (−1.018) | |
| Constant | 4.051** | 0.403 | −4.031*** | 0.791 | −4.559*** | −0.839 |
| (2.073) | (0.156) | (−4.200) | (0.426) | (−3.849) | (−0.894) | |
| Firm and year fixed effects | Yes | Yes | Yes | Yes | Yes | Yes |
| Wald χ2 | 236.51 | 293.04 | 173.35 | 338.29 | 278.56 | 175.76 |
| Log pseudolikelihood | −687.15 | −568.73 | −621.70 | −641.35 | −630.97 | −669.94 |
| Observations | 1,390 | 1,464 | 1,230 | 1,643 | 1,457 | 1,404 |
| Pseudo R2 | 0.174 | 0.238 | 0.156 | 0.247 | 0.240 | 0.165 |
Note(s): The table reports the results of logistic regression for high- and low-growth firms (models 1 and 2), high- and low-tech firms (Models 3and 4) and high and low product market competition (models 5 and 6) for the whole sample over the period 1993-2015. H.G. is a dummy variable equal to 1 if the average market-to-book ratio over the entire sample period is above the sample median; otherwise, 0. High tech/low tech is a dummy variable that takes 1 if the ratio of R&D to sales is greater than 0.05. Product market competition is measured as (−1) times Herfindahl–Hirschman Index (Hj) computed as the sum of squared market shares of all firms on Compustat in an industry based on a three-digit SIC code. Market share is calculated based on the ratio of the firm i's sales to the industry j's total sales. High PMC (product market competition) is a dummy variable equal to 1 if the Herfindahl–Hirschman Index is above the median; otherwise, 0. Appendix outlines definitions and data sources for the regression variables. Robust t-statistics adjusted for clustering by the firm are reported inside the parentheses
* Statistical significance at the 10% level
** Statistical significance at the 5% level
*** Statistical significance at the 1% level
Source(s): Table by authors
High-/low-technology firms
Demers and Joos (2007) argue that a significantly different structural IPO failure model applies to non-technology versus R&D-oriented IPO firms. High-tech firms tend to have complex financial reporting given the diversity and innovativeness of the firm's technology portfolio and the professional judgment in recognizing, measuring and disclosing business transactions in high-tech firms. We run our regression models by splitting our sample into two categories: high-tech and low-tech IPO firms. A firm is considered a high-tech company if the ratio of R&D to total assets is greater than 0.05. Table 9 reports the logistic regression results of the association between real earnings management and IPO failure for high- and low-tech firms. In both sample predictions, we find that the likelihood of IPO failure is positively associated with high real earnings management and weak governance (poison pill). However, the positive relationship with high-tech firms is more significant and pronounced. This result indicates that besides accounting information, shareholder governance is important in assessing failure risk of high-tech firms.
Product market competition
Our last subsample analysis examines whether firms operating in highly competitive markets are more likely to fail. Markarian and Santalo (2014) argue that manipulating earnings is particularly rewarding in competitive markets. They find that managers manage earnings using accrual and real activities in more competitive markets because competition increases the executive incentive to manipulate earnings (Tinaikar & Xue, 2009; Karuna, Subramanyam, & Tian, 2015). We use the Herfindahl–Hirschman industrial concentration index to proxy for market competition. Accordingly, we construct an indicator variable for whether a company operates in competitive markets. As expected, we find that IPO firms operating in the high market competition are more likely to engage in real earnings management and exhibit weak shareholder governance. Therefore, greater pressure from the product market competition may lead firms to engage in more earnings manipulations to depict an overall positive image of their financial performance.
Summary and conclusions
This study examines the association between shareholder governance, real earnings management and IPO failure. Previously, Cohen and Zarowin (2010) and Kothari, Mizik, and Roychowdhury (2016) found that real earnings management activities have severe negative consequences for subsequent operating and returns performance, which are even greater than the impact of accrual manipulation. However, these studies did not investigate whether real or accrual earnings management is associated with IPO failure or whether and how shareholder governance matters when it comes to IPO failure. Using logistic regressions, we document that real earnings management is positively associated with IPO failure. We also find that weak shareholder governance proxied by the poison pill increases the likelihood of IPO failure, suggesting that poor governance structures in failed firms open the door for manipulating real activities and increasing operational risk. Finally, when we interact shareholder governance with both accrual and real earnings managements, the association between real, accrual earnings management and poison pill and IPO failure is positive and statistically significant. Our results suggest that shareholder governance indirectly impacts IPO failure by increasing the prevalence of both real and accrual earnings management.
The authors would like to thank C S Agnes Cheng, Thomas Chemmanur, Elizabeth Demers, Linda Myers, James Ohlson, Grace Pownall, Barat Sarath, Katherine Schipper, Michael Weisbach and the seminar participants at HEC Montréal, Saint Mary’s University and Hong Kong Polytechnic University for their helpful comments and suggestions. The financial support of the Social Sciences and Humanities Research Council of Canada is gratefully acknowledged.
Data availability: Data are publicly available from the sources identified in the study.
