


This study identifies common and unique factors shaping social impact measurement (SIM) practices among founders and managers of social enterprises (SEs) across different cultural contexts.
The research used the Q method to capture SIM practices among SEs in Hungary and Vietnam. Participants sorted 45 statements derived from the literature, and by-person factor analysis was used to detect distinct configurations of practice.
Four distinct factors emerged in the Hungarian SEs sample, three in the Vietnamese SEs sample and four in the combined dataset, revealing both consensus and disagreement. While most SEs valued stakeholder engagement and rejected standardized, one-size-fits-all approaches, they differed in how they addressed the sector's perceived inefficiency, resource constraints, long-term versus short-term impact and external pressure.
The results provide direction for SE practitioners, funders and policymakers to co-design and enhance context-sensitive and participatory impact measurement frameworks that support the social mission of SEs.
The study contributes to the expanding literature on SIM in hybrid organizations by employing the Q method in a cross-national SE context, complementing practice-oriented studies by providing a deeper understanding of the factors that drive variation in SIM practices. Future studies can build on this article by applying the Q methodology to other regional SE ecosystems, comparing viewpoints in extensive international contexts and investigating how attitudes change over time in response to shifting funding, policy or societal conditions.
1. Introduction
Social enterprises (SEs) face a significant challenge in measuring their performance with regard to their social goals, mission and impact (Lall, 2019; Sparviero, 2019). This issue, which refers to the “mission measurement paradox,” arises from a disconnect between social mission, objectives and impact measurement. The fundamental objective of SEs is not the maximization of economic value for shareholders; instead, it is broader and more complex, focusing on the “social value” creation for the community. Therefore, economic and financial indicators alone are insufficient to evaluate SEs' performance (Costa & Andreaus, 2021; Harangozo, Ngo, & Ásványi, 2025). However, social achievements are complex and tailored to social goals, necessitating justification and acknowledgement, while financial and economic success is universally understood and easily communicated. This leads SEs to diverge from their initial purpose and to prioritize easily measurable outcomes over more meaningful but harder-to-quantify mission-driven goals, resulting in “mission drift,” a central risk for SEs when financial pressure begins to outweigh commitments to social purpose (Battilana & Lee, 2014; Ramus & Vaccaro, 2017; Sparviero, 2019; Weisbrod, n.d.).
On the other hand, SEs often face pressure to demonstrate measurable outcomes to funders, investors and stakeholders (Agrawal & Hockerts, 2019; Dufour, 2019; Liston-Heyes & Liu, 2021; Ormiston, 2019). SEs must balance the need for rigorous measurement with their broader mission, which may not always align with the short-term or quantifiable outcomes typically demanded by investors. This circumstance can lead to a misalignment between the goals of the enterprise and the expectations of external stakeholders (Nicholls, 2010).
Furthermore, the dilemma is intensified by the diversity of stakeholders involved in SEs, including beneficiaries, investors and communities. Each group may have different expectations for how impact should be measured, leading to conflicting priorities (Bacq & Eddleston, 2018). This makes it difficult to design an impact measurement framework that satisfies all stakeholders while remaining true to the mission.
Regarding the framework for SIM, previous studies have examined measurement tools design and process, including the SEs' practices in the food-waste sector in the Netherlands preferring output measurement to outcome metrics (Muftugil-Yalcin & Klas, 2025), the social balance sheet – a useful self-developed tool to measure social impacts (Guzmán, Correa, & Valiente, 2024), the social return on investment (SROI) dominance and limitations (Fuertes-Fuertes, Cabedo, & Jimeno-García, 2020; Green, 2019), the integration of social impact into financial metrics to avoid impact washing in social ventures (Bengo, Borrello, & Chiodo, 2021), the theoretical principles of evaluation thinking (Tsotsotso, 2021) and the classification of SIM approaches and tools (Pedrini & Zaccone, 2020). While these studies focused on the design of measurement frameworks, the operational processes of applying SIM tools and the norms or criteria used to judge impact, less attention has been paid to the underlying factors shaping how SE founders and managers think about impact measurement – what they consider important, feasible or problematic. Understanding these underlying viewpoints is valuable because perceptions influence actual practices, decisions about what to measure and the willingness to engage with particular tools or frameworks (Luke, Barraket, & Eversole, 2013; Rawhouser, Cummings, & Newbert, 2019).
To investigate these underlying key factors, this study focused on revealing the areas of consensus and argument among diverse perspectives of SEs' founders and managers who have a good understanding of all the processes and key aspects of SIM, through a comparative analysis of two SE contexts – Hungary and Vietnam. We chose these two settings because they share similarities in growing SE ecosystems (Fekete, Hubai, Kiss, & Mihály, 2021; Nguyen, Carr, Hodgetts, & Fauchart, 2021) and also differ markedly in their institutional, historical and resource environments. According to Hofstede's cultural dimensions (Hofstede, 2001; Minkov & Hofstede, 2012), Hungary scores relatively high on individualism, similar to many European countries, while Vietnam is characterized by strong collectivism and community orientation, common within Asia. In more individualistic and market-oriented contexts, measurement may be viewed as a technical or managerial tool, whereas in more collectivist and relational contexts, it may be interpreted as a social obligation, a community practice or even a potential burden. Comparing these two settings, therefore, also offers an opportunity to reveal whether different cultural values may influence SEs' attitudes toward SIM.
Accordingly, this research addresses the following questions:
What key factors shape how SE founders and managers practice SIM?
To what extent do these factors converge or differ among Hungarian and Vietnamese SEs?
The structure of the rest of the paper includes Section 2, a literature review on the concept of SEs, their social impact and its measurement; Section 3 describes the Q methodology we adopted and the research design; Section 4 presents key results from the component analysis and comparative analysis on both national and cross-national samples; Section 5 discusses possible reasons behind the consensus and differences among samples and implications and Section 6 covers the conclusion of key findings, contributions, limitations and directions for future research.
2. Literature review
2.1 The concept of social enterprises
SE refers to a type of business model that aims to tackle social or environmental issues while also generating sustainable revenue (Canestrino, Ćwiklicki, Di Nauta, & Magliocca, 2019). Beyond the organization's corporate social responsibility, SEs add value to society by fostering and advancing social inclusion and sustainability (Krátki & Szabó, 2018).
Various definitions of SEs have been proposed in research and practice, reflecting the diverse nature of these organizations. In this research, we followed the general conceptualization of the European Commission (2011), illustrating the main features of SEs. Firstly, the primary objective of an SE is to create positive social change rather than solely focusing on maximizing profits for shareholders (Dupain et al., 2022). Secondly, while they aim to generate income, SEs reinvest a significant portion of their profits back into their mission or the community they serve. This reinvestment may be directed towards expanding their impact, improving the quality of their products or services or supporting the social causes they work towards.
For the sake of future impact-based investment, it is essential to evaluate and compare the social value created by each program or activity of SEs through a consistent approach to impact measurement.
2.2 Social impact of SEs
Understanding of social impact enables social entrepreneurs, SEs, policymakers and support organizations to conceptualize the complex social problems that they aim to address, perhaps guiding them toward the creation of more responsive and impactful solutions (Lorenzo-Afable, Lips-Wiersma, & Singh, 2020).
The term “social impact” overlaps with terms such as “social value creation” and “social return” and may also be associated with “social accounting” (Dufour, 2019; Parkinson & Naidu, 2024). It is also closely related to “social performance” or “social value” (Salavou & Cohen, 2021; Quilloy, Newman, & Pyman, 2024).
Social impact can be identified as the outcomes of activities undertaken by SEs; however, its ambiguous definition has resulted in a lack of agreement regarding the most appropriate methods for measuring it (Perrini, Costanzo, & Karatas-Ozkan, 2021). Social impact refers to the non-economic value produced by a specific activity (Emerson, Wachowicz, & Chun, 2000) or the value received by the beneficiaries and other recipients of the intervention (Kolodinsky, Stewart, & Bullard, 2006) or as the segment of the final outcome attributable to an organization's action, excluding the changes that would have occurred independently of the organization's involvement (Clark, Long, Rosenzweig, & Olsen, 2004). It is argued that external factors may affect the impact created, and that should be eliminated from the evaluation process to assess just the value generated by the organization (Perrini et al., 2021).
On the other hand, social impact does not always mean a social gain, but a socially irrelevant impact, or has directly led to a negative effect (Parkinson & Naidu, 2024). The positive impact creates beneficial improvements, for instance, improving the likelihood for vulnerable people, promoting a sustainable lifestyle or increasing awareness of responsible consumption. Conversely, the negative effect illustrates adverse impacts such as pollution, labor structure disruption and competitive imbalances.
In the theory of value chain, SE's social value is conceptualized in terms of output, outcome and impact (Dufour, 2019; Salavou & Cohen, 2021). Output captures direct evaluations and benefits, including the number of beneficiaries, the volume of product/service offers and revenues derived from both operational and non-operational activities. Outcome reflects improvements in beneficiaries' lives, including satisfaction and social issue solutions, usually moderated by events beyond the control of the organization; therefore, it is more difficult to obtain. Impact denotes long-term, sustainable changes at the societal level.
2.3 Social impact measurement
In the literature, the term “impact measurement” is the most commonly used along with others like “social performance,” “impact reporting” and “social impact accounting” (Lall, 2019). Social impact assessment is related to social outcomes that SEs bring other than just quantifying economic returns; therefore, it is not and should not be treated merely as a financial and technological exercise. It should be mission-linked and always be consistently comprehended within the specific context in which the SEs are located (Leung et al., 2019).
SEs' impact assessment can be conducted for both internal and external purposes: (1) it assists SE in enhancing its performance and thus long-term sustainability; (2) it serves as convincing evidence to assure stakeholders including funders and the government that the allocated funds is utilized efficiently and effectively; (3) it establishes the SE's legitimacy in the eyes of the general public, thereby gaining support from consumers (Leung et al., 2019; Csutora, Harangozo, & Szigeti, 2022). However, compared to financial performance measurement, social impact measurement (SIM) remains considerably more complicated. This complexity is due to the lack of consensus on definitions, the challenges of multi-causal relationships and the difficulty of quantifying intangible outcomes, such as qualitative changes in individuals' lives or social inclusion (Lall, 2019; Leung et al., 2019; Perrini et al., 2021; Salavou & Cohen, 2021). Therefore, SEs often adopt hybrid approaches combining quantitative and qualitative indicators.
A wide range of tools and techniques have been proposed to address these challenges. Among the most commonly cited is the theory of change, a systematic framework that illustrates how specific inputs and resources, when applied through certain interventions, lead to desired change (Simeone et al., 2023). By mapping causal pathways, a theory of change facilitates evaluation of a project's impact, allowing stakeholders to identify successful elements and areas requiring improvement (Parkinson & Naidu, 2024). SROI, the net present value of benefits divided by the net present value of investments, can be employed retroactively or proactively (Green, 2019; Perrini et al., 2021). While useful for estimating value, SROI often relies on beneficiaries' self-reported counterfactuals, which can reduce accuracy. The socially extended balanced scorecard approach captures the multi-dimensional nature of SEs' performance-innovation, stakeholder engagement, learning and growth and financial outcomes (Krátki & Szabó, 2018; Mamabolo & Myres, 2020; Harangozo et al., 2025). Despite its balanced approach, the balanced scorecard may still place significant weight on financial performance, potentially diverting attention from social objectives. Additional methodological approaches, such as Input-output analysis (Tausl Prochazkova & Noskova, 2020), Social Cost-Benefit Analysis and standardized frameworks including the Global Reporting Initiative (Krátki & Szabó, 2018), B-Corp Certification (Chen & Kelly, 2015) or social footprint measurement (Harangozó, Széchy, & Zilahy, 2015) provide accountability and legitimacy, but have limited sensitivity to the dynamic nature of social outcomes (Krátki & Szabó, 2018; Lall, 2019). Taking these tools together, no single method can sufficiently capture the nature of social impact across diverse SE settings. Accordingly, the combination of quantitative and qualitative techniques, which provides a more comprehensive understanding of social impact, is increasingly advocated in both scholarly and practitioner discourse.
2.4 Factors shaping SEs' SIM practices
Understanding the available tools alone is insufficient to explain why SIM practices differ substantially across SEs. Recent research indicates that SEs' practices are influenced by several underlying factors. Firstly, resource and capacity constraints are considered one of the significant predictors of SIM practice. SEs lack time, specialized human resources, technical expertise and data systems, which limit their ability to implement complex impact measurements (Costa & Andreaus, 2021; Grieco, 2018; Leung et al., 2019). These constraints tend to hinder smaller or younger SEs from SIM or push them toward simplified or self-generated methods (Molecke & Pinkse, 2017). Secondly, leadership values and organizational culture strongly influence whether SIM is viewed primarily as a learning opportunity to boost staff's moral or a compliance requirement (Arvidson & Lyon, 2014; Polonsky, Landreth Grau, & McDonald, 2016; Grieco, 2018). Thirdly, relationships with funders play a central role; however, some research argued that SEs respond to funders' pressure in a sense of internal discomfort and resistance (Arvidson & Lyon, 2014; Molecke & Pinkse, 2017; Grieco, 2018). Some others respond adaptively rather than passively. Rather than entirely accepting externally imposed tools, many SEs engage in “bricolage”- selectively combining, modifying or symbolically using methods to satisfy multiple stakeholders while maintaining internal priorities (Ebrahim & Rangan, 2014; Molecke & Pinkse, 2017). These dynamics explain why SIM practices frequently diverge from the intentions of standard frameworks. Finally, the ecosystem differences influence what types of measurements are considered feasible. In more mature ecosystems with strong regulatory frameworks, SIM tends to be more formalized and metric-driven (Defourny & Nyssens, 2010; Polonsky et al., 2016). In emerging ecosystems, SEs often rely on flexible approaches.
Together, these factors demonstrate that SIM practices are shaped not only by conceptual tensions but also by organizational realities and institutional environments. This highlights the importance of examining how SE leaders themselves interpret SIM requirements, especially in cross-national contexts.
3. Methodology
3.1 Method
The diverse influences identified in the literature suggest that SIM practices are fundamentally shaped by founders' and managers' subjective interpretations. To examine the factors through which these interpretations are translated into SIM practices, this study used the Q method to empirically study distinct configurations of practice. Q method has substantial advantages for systematically analyzing shared patterns in how participants enact SIM (Zografos, 2007; Bhatt, Qureshi, & Riaz, 2019; Claassen, Bidet, Kim, & Choi, 2024; Rauma, Jansson, Cao, & Van Nieuwenhoven, 2024; Wallock, Narayan, & Thomson, 2024). By combining qualitative and quantitative analysis, it enables the identification of participants' priorities. As a by-person factor analysis, the method clusters individuals (rather than variables) based on how similarly they sorted the statements. Consequently, meaningful insights can be generated without requiring large samples (Watts & Stenner, 2005).
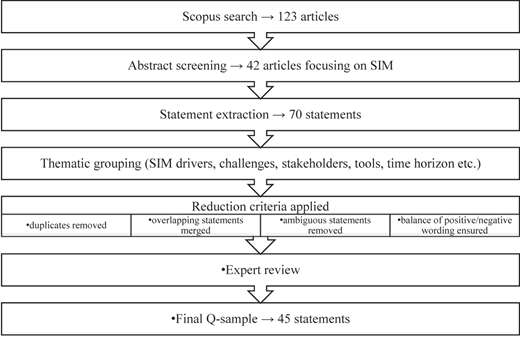
The first step was the development of a concourse to capture the diversity of SIM practices and the considerations that SEs might have when implementing SIM. The concourse, a foundational step of Q methodology, refers to a collection of potential statements covering the research topic (Watts & Stenner, 2005). In this study, the concourse was constructed using secondary sources, including peer-reviewed journal articles. A systematic search was conducted in the Scopus database with no time limit and filtered by title, abstract and keywords, using search terms such as “social enterprise,” “social entrepreneur,” “social entrepreneurship” and “social impact measurement” or “measuring social impact.” It resulted in 123 articles, of which each abstract was scanned to ensure the focus on impact measurement of SEs, resulting in a shortlist of 42. These articles were then examined carefully to extract all potentially relevant statements, generating 70 statements, along with five to six that were not immediately relevant but considered possibly useful for future exploration. Thematic patterns and interconnections among these statements also emerged during the process, helping organize them into common categories and facilitating the reduction of the total number of statements for the final Q-sample. The categories aligned with the key factors identified in the literature, including SIM implementation in general, motivations or drivers, challenges, stakeholder engagement, the relationship between funders and SEs, duration of impact, measurement indicators and measurement tools and techniques. The statements were subsequently assessed by the researchers and scrutinized to eliminate redundancy, ambiguity and bias risk that unintentionally prefers certain perspectives while excluding others. Finally, they were paraphrased, combined and rewritten into a final set of forty-five statements (included in Appendix), including both positively and negatively worded items to ensure balance and avoid bias. The final statement set was reviewed by SE research experts and translated into Hungarian and Vietnamese, depending on the language preference of participants. Figure 1 illustrates the statement selection and aggregation process, presenting the main stages.
3.2 SE sample
There are no specific rules for sample size in the Q method, and the number of participants may range from a small number to 60 (Watts & Stenner, 2005). In Q studies, the aim of sampling is not statistical representativeness but the inclusion of participants who possess relevant knowledge and are able to express informed interpretations of the topic under investigation. Our research involved twenty participants from eighteen SEs, ten from Hungary and ten from Vietnam, with two SEs represented by more than one participant. Participants were recruited using a combination of purposive and snowball sampling strategies (Sadler, Lee, Lim, & Fullerton, 2010). Initial participants were identified through existing SE databases and contact lists, as well as referrals from intermediary hubs supporting SEs. These initial contacts then referred to other SEs within their networks. To broaden the pool of potential SE participants, additional SEs were identified through online searches and the websites of SE hubs and contacted via email. This multi-source recruitment strategy helped reach SEs with different backgrounds and operational contexts.
Participants were founders and managers who were directly involved in or had a comprehensive understanding of SIM practices within their SEs. Although these roles involve different strategic and operational responsibilities, both founders and managers were represented across the extracted factors. This indicates shared interpretations of SIM practices rather than role-based differences. Including participants with different organizational roles was intentional, as Q method aims to capture the diversity of subjectivity surrounding a phenomenon rather than compare predefined respondent categories. This diversity, therefore, helps reveal different ways in which SIM practices are understood and implemented across organizations. The participating SEs range from young (established for 4 years) to long-standing (with nearly 30 years of history) and operate in various sectors, including tourism-related, education, manufacturing, sports and environmental protection, offering a broad perspective on impact measurement across different fields. These varied organizational backgrounds contribute to capturing a broad spectrum of SIM practices across different operational contexts.
3.3 Data collection
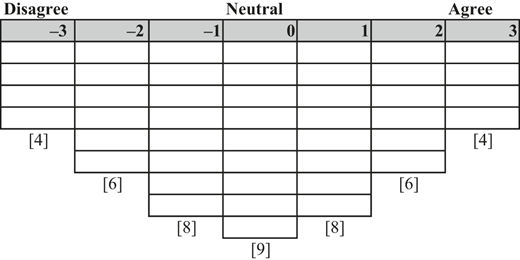
Each participant performed Q-sorting, either online or in person, arranging the 45 statements into a forced normal distribution matrix (ranging from −3 to +3) to indicate their level of agreement (see Table 1). Compared to free distribution, forced distribution delimits unnecessary work and is convenient for participants (Watts & Stenner, 2005).
Following this sort, participants were interviewed to explain the reasoning behind their placement of selected statements, especially those they ranked at the extremes. These open-ended comments enriched the interpretation of the Q-sorts (Watts & Stenner, 2005), and were transcribed and translated into English when necessary. Data collection (Q-sorting and interviews) was conducted during spring 2025.
3.4 Data analysis
Data were analyzed using the KenQ platform. Principal component analysis was used to extract factors, followed by varimax rotation. Factor extraction and interpretation were performed separately for the Hungarian and Vietnamese samples, and then again for the combined sample. Distinguishing statements (p < 0.05) were used to interpret and label the factors. Comparative analyses were conducted both within and across national contexts.
4. Findings
4.1 Intra-country similarities and differences
Eight factors were obtained in both subsamples. Four factors from the Hungarian group and three from the Vietnamese group exhibited eigenvalues over 1.0, a standard criterion for factor selection in Q methodology (Watts & Stenner, 2005). Moreover, all factor score correlations within the subsamples were under 0.5, and the condition of having at least two opinions within a single factor was also satisfied. As a result, we chose the four-factor solution for the Hungarian sample and the three-factor solution for the Vietnamese one (see Table 2).
Eigenvalues and explained variances (%) of the top factors
| Factor | Eigenvalue | Explained variance | Cumulative explained variance (%) |
|---|---|---|---|
| Hu SE factor 1 | 2.67 | 27 | 27 |
| Hu SE factor 2 | 1.35 | 13 | 40 |
| Hu SE factor 3 | 1.28 | 13 | 53 |
| Hu SE factor 4 | 1.10 | 11 | 64 |
| Vie SE factor 1 | 3.87 | 38 | 38 |
| Vie SE factor 2 | 1.37 | 14 | 52 |
| Vie SE factor 3 | 1.17 | 12 | 64 |
Note(s): “Hu SE” refers to Hungarian SEs; “Vie SE” refers to Vietnamese SEs
According to the factor loadings of varimax rotation and auto flagging, four participants loaded onto Factor 1, while two participants loaded onto each other factor in the Hungarian sample. In the Vietnamese SE dataset, the participants in each factor were 4, 3 and 3, respectively.
We interpreted and named each factor based on its distinguishing statements at the significance level of p < 0.05 (see Table 3 for Hungarian SEs and Table 4 for Vietnamese SEs). The following sections present the factors for each country, followed by a comparative analysis within contexts.
Distinguishing statements for Hungarian SE factors
| Factor | Statement number | Factor 1 | Factor 1 | Factor 2 | Factor 2 | Factor 3 | Factor 3 | Factor 4 | Factor 4 |
|---|---|---|---|---|---|---|---|---|---|
| Q sort value | Z score | Q sort value | Z score | Q sort value | Z score | Q sort value | Z score | ||
| Hu SE factor 1 | 24 | 3* | 1.5 | −2 | −1.07 | 1 | 0.17 | −1 | −0.77 |
| 25 | 2* | 1.2 | 0 | 0.02 | 0 | −0.17 | −1 | −0.68 | |
| 22 | 2 | 1.01 | −1 | −1.03 | −3 | −1.56 | 0 | 0.00 | |
| 42 | 1 | 0.89 | −1 | −0.34 | 0 | −0.26 | 0 | 0.00 | |
| 28 | 0* | 0.27 | −2 | −1.07 | 2 | 1.39 | −2 | −1.44 | |
| 20 | −1 | −0.34 | −3 | −2.12 | −3 | −2.09 | −2 | −1.35 | |
| 5 | −1* | −0.46 | 1 | 0.71 | 3 | 1.82 | −3 | −2.02 | |
| 44 | −2 | −0.88 | 0 | 0.05 | 1 | 0.17 | 2 | 0.96 | |
| 2 | −2 | −1.24 | 0 | 0.34 | −1 | −0.43 | −1 | −0.29 | |
| 7 | −3 | −1.57 | 0 | 0.05 | −1 | −0.53 | 0 | −0.19 | |
| Hu SE factor 2 | 17 | −1 | −0.76 | 3* | 2.12 | 0 | −0.17 | 0 | 0.38 |
| 8 | −3 | −1.56 | 2* | 1.05 | −2 | −0.96 | −1 | −0.19 | |
| 9 | −1 | −0.88 | 2* | 1.05 | −1 | −0.43 | −1 | −0.87 | |
| 14 | 0 | −0.17 | 1 | 0.75 | −1 | −0.43 | −2 | −1.35 | |
| 5 | −1 | −0.46 | 1 | 0.71 | 3 | 1.82 | −3 | −2.02 | |
| 37 | 1 | 0.61 | −2* | −1.05 | 1 | 0.60 | 1 | 0.48 | |
| 6 | 1 | 0.33 | −2 | −1.39 | −1 | −0.43 | 0 | −0.19 | |
| Hu SE factor 3 | 5 | −1 | −0.46 | 1 | 0.71 | 3 | 1.82 | −3 | −2.02 |
| 38 | 1 | 0.34 | 0 | 0.37 | 2 | 1.66 | 1 | 0.48 | |
| 28 | 0 | 0.27 | −2 | −1.07 | 2* | 1.39 | −2 | −1.44 | |
| 26 | 0 | −0.27 | −1 | −0.34 | 1 | 0.7 | −1 | −0.77 | |
| 16 | −3 | −2.24 | −3 | −1.44 | 1* | 0.7 | −3 | −1.64 | |
| 24 | 3 | 1.5 | −2 | −1.07 | 1 | 0.17 | −1 | −0.77 | |
| 23 | 3 | 1.74 | 2 | 1.02 | 1 | 0 | 3 | 1.54 | |
| 31 | 2 | 1.14 | 2 | 1.07 | −1* | −0.36 | 3 | 1.35 | |
| 15 | 1 | 0.67 | 3 | 1.1 | *-2 | −0.96 | 0 | 0.29 | |
| Hu SE factor 4 | 45 | −1 | −0.86 | −2 | −1.41 | −2 | −0.86 | 3* | 1.35 |
| 36 | −2 | −0.92 | −1 | −0.73 | −3 | −1.66 | 2* | 1.25 | |
| 13 | 0 | 0.03 | −1 | −0.71 | −1 | −0.53 | 2 | 1.06 | |
| 22 | 2 | 1.01 | −1 | −1.02 | −3 | −1.56 | 0 | 0 | |
| 29 | 2 | 1.04 | 0 | 0.32 | 0 | −0.1 | −3* | −1.44 | |
| 19 | 1 | 0.53 | 1 | 0.37 | 0 | −0.1 | −3* | −1.54 | |
| 5 | −1 | −0.46 | 1 | 0.71 | 3 | 1.82 | −3* | −2.02 |
Note(s): * indicates significance at p < 0.01
Distinguishing statements for Vietnamese SE factors
| Factor | Statement number | Factor 1 | Factor 1 | Factor 2 | Factor 2 | Factor 3 | Factor 3 |
|---|---|---|---|---|---|---|---|
| Q sort value | Z score | Q sort value | Z score | Q sort value | Z score | ||
| Vie SE factor 1 | 40 | 1* | 0.73 | −3 | −1.73 | −1 | −0.62 |
| 34 | 1* | 0.51 | −2 | −1.29 | −1 | −0.70 | |
| 7 | 0 | 0.3 | −2 | −1.02 | −1 | −0.46 | |
| 45 | 0* | 0.01 | −3 | −1.74 | −2 | −1.43 | |
| 6 | 0* | −0.11 | 2 | 1.12 | 3 | 1.64 | |
| 42 | 0 | −0.2 | 1 | 0.75 | 1 | 0.61 | |
| 39 | −1* | −0.41 | −3 | −1.87 | −3 | −1.61 | |
| 18 | −1 | −0.6 | 0 | 0.14 | 0 | 0.14 | |
| 5 | −3* | −2.11 | 1 | 0.82 | 2 | 0.95 | |
| Vie SE factor 2 | 30 | 0 | −0.21 | 3* | 1.29 | 0 | −0.38 |
| 35 | −2 | −1.11 | 2* | 1.27 | −2 | −0.77 | |
| 15 | −1 | −0.32 | 2* | 1.06 | −2 | −0.84 | |
| 31 | −2 | −0.91 | 1* | 0.75 | 0 | −0.28 | |
| 38 | 2 | 1.01 | 0 | 0.17 | 2 | 1.12 | |
| 22 | 1 | 0.71 | 0 | −0.02 | 2 | 1.37 | |
| 9 | −2 | −1.41 | 0 | −0.04 | −2 | −1.00 | |
| 14 | 1 | 0.61 | 0 | −0.14 | 1 | 0.89 | |
| 8 | −2 | −1.21 | 0* | −0.17 | −3 | −1.70 | |
| 25 | 2 | 0.9 | −1* | −0.43 | 1 | 0.68 | |
| 21 | 2 | 1 | −1* | −0.56 | 3 | 1.50 | |
| 16 | 2 | 1.22 | −1* | −0.6 | 2 | 1.20 | |
| 40 | 1 | 0.73 | −3* | −1.73 | −1 | −0.62 | |
| Vie SE factor 3 | 11 | 1 | 0.61 | 0 | 0.22 | 3* | 1.7 |
| 19 | −1 | −0.41 | −1 | −0.55 | 1* | 0.75 | |
| 43 | −3 | −1.51 | −2 | −1.27 | 0* | 0.26 | |
| 33 | 2 | 1.01 | 2 | 0.91 | 0* | −0.13 | |
| 3 | 2 | 1.31 | 3 | 1.41 | −1* | −0.44 | |
| 40 | 1 | 0.73 | −3 | −1.73 | −1* | −0.62 | |
| 2 | −3 | −1.81 | −3 | −1.88 | −1* | −0.69 | |
| 37 | 0 | 0.2 | 1 | 0.67 | −1* | −0.75 | |
| 1 | 3 | 2.11 | 3 | 1.85 | −2* | −1.21 | |
| 20 | −1 | −0.52 | −2 | −0.88 | −3 | −1.68 | |
| 17 | 0 | 0.19 | 1 | 0.43 | −3* | −1.82 |
Note(s): * indicates significance at p < 0.01
4.1.1 Hungarian SE Factor 1 – “stakeholder oriented”
Participants loading on this factor tended to prioritize stakeholder engagement as a key driver shaping how they design and interpret SIM. For this group, a belief in co-developing metrics with stakeholders will define what is meaningful and feasible to measure. One founder stated that:
I think there are stakeholders who can't really help in improving the impact measurement. But in this case, we should work with all of them, or at least just ask them.
These participants supported structured frameworks such as the balanced scorecard to evaluate performance across multiple dimensions. They firmly rejected subjective or unverifiable assessments and were wary of using inadequate metrics, though not entirely dismissive. While they recognized critiques of how funders use impact data, their primary concern was improving internal practices rather than challenging external actors.
4.1.2 Hungarian SE Factor 2 – “practically oriented”
Participants belonging to this factor practice SIM through a practical and critical lens. They strongly admitted the complexity and external pressure of impact measurement, preferring a practical priority on product and service improvement to evaluation efforts. They rejected informal and daily activity-based assessments, with one participant remarking:
It would be really hard to measure; the activity is too much.
They shared concerns about SE's perceived inefficiency and noted underutilized collaboration and peer learning among SEs. They rejected the assumption that balancing social goals and financial stability leads to better impact, indicating possible skepticism toward trade-offs between financial goals and social mission focus.
4.1.3 Hungarian SE Factor 3 – “flexible and short-term preferred”
Participants in this factor recognized the sector's negative external image of inefficiency but did not consider it a real internal challenge. Instead, they expressed confidence in SEs' capability to conduct impact measurement despite their size and rejected the prejudice that they lack required skills and resources. They criticized funders for imposing impact data collection without meaningful application or valuing social outcomes equally. While they supported stakeholder understanding and transparent communication, they preferred short-term, adaptable tracking approaches. One founder confirmed:
I think short-term outcomes are also very good, … and let's say it disappears in a month, but maybe it changes something in the people's mind or heart, so actually the short-term becomes long-term.
This illustrates a belief that short-term impacts can catalyze meaningful and lasting change. These participants endorsed mixed indicators but resisted long-term-only frameworks, reflecting a preference for flexibility in impact measurement.
4.1.4 Hungarian SE Factor 4 – “long-term oriented”
Differing from Factor 3, this group could be characterized as independent and long-term thinking. They emphasized the value of long-term change other than quick results. They strongly preferred locally developed tools to global standards and viewed external incentives and support as essential drivers of impact measurement. One participant illustrated:
It's better because we are a small organization. We work with few people, basically, not like thousands.
They perceived funder-SE tensions, rejecting the inefficiency stereotype and the difficulty in identifying broad beneficiaries. They were neutral on stakeholder co-decision in impact measurement.
4.1.5 Vietnamese SE Factor 1 – “standardization preferred”
The SEs who belonged to this factor partly valued standardization, unlike other groups who strongly disagreed with it. While they moderately supported global standards, they remained uncertain about the appropriateness of self-developed tools and structured frameworks like the balanced scorecard. As such, they might be predicted to simplify the measurement and/or follow the existing guidelines. One founder emphasized:
When needed, we can apply a set of indexes such as of the United Nations... It can be a framework to set levels… and others also apply, in their own way.
and another added:
All the funding requires an output and an assessment… Of course, we have a system that depends on each program… And if they want you to do more, you have to add more. That's how we're doing it.
These participants preferred short-term outcomes for adaptive strategy and were skeptical of using numeric metrics for long-term impact, indicating some appreciation for qualitative insights. They strongly opposed the view of SEs' inefficiency and held a pragmatic attitude on the trade-off between financial and social goals and the subjectivity of impact measurement.
4.1.6 Vietnamese SE Factor 2 – “seeking for support”
This group was realistic when highlighting the burden of impact measurement for newly established and inexperienced SEs. They strongly agreed that impact evaluation is more demanding than beneficial and emphasized their lack of skills, tools and resources. As a result, they rejected the opinion that small SEs can manage measurement effectively. One SE stated:
… a lot of SEs … with the goodness of heart, but it does not necessarily mean that they know how to do that. …you're always working with too few resources ... People are too busy juggling so many balls … and you outsource it, but you have to have money. Then you have to have time to tell those outsourced people about your organization. So, it's a lot of resources needed.
They held little faith in collaboration and networking among SEs or stakeholder involvement in designing and improving the measurement. Their motivation for measuring impact remained unclear, as they were neutral on external pressure and prioritization between measurement and product or service improvement.
Despite internal limitations, they believed long-term impact should be prioritized, and every social impact should last more than one year. However, they seemed unfamiliar with or indifferent to layered frameworks including outcome, output and impact. They firmly opposed universal indicators and doubted the feasibility of metric standardization.
4.1.7 Vietnamese SE Factor 3 – “cautious implementers”
The participants in this group implemented SIM with a cautious and critical mindset. While they acknowledged the importance of having adequate resources, they emphasized that this alone does not make impact assessment easy, particularly when dealing with complex beneficiary groups or tracking long-term effects. Interestingly, they did not perceive mission diversity as a major obstacle to evaluation.
They strongly opposed using wrong metrics “just to have something” and were wary of the “one-size-fits-all” indicators, but not neglective to formal tools and techniques. Their skepticism extended to tools like SROI and the idea of bypassing result verification.
This group downplayed the equal role of financial health and social impact in SEs' success, highlighting the importance of intangible values, and rejected the assumption that financial reporting alone reflects SE contributions.
4.1.8 Comparison among Hungarian SE factors
Despite their different orientations, all four Hungarian SE factors shared a belief in the importance of long-term impact while rejecting the overreliance on numerical indicators to capture such impact. However, Factor 3, while endorsing long-term goals, acknowledged adaptable and short-term tracking. In contrast, Factor 4 was the most strongly long-term oriented, believing only long-term change to be the true measure of the social mission progress.
Another point of consensus was the rejection of wrong metrics, coupled with an emphasis on starting with appropriate tools and maintaining transparent communication. There was strong support for using a mix of quantitative and qualitative methods. All factors admitted the difficulty of standardizing the metrics across diverse contexts. However, they varied in their responses to this challenge. Factor 1 and Factor 2 refused the feasibility of universal indicators, while Factor 3 supported a standardized set despite the known challenge. Factor 4 neither agreed nor disagreed with one-size-fits-all solution but strongly stood for self-developed tools and indicators, in contrast to other groups.
4.1.9 Comparison among Vietnamese SE factors
Participants in the Vietnamese sample slightly rejected the idea that impact measurement is prohibitively resource-intensive, thereby emphasizing the necessity of result verification and recognizing impact measurement's role in building stakeholder trust. While skeptical about funders' support for overhead costs involved in measuring the impact, they agreed that measurement data are rarely used in funder decisions. Sharing a similar perspective to Hungarian participants, Vietnamese sample also refused to use poor-quality metrics, confirming transparency of external communication and a lifetime duration of some impacts.
However, key differences emerged in terms of the importance of financial-social balance, the role of resource constraints and the perceived capacity of small SEs. While Factors 1 and 2 viewed financial health and social impact as equally important, Factor 3 prioritized social outcomes over financial ones. Nevertheless, this group still believed that striking a balance between the two ultimately leads to a more meaningful impact. For them, success likely means achieving deep social change, not simply surviving financially, though they recognized financial sustainability, as necessary. Factor 2 saw a lack of skills, training and resources as a major barrier to effective impact measurement, while Factor 1 and 3 rejected it. Factor 2 disagreed that small SEs can allocate their time and resources effectively for impact measurement, in contrast to the agreement of Factor 1 and 3.
4.2 Cross-country similarities and differences
The study aimed to explore shared mindsets regarding SIM beyond national contexts. To achieve this, the Hungarian and Vietnamese SE subsamples were merged, and a combined Q analysis was conducted, resulting in four new factors (see Table 5). Notably, all conditions such as eigenvalues, factor score correlations and number of participants loading onto each factor were satisfied.
Factor loading table in the combined sample
| Q sort | Factor group | Factor 1 | Factor 2 | Factor 3 | Factor 4 |
|---|---|---|---|---|---|
| P15 | F1-1 | 0.8149* | 0.24 | 0.1628 | 0.1485 |
| P14 | F1-2 | 0.7387* | 0.1547 | 0.1249 | −0.0135 |
| P17 | F1-3 | 0.671* | −0.1501 | −0.0664 | 0.1605 |
| P5 | F1-4 | 0.5613* | 0.3162 | −0.3482 | 0.2578 |
| P9 | F1-5 | 0.5239* | 0.1523 | 0.3359 | −0.0703 |
| P16 | F1-6 | 0.4982* | −0.0452 | 0.4292 | 0.2326 |
| P13 | F2-1 | 0.2754 | 0.8659* | −0.0718 | 0.1 |
| P19 | F2-2 | 0.2546 | 0.7014* | −0.0674 | −0.219 |
| P7 | F2-3 | −0.1017 | 0.6157* | 0.3292 | 0.2693 |
| P6 | F2-4 | −0.2348 | 0.5989* | 0.4127 | −0.0436 |
| P11 | F2-5 | 0.5548 | 0.5578 | −0.0656 | 0.1638 |
| P18 | F2-6 | 0.1156 | 0.4609* | 0.2169 | 0.1424 |
| P2 | F3-1 | −0.0012 | 0.0387 | 0.7444* | 0.0207 |
| P1 | F3-2 | 0.3141 | 0.2357 | 0.5438* | 0.2061 |
| P20 | F3-3 | 0.3941 | 0.3116 | 0.5128* | 0.0188 |
| P4 | F4-1 | 0.0124 | 0.0295 | 0.0494 | 0.7401* |
| P10 | F4-2 | 0.1605 | −0.2384 | 0.285 | 0.6824* |
| P3 | F4-3 | 0.0589 | 0.1731 | −0.2495 | 0.6225* |
| P12 | F4-4 | 0.5485 | 0.179 | 0.2479 | 0.5522 |
| P8 | F4-5 | 0.2603 | 0.3405 | 0.1827 | 0.5003* |
Note(s): * indicates Q-sorts flagged
We interpreted each factor as we normally would, using the distinguishing statements (see Table 6), combining to identify country composition (see Table 7).
Distinguishing statements for combined SE factors
| Factor | Statement number | Factor 1 | Factor 1 | Factor 2 | Factor 2 | Factor 3 | Factor 3 | Factor 4 | Factor 4 |
|---|---|---|---|---|---|---|---|---|---|
| Q sort value | Z score | Q sort value | Z score | Q sort value | Z score | Q sort value | Z score | ||
| Combined factor 1 | 1 | 3* | 2.31 | 3 | 1.51 | 1 | 0.61 | 1 | 0.35 |
| 24 | 3* | 1.33 | 1 | 0.53 | 0 | 0.40 | −2 | −1.05 | |
| 37 | 2 | 1.28 | −1 | −0.40 | 1 | 0.45 | −1 | −0.68 | |
| 30 | 2 | 1.13 | 0 | −0.21 | 0 | 0.17 | 1 | 0.51 | |
| 20 | 0* | −0.11 | −3 | −1.61 | −3 | −2.05 | −3 | −2.15 | |
| 33 | 0* | −0.17 | 1 | 0.90 | −3 | −1.71 | 2 | 1.36 | |
| 21 | 0* | −0.2 | 2 | 0.92 | 2 | 1.03 | 2 | 1.23 | |
| 44 | −2* | −1.26 | −1 | −0.23 | 2 | 1.08 | 0 | 0.25 | |
| 43 | −3* | −2.01 | −1 | −0.94 | 0 | 0.02 | −1 | −0.94 | |
| Combined factor 2 | 1 | 3 | 2.31 | 3 | 1.51 | 1 | 0.61 | 1 | 0.35 |
| 16 | −2 | −1.08 | 2* | 1.41 | −1 | −0.48 | −3 | −1.40 | |
| 40 | −3 | −1.49 | 2* | 1.31 | 0 | 0.20 | −2 | −1.04 | |
| 11 | −1 | −0.25 | 2* | 0.97 | −1 | −0.46 | 0 | 0.12 | |
| 45 | −2 | −1.09 | 0* | 0.07 | −2 | −1.14 | −2 | −1.03 | |
| 19 | 0 | 0.14 | −1 | −0.75 | 1 | 0.56 | 0 | 0.05 | |
| 31 | 2 | 0.99 | −1* | −0.77 | 1 | 0.54 | 3 | 1.41 | |
| 5 | −1 | −0.53 | −2 | −1.22 | 3 | 1.54 | 0 | −0.14 | |
| 15 | 2 | 1.17 | −2* | −1.35 | 0 | 0.30 | 2 | 1.17 | |
| 35 | 1 | 0.74 | −3* | −1.5 | 3 | 1.37 | 2 | 1.34 | |
| Combined factor 3 | 5 | −1 | −0.53 | −2 | −1.22 | 3* | 1.54 | 0 | −0.14 |
| 28 | 1 | 0.18 | 0 | 0.26 | 3* | 1.29 | −2 | −1.35 | |
| 12 | 0 | −0.12 | −1 | −0.23 | 2 | 1.16 | 0 | 0.23 | |
| 44 | −2 | −1.26 | −1 | −0.23 | 2 | 1.08 | 0 | 0.25 | |
| 13 | −1 | −0.52 | 0 | −0.12 | 2 | 0.72 | −1 | −0.57 | |
| 26 | −1 | −0.78 | 0 | −0.19 | 1 | 0.6 | −1 | −0.71 | |
| 10 | −3 | −1.27 | −3 | −1.66 | 1 | 0.45 | −1 | −0.48 | |
| 37 | 2 | 1.28 | −1 | −0.4 | 1 | 0.45 | −1 | −0.68 | |
| 15 | 2 | 1.17 | −2 | −1.35 | 0 | 0.3 | 2 | 1.17 | |
| 40 | −3 | −1.49 | 2 | 1.31 | 0* | 0.2 | −2 | −1.04 | |
| 43 | −3 | −2.01 | −1 | −0.94 | 0* | 0.02 | −1 | −0.94 | |
| 3 | 3 | 1.61 | 2 | 1.17 | −1* | −0.61 | 1 | 0.39 | |
| 17 | 0 | −0.07 | −1 | −0.35 | −2 | −1.1 | 3 | 1.80 | |
| 4 | 0 | −0.21 | 0 | −0.17 | −2* | −1.14 | 2 | 1.05 | |
| 18 | 0 | −0.13 | 0 | −0.09 | −2* | −1.14 | 1 | 0.35 | |
| 33 | 0 | −0.17 | 1 | 0.9 | −3* | −1.71 | 2 | 1.36 | |
| Combined factor 4 | 17 | 0 | −0.07 | −1 | −0.35 | −2 | −1.1 | 3* | 1.8 |
| 4 | 0 | −0.21 | 0 | −0.17 | −2 | −1.14 | 2* | 1.05 | |
| 8 | −2 | −1.01 | −3 | −1.48 | −2 | −1.28 | 1* | 0.75 | |
| 9 | −1 | −0.94 | −2 | −1.16 | −1 | −0.89 | 1* | 0.56 | |
| 3 | 3 | 1.61 | 2 | 1.17 | −1 | −0.61 | 1 | 0.39 | |
| 2 | −3 | −1.54 | −2 | −1.12 | −2 | −1.1 | 0* | 0.17 | |
| 36 | −2 | −1.1 | −2 | −1.31 | −3 | −1.84 | 0* | −0.16 | |
| 10 | −3 | −1.27 | −3 | −1.66 | 1 | 0.45 | −1 | −0.48 | |
| 27 | 0 | 0.11 | 1 | 0.34 | 0 | 0.35 | −2* | −1 | |
| 24 | 3 | 1.33 | 1 | 0.53 | 0 | 0.4 | −2* | −1.05 | |
| 6 | 1 | 0.55 | 1 | 0.29 | 0 | 0.1 | −2* | −1.21 | |
| 28 | 1 | 0.18 | 0 | 0.26 | 3 | 1.29 | −2* | −1.35 | |
| 34 | −1 | −0.26 | 1 | 0.31 | −1 | −0.2 | −3* | −1.51 |
Note(s): * indicates significance at p < 0.01
Combined factor characteristics – national composition
| Combined factor | No of SEs | No of Vie SEs | Vie participants | Vie SE factor | No of Hu SEs | Hu participants | Hu SE factor |
|---|---|---|---|---|---|---|---|
| Combined factor 1 | 6 | 3 | P5, P14, P16 | Vie SE factor 2 (P14, P16), Vie SE factor 1 (P5) | 3 | P9, P15, P17 | Hu SE factor 1 |
| Combined factor 2 | 5 | 3 | P6, P13, P19 | Vie SE factor 2 (P13, P19), Vie SE factor 3 (P6) | 2 | P7, P18 | Hu SE factor 3 (P7), Hu SE factor 4 (P18) |
| Combined factor 3 | 3 | 1 | P20 | Vie SE factor 3 | 2 | P1, P2 | Hu SE factor 1 (P1), Hu SE factor 3 (P2) |
| Combined factor 4 | 4 | 1 | P8 | Vie SE factor 3 | 3 | P3, P4, P10 | Hu SE factor 4 (P3), Hu SE factor 2 (P4, P10) |
| Outliers | 2 | 2 | P11, P12 | Vie SE factor 1 (P11), Vie SE factor 2 (P12) | 0 |
Combined Factor 1 and 2 were well-mixed when included 3-3 and 3-2 Vietnamese and Hungarian SEs, indicating a transnational view.
Combined Factor 1 blended Hungarian SE Factor 1 with Vietnamese SE Factor 1 and 2. These participants strongly supported stakeholder-centered measurement and valued inclusive approaches other than formal reports. They found greater burden for young SEs, while strongly opposing SROI as the best option, believing in other standardized or non-standardized methods. This group shared a consistent view across the national boundaries.
Combined Factor 2 shared similarities with Combined Factor 1 in valuing a balance between social and financial goals. However, it distinguished itself by advocating to simplify the measurement process and rely on universal methods, showing less caution than participants in Vietnamese SE Factor 3, from which some of them originated. Compared to national-level factors, this factor also reflected a notable shift in attitude. Participants previously associated with Vietnamese SE Factor 2, who had expressed a need for support despite access to resources, now appeared more optimistic about SEs' productivity and their ability to overcome barriers. They did not prefer long-term options (as Hungarian SE Factor 4) to short-term tracking (as Hungarian SE Factor 3).
Combined Factor 3 and 4 were also mixed nations but seemed predominantly from Hungary, showing a culture-specific but present in both. Opposite Combined Factor 2, Combined Factor 3 accepted the bad image of SEs' inefficiency. This factor strongly reflected the characteristics of Hungarian Factor 1 and 3 when blaming funders' pressure with little practical return for SEs. They also confirmed the caution of Vietnamese Factor 3 when highlighting social value complexity. They held a new view of all other national and combined factors, standing at customers' side when introducing a market realism perspective that buyers actually value quality and price over social reporting. As can be seen, mixed participants in this factor converge on a realistic and critical stance.
Combined Factor 4 shared the same concern with Combine Factor 3, highlighting the difficulty of measuring social performance due to the diversity of problems and beneficiaries. Compared to Hungarian SE Factor 4 and Vietnamese SE Factor 3 included within it, this factor emphasized the burden of time and skills required for evaluation, and skepticism about external pressure from funders. Unlike Combined Factor 2, this group placed less value on short-term insights and external incentives, showing a more cautious and reflective attitude toward impact measurement.
5. Discussion
The factor interpretations revealed significant consensus in how participating founders and managers in Hungarian and Vietnamese SEs practice SIM, even though the local contexts and institutional environments are different.
Across both national samples, SEs increasingly adopt a stakeholder-engaged mindset at the center of impact measurement. This logic appeared prominently in Hungarian SE Factor 1 and in Combined Factor 1, forming the “stakeholder-oriented” group. Participants' opinions reflect their willingness to co-design the process, understand diverse needs and maintain transparent communication. This orientation aligns with the existing literature (Bellucci, Nitti, Franchi, Testi, & Bagnoli, 2019; Dufour, 2019; Ormiston, 2019; Mamabolo & Myres, 2020; Costa & Andreaus, 2021; Liston-Heyes & Liu, 2021), emphasizing the importance of varied and context-specific stakeholder collaborations. A possible explanation for this shared emphasis is the multi-stakeholder nature of SEs. Unlike conventional businesses, SEs operate at the intersection of economic, social and sometimes environmental objectives. As such, they are constantly navigating complex expectations from various stakeholders including not only traditional business partners but also non-targeted stakeholders, and not only customers but also beneficiaries (Sparviero, 2019). This complexity makes stakeholder engagement not just a value but a necessity in designing credible impact measures.
Another factor shaping SIM practices is the participants' interpretations on standardized metrics versus context-specific tools. The majority of founders and managers in our samples shared their rejection of one-size-fits-all tools. This finding coincides with and reinforces the research by Perrini et al. (2021); Polonsky et al. (2016). While some participants acknowledged the potential benefits of global indicators or frameworks such as SROI, the balanced scorecard or SDGs, they also emphasized the importance of customizing the measurement to their own scale, goals and beneficiaries. Even among those more open to structured methods, for example, Combined Factor 2, Hungarian SE Factor 1 and Vietnamese SE Factor 1, the motivation was rooted in adopting a shared measurement process and simplifying burdens rather than endorsing universal metrics uncritically. This indicates the value of having a common approach to guiding impact measurement. SEs may see the shared process as a way to reduce technical and administrative tasks while also learning from peers. They can rely on common principles such as the theory of change and stakeholder mapping, to design customized measurement systems.
Resource limitations and capacity constraints were a prominent factor, especially in Vietnamese Factor 2 and Combined Factor 4. For these participants, the absence of clear guidelines and training made impact measurement an imposed duty other than a strategic asset, reinforcing existing research on capacity-related barriers (Grieco, 2018; Leung et al., 2019; Costa & Andreaus, 2021). However, participants in Hungarian SE Factors 3 held a contradictory view, expressing confidence in SEs' ability to carry out SIM despite their small size. These contrasting perspectives highlight how perceived capacity influences SEs' prioritization of measurement.
Moreover, Combined Factors 3 and 4, with strong Hungarian representation, framed the measurement through a critical lens, highlighting unrealistic funders' expectations, the undervaluation of social outcomes and the market's preference for price and quality over social claims. These distinctions may root from contextual conditions of different cultural backgrounds of the two countries included in the sample (this is mainly in line with the work of Polonsky et al. (2016), who studied these aspects from a Western perspective). SEs have been legally recognized under the 2014 Enterprise Law, creating legitimacy and institutional pressure for compliance (Nguyen et al., 2021), which may explain why some Vietnamese SEs emphasize external expectations more than their Hungarian counterparts. Conversely, the lack of a legal identity in Hungary might enable more autonomy in assessing impact internally. Although results have to be handled with extra caution beyond the sample (both related to the method and the heterogeneity of cultures among countries in different continents), these findings also contribute to a better understanding of the context of SEs' impact measurement in a European and Asian context.
Participants in our research also differed in how they tend to respond to the sector's perceived inefficiency. The criticism emerged from the study by Abbott et al. (2019). In our study, Hungarian social entrepreneurs expressed their willingness to address the negative image associated with their sector, either acknowledging it as a reputational risk or challenging it by showcasing their competence and influence. Vietnamese SEs in our sample, meanwhile, characterized it as a misconception.
Hungarian and Vietnamese participants also differed in their conceptualization of the duration of impact. Hungarian Factor 3 and 4 stressed the importance of long-term change, even when acknowledging the need for short-term indicators. This finding confirmed the long-term prioritization in the research by Nielsen, Lueg, and Van Liempd (2021). On the other hand, Vietnamese participants were generally more cautious, balancing the ambition for long-term impact with an acceptance of short-term results. This pattern consolidated with tailored work, aim and capacities of SEs, leading to flexible choosing of short or long-term priority in the study of Bassi and Vincenti (2019). The contrast between the two national participants suggests that duration is not just a technical concern, but a reflection of differing organizational rhythms, risk preferences and adaptation strategies.
The findings of the mentioned consensus and disagreement between participating Hungarian and Vietnamese SEs provide implications for practitioners, funders and policymakers to improve SIM practices. For practitioners, stakeholder participation is a vital practical strategy to build legitimacy, generate meaningful data and enhance internal capacity. In both national contexts, there was a strong desire for participatory approaches that respect organizational characteristics and local contexts. At the same time, while acknowledging the benefits of shared frameworks such as SROI and the BSC, SEs should flexibly adapt them to their unique mission. For funders, it is recommended to offer more context sensitive and capacity building oriented support for impact measurement rather than imposed universal metrics. For policymakers, legal frameworks could help formalize support for SEs. Particularly, the related regulations should place room for adaptability, provide stronger incentives and avoid embedding rigid measurement requirements. Policymakers can also play a role in facilitating shared processes and collective resources to help balance standardization with contextual relevance.
6. Conclusion
This study explored how founders and managers in Hungarian and Vietnamese SEs approach and make sense of SIM practices, using Q method to identify distinct configurations in both intra- and cross-national contexts. The analysis explored four distinct factors in the Hungarian SEs sample, three in the Vietnamese SEs sample and four in the combined dataset, offering a deeper understanding of practitioners' SIM orientations. The findings revealed important common ground in both national SEs' contexts. Despite differing legal settings, SEs in both Hungary and Vietnam's datasets commonly rejected one-size-fits-all approaches, preferred stakeholder-focused orientation and emphasized the need for mixed methods and long-term thinking. At the same time, the study also highlighted the cross-national differences. Hungarian SE factors showed a greater willingness to discuss the sector's perceived inefficiency, with some attempting to enhance their image by using more professional methodologies. Vietnamese SE factors, meanwhile, preferred to dismiss this reputation or characterize it as a misconception. Hungarian SEs discussed the obstacles with their complexity and applicability in various contexts. Conversely, Vietnamese SEs focused on operational issues, including concerns about time, resources and skills needed for conducting effective impact measurement. Divergences were also evident in how financial and social goals were prioritized. Vietnamese SE Factor 3 prioritized social benefits over financial sustainability, while others emphasized their mutual assistance. The combined factor analysis also revealed that Combined Factor 2 participants expressed more optimism and support for simplified, even universal processes, whereas Combined Factors 3 and 4 had critical attitudes, focusing on the market-driven orientation, the pressure from funders and the challenges of assessment. These findings indicate that cross-national learning and peer reflections may gradually influence how SEs conceptualize and implement SIM over time.
The study contributes to the growing literature on impact measurement in hybrid organizations by integrating insights from SEs operating in different contexts. First, it clarifies several underlying factors that appear to shape SIM practices among the participants, including stakeholder engagement beliefs, the use of standardized versus context-specific tools, resource and capacity constraints, relationship between SEs and funders regarding SIM requirements, orientation toward short-term versus long-term impact and assessments of social sector's inefficiency. Second, it reinforces the significance of stakeholder engagement embedded in SEs' measurement practices. Third, it adds empirical weight to critiques of standardized metrics and flexibility on adaptive processes and tools. This study also provides valuable implications for practitioners, funders and policymakers seeking to enhance SIM in the social sector.
Besides, our research has limitations. The Q method, while well suited to identifying distinct configurations of SIM practice, does not aim to be statistically generalizable. The sample size was small and context-specific, potentially limiting broader applicability. However, it still provides a good understanding of the international context of countries with very different cultures.
In this light, we advocate for future research that applies the Q method to other regional or emerging SE ecosystems to examine whether similar practice configurations emerge or whether alternative patterns can be identified. Longitudinal studies could also explore how SIM practices evolve over time, especially under changing policy, funding or public circumstances. Future studies could adopt other methods with larger samples to validate the results that arise from our research.
The supplementary material for this article can be found online.

