The number of bidders in upcoming tenders has important managerial implications for both construction clients and contractors in their decision-making in the competitive bidding process. However, there is a stagnation of research efforts on predicting the number of bidders with only a handful of studies over the past decades, which mainly focused on statistical distribution of the number of bidders. This study aims to provide a new perspective of predicting the number of bidders using machine learning (ML) algorithms.
This study adopted a case study approach with a bidding dataset of public sector construction projects in Singapore. Six ML models were developed, and linear regression was used as a baseline model is assessing the predictive performance of ML models.
The results show that ML models outperform the baseline linear regression model, in which XGBoost is the best performing model of R2 which is two times higher than the linear regression model. In addition, economic-related factors play a vital role in this prediction problem.
While the predictive performance of the developed ML models is relatively low, it indicates the challenges and complexities in this prediction problem, even with the use of artificial intelligent techniques.
Being a pioneering work, this study sets a foundation for the use of ML models in this prediction problem and offers insights for future modelling attempts towards the development of a decision support system for construction clients and contractors.
Notation
- AdaBoost
= Adaptive boosting regression;
- AI
= Artificial intelligence;
- BCA
= Building construction authority;
- β0, β1, β2,…,βp
= parameters to be estimated using the least squares criterion;
- bF
= the optimal fitness obtained in the iterative process currently;
- CatBoost
= Categorical boosting;
- CRS
= Contractors registration system;
- CW
= Construction workhead;
- DF
= represents the best fitness obtained in all iterations;
- ε
= an error term with a random normal distribution;
- E[g(x)|xK]
= expresses the expected value of the function on subset S;
- ET
= Extra tree regression;
- f
= the explanation model;
- GB
= Gradient boosting regression;
- GBDT
= Gradient boosting decision tree;
- GBM
= Gradient boosting machine;
- gx
= a value function;
- LB and UB
= the lower and upper boundaries of search range;
- LR
= Linear regression;
- MAE
= Mean square error;
- maxt
= the maximum iteration;
- ML
= Machine learning;
- n
= is the number of samples;
- N
= maximum size of coalition;
- p
= number of features;
- R2 or R-squared
= Coefficients of determination;
- r and r
= random value in the interval of [0,1];
- RF
= Random forest;
- RMSE
= Root mean square error;
- S
= a subset of input features;
- S(i)
= represents the fitness of ;
- SMA
= Slime mould algorithm;
- SHAP
= SHapley additive exPlanations;
- SmellIndex
= the sequence of fitness values sorted (ascends in the minimum value problem);
- s
= Standard deviation of the training samples;
- TPI
= Tender price index;
- t
= current iterations;
- u
= Mean of training samples;
= a parameter with a range of [−a;a];
= a parameter decreases linearly from one to zero;
= represents the weight of slime mould;
- x
= vector of feature values of instance;
= the location of slime mould;
- and
= two individuals randomly selected from slime mould;
- X1, X2,…, Xp
= the input features;
= the individual location with the highest odour concentration currently found;
- x
= Training samples;
- XGBoost
= Extreme gradient boosting;
- Y
= the estimated number of bidders;
= set of predictions for a set of test instances d1,…,dn;
= mean of the target value;
- y1,…,yn
= set of target value; and
- ϕ
= the feature attribution.
1. Introduction
With the availability of a more powerful computing infrastructure, there is a significant increase in the appreciation and application of artificial intelligence (AI) technologies, especially its main domain machine learning (ML) techniques in the construction industry. This is well-documented in a considerable collection of systematic reviews just over a short time frame between 2022 and 2024, which aimed at identifying AI and ML applications in the industry (e.g. Adeloye et al., 2023; Datta et al., 2024; Garcia et al., 2022; Gohel et al., 2024; Oluleye et al., 2023; Pan and Zhang, 2023; Regona et al., 2023, 2024). In Gohel et al. (2024), the five identified active AI domains are ML, deep learning (DL), decision support systems, natural language processing (NLP) and the Internet of Things. Of these, it should be noted that ML is a domain of AI where a computer observes a given set of input data and generates a model based on the input data which can be used for problem solving, and DL is a subfield of ML that is performed using multiple layers of simple and adjustable computing elements called neural networks (Baduge et al., 2022). DL algorithms are generally useful with the higher dimensional data such as images, video and audio due to the presence of long computational paths, and are used extensively in the domains of visual object recognition, speech recognition, image synthesis, speech synthesis and machine translation (Baduge et al., 2022). Regona et al. (2023), on the other hand, proposed seven research clusters of AI research in construction, namely, automation, big data, digital twin, DL, ML, information systems and simulation, in which automation encompasses leveraging AI technologies to automate repetitive construction processes towards improved efficiency and safety. They found that (i) automation and ML are the pivotal points for connecting various clusters, and (ii) ML recorded the highest number of occurrences among the list of top 10 occurrence keywords. That is, ML has been the most popular trend in construction research as revealed in their systematic review. While the systematic review studies have applied varying classification methods for the respective AI applications, it seems that there is little or no limitations on possible use of AI technologies for dealing with the complex problems in the construction industry context in the whole construction project life cycle (Baduge et al., 2022; Datta et al., 2024).
The application of AI technologies including ML techniques is not new, but rather limited in the context of constructing competitive bidding context compared to other construction research areas. Most of these studies have focussed on problems at a broader and complex level, for e.g. authors have developed AI-based bidding decision support models on contractors’ bid or no-bid and bid pricing decision-making problems (e.g. Art Chaovalitwongse et al., 2012; Chua et al., 2001; Dias and Weerasinghe, 1996; Dikmen et al., 2007; Zhang et al., 2021). The other smaller collection of studies is on prediction problems in the construction competitive bidding processes using ML algorithms including the predictions of bid prices (e.g. Jang et al., 2021; Kim and Jung, 2019); tender award prices (Garcia Rodriguez et al., 2021); and pre-tender cost estimates in relative to winning bids (Kusonkhum et al., 2023). These prediction studies inform the present study and provide a basis for using ML algorithms in predicting the number of bidders in competitive bidding. There is much evidence that the number of bidders has significant impacts on many related bidding outcomes, including contractors’ project selection decision and bid pricing strategies, and the clients’ tender awarding criteria. However, unfortunately there has been little progress in this prediction problem mainly due to the absence of new ideas and perspectives (Ballesteros-Pérez and Skitmore, 2016; Ballesteros-Pérez et al., 2019). Previous studies on this prediction problem were mainly founded on statistical nature (or distribution) of the number of bidders and the use of statistical methods, in which a satisfactory solution was never reached (Ballesteros-Pérez and Skitmore, 2016).
With the advent of ML algorithms in predictions, this exploratory study aims to provide a fresh outlook of predicting the number of bidders in competitive bidding using ML models. Using a case study approach with a bidding dataset of public sector construction projects in Singapore, the specific objectives are to explore (i) the potential application of ML models, and (ii) the need for and importance of considering economic-related variables for predicting the number of bidders in upcoming tenders. It should be noted that Singapore public sector procurement of construction services was selected mainly due to availability of a rich collection of project datasets, totalling above 900 projects. Despite the exploratory nature of this present study, it sets a foundation for the use of ML models in the prediction of the number of bidders in construction competitive bidding, which is much needed to discover the potentiality of ML models and to provide a new perspective to this prediction problem. The research findings clearly have implications for the research community in their future modelling attempts, including the development of decision support models in informing construction clients’ procurement design, for example, the formulation of tender awarding criteria relative to anticipated degree of competition. Similarly, the anticipated degree of competition is clearly relevant to competing bidders in their project selection and bid pricing strategies.
2. Literature review
The number of bidders is the key variable in probabilistic approach for construction bid pricing that originated from Friedman’s (1956) bidding theory. It is also a proxy of the intensity of competition in the construction markets, reflecting the supply capacity of the industry in terms of number of “active” market players who are capable to undertake a job (Akintoye and Skitmore, 1992; De Neufville et al., 1977). Carr (1983) asserted that the number of bidders affects contractors’ profit twofold in competitive bidding, i.e. (i) the probability of winning decreases as the number of bidders increases, and (ii) contractors’ undercut their mark-ups relative to competitors’ adjustments of their mark-ups that resulted in lower bids. Correspondingly, the number of bidders is one of the key factors affecting contractors’ bid/no-bid and mark-up decisions in competitive bidding as evidenced in survey studies conducted globally. This is further affirmed by the meta-analyses in Oo et al. (2022, 2003) that aimed to identify critical factors affecting contractors’ bidding decisions from a global perspective based on a collection of past survey studies over the past 20–30 years. Their resultant lists contain as many as 264 and 215 factors affecting contractors’ bid/no-bid and make-up decisions, respectively. According to their statistical meta-analysis results, not surprisingly, the number of bidders was one of the critical factors on both lists. The number of bidders ranked second (out of 23 critical factors) in affecting contractors’ mark-up decision globally. For contractors’ bid/no-bid decision, the project payment terms, project size and client-related factors were ranked higher than the number of bidders.
Nevertheless, a recent systematic review study on construction bidding literature in the past 40 years revealed that the number of bidders and project size are the most investigated factors in past bidding models (Ahmed et al., 2024), further affirming the importance of the number of bidders in affecting contractors’ bidding decision-making. Indeed, there is much empirical evidence on the extent to which bidding outcomes in construction bidding were affected by the number of bidders (e.g. Alkhateeb et al., 2021; Oo et al., 2007a, 2008a, 2010; Skitmore, 2002). In particular, the recorded inverse relationship between the number of bidders and values of the lowest and mean bid (e.g. De Neufville et al., 1977; Oo et al., 2007a; Skitmore, 2002; Wilson et al., 1987). There is also evidence of negative association between the number of bidders (i.e. a proxy of the level of competition) and construction firms’ bidding success rate and profit margin (Drew et al., 2001; Oo et al., 2010), and the situation of a narrow profit margin in the industry (Chan et al., 2005; Dulaimi et al., 2001). These outcomes are closely related to efficiency of construction clients or contracting authorities’ procurement of construction services, including to better design their tender awarding criteria (Ballesteros-Pérez and Skitmore, 2016).
2.1 Forecasting the number of bidders in upcoming tenders
Despite the importance of the number of bidders from both clients and contractors’ standpoint and its impacts on many related outcomes, previous studies aimed at forecasting the number of bidders remain scarce in the literature. These studies have approached this prediction problem from three different perspectives. Firstly, the two most recent works focussed on forecasting number of “new” bidders in upcoming tenders using mathematical models (Ballesteros-Pérez et al., 2015, 2019). The rationale of these models was to facilitate contractors’ assessment of a more realistic level of competition and their competitors’ pricing strategies, and for construction clients to better design their tender award criteria by knowing the proportion of new versus total number of participating bidders in upcoming auctions. The second standpoint in the literature was to predict the “minimum” number of bidders in upcoming tenders by considering the prevailing market conditions in which tender price index (TPI) was used as a proxy in the proposed mathematical model (Ngai et al., 2002). In this way, construction clients would be able to secure most competitive bids by varying the minimum number of bidders according to market conditions. Thirdly, authors have been focussing on the prediction of the number of participating bidders in upcoming tenders. There is a rather intensive research activity for over 30 years between 1956 and 1986 for this category of work since the probabilistic approach instigated by Friedman (1956). Ballesteros-Pérez et al. (2015) provided a thorough review on past modelling attempts during this period of time and this will not be recounted here. The key finding from their review is that these modelling attempts were mainly founded on statistical nature (or distribution) of the number of bidders and the use of statistical methods, in which there has been little progress despite of the intensive research efforts. Correspondingly, Ballesteros-Pérez and Skitmore (2016) attempted to revisit the subject and proposed a new model to describe the statistical distribution of the number of bidders using a collection of 12 construction tender databases from different countries, which dated between 1965 and 2014. Next, a later study by Ballesteros-Pérez et al. (2016) aimed to propose a mathematical model for predicting the number and identity of likely competing bidders by specifically considered the contract size to address the possible bias caused by uneven number of contract opportunities. They used a small collection of past projects in Hong Kong during the period 1991–1996 to demonstrate their model. Since then, to the authors’ best knowledge, there has been no further publication in English on predicting the number of bidders in upcoming tenders.
While Ballesteros-Pérez and Skitmore (2016) claimed that the stagnation in research on the subject is mainly due to the lack of new ideas and perspectives among researchers, there is a key challenge that worth mentioning. That is, the potential difficulties faced by researchers in accessing the required dataset could have hindered research on this subject. This challenge relative to restricted accessibility to bidding data is, to some extent, evidenced by the use of dated databases in the recent works highlighted above for predicting the number of bidders. As experienced by the authors in the present study, even if a past bidding dataset is open data, it is most likely that an exclusive permission is required from the contracting authorities for its use for research purposes. All in all, it is expected that this prediction problem will take many more years to address successfully and with practical value in the industry. Nonetheless, contrasting to the limited past attempts that mainly using statistical approaches, this exploratory study aims to provide a fresh outlook of predicting the number of bidders in construction competitive bidding using ML models. The two key factors for this prediction problem as revealed in the literature, namely, project size and TPI have been included in the present study. A case study approach was adopted in achieving the research aim and objectives using a bidding dataset of 913 public sector construction projects in Singapore.
3. Research design
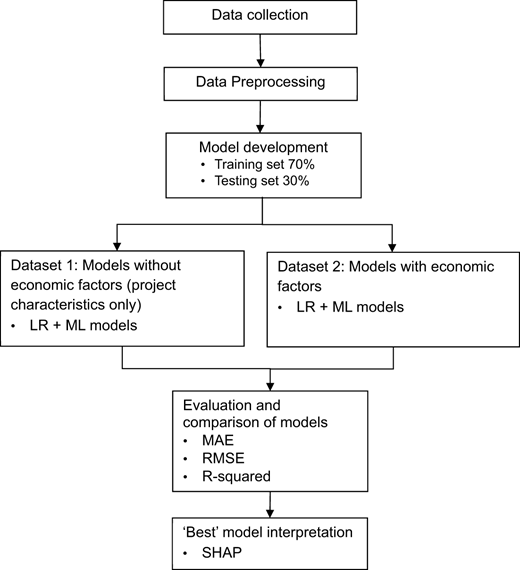
This study adopted a case study approach with a dataset of public sector construction projects in Singapore. This selection was mainly justified by the availability of bidding data and more specifically, the Singapore construction markets are driven by public sector works which contribute about 60% of the yearly total value of contracts awarded (i.e. construction demand) between 2014 and 2024 (BCA, 2024a). In addition, the public sector procurement of construction services is rooted on the principle of open and fair competition, transparency and value-for-money (Ministry of Finance, 2024). All the public sector projects are required to register and be distributed through the Singapore government’s e-procurement GEBIZ website (www.gebiz.gov.sg/), which discloses all the project information, including the public agency client’s identity, tender closing date, identities and bid prices of all competing bidders, winning bidder and the awarded contract price. Similarly, for contractors intending to tender or undertake construction and construction-related public sector projects in Singapore, they must register under BCA Contractors Registration System (CRS). The above facilitates the collection of the required data in creating a rich database of public sector construction and construction-related projects. However, there are five major groups in the CRS for these projects, namely, construction workhead, construction-related workhead, mechanical and electrical workheads, trade workheads and regulatory workheads (BCA, 2024b). With a focussed approach, this study focused on the main grouping of BCA construction workhead (CW) projects under which there are general building (CW01) and civil engineering (CW02) projects. Figure 1 show the research process that consists of data collection and the different steps of the model development, evaluation and comparison processes.
3.1 Data collection
For project data sample, the data collection process was commenced from Jan 2017 till Dec 2022 on a continual basis upon obtaining a consent from the Singapore Ministry of Finance. The tender information under the BCA construction workheads – general building (CW01) and civil engineering (CW02) projects was collected from the GeBIZ website. The full data sample consisted of 1,283 projects (or tenders) and was subjected to data screening and cleaning processes. While it is not known about the total number of tenders called and awarded over the six-year time period, it is likely that almost all, if not all, tenders for the period have been included if the respective tender information is available on the GeBIZ. The data screening and cleaning processes removed projects with incomplete records, projects that used two-envelope tender submission system and projects under a combined workheads of CW01 and CW02. It should be noted that the removal of projects that used two-envelope tender submission system was justified because most projects in the data sample were based on one-envelope tender submission. Under the Building Construction Authority’s (BCA) (2024c) price-quality method framework that applies to all public sector construction workheads CW01 and CW02 tenders with an estimated construction cost (without contingency sum) of S$3m and above, the one-envelope tender submission system requires tenderers to submit the price and quality components together in one envelope, and the scoring of the specified quality attributes is based on quantified templates with no subjective judgment. In this way, the model development focussed on two distinct BCA construction workheads (CW01 and CW02) totalling 913 projects (i.e. about 70% of full dataset) that were based on the one-envelope tender submission system. This focussed approach is critical as the varied construction workheads and tender submission system could have an impact on number of bidders responding to tender notices. Also, it enables the exploration of the effects of economic factors on number of bidders prediction on a rather established tendering system in Singapore public sectors construction projects.
On the other hand, the data collection of economic factors is rather straightforward, two industry-level economic factors, namely, the BCA’s TPI and construction demand (total value of contracts awarded in S$million) on a quarterly basis were collected from the Singapore BCA’s (2024d) Construction InfoNet. These economic factors were subjected to feature engineering to capture the quarterly trends and variations over the six-year period.
Table 1 shows the descriptive statistics of the project data sample according to size, work nature, construction workhead and the examined calendar year. There is a higher proportion of general building (CW01) compared to civil engineering projects (CW02), and most projects are small-to-medium sized (see sub-section 3.3 feature engineering for details of classification). However, the distribution between new and alteration (or upgrading) projects is rather even. Next, although there was a drop in the number of projects during the COVID years (2020–2021), the decrement was not significant in relative to preceding years. In terms of number of bidders per project, as high as 47 bidders per project were recorded with an average of above 10 bidders regardless of the varied project size, work nature and construction workhead over the six-year period. In addition, there are high variations in the recorded number of bidders per project as indicated by the relatively high standard deviation values. Nonetheless, the project data sample is on the whole a rich collection of projects that can be used for model development in the present study.
3.2 Data preprocessing
The steps involved in the data preprocessing are outlined below:
Removal of outliers: Outliers can skew the results of an ML model. While it is possible to remove the outliers in the training dataset, this would affect a ML model if there were outliers in the testing dataset as well. Therefore, instead of removing all the outliers, the outliers were included in the modelling phase to ensure robustness of the developed ML models.
Missing value processing: this was performed by systematically identifying and removing instances with missing values in the dataset. Features with missing data were carefully examined, and those instances were excluded from the analysis to ensure the integrity and quality of the remaining data.
Feature engineering: the feature engineering process is presented in sub-section 3.3. The data was transformed into a format that is more suitable for ML. This involved a variety of tasks including: (i) converting categorical variables to numerical variables, and (ii) scaling numerical variables to the same scale as , where standard score of a sample x, u is the mean of the training samples and s is the standard deviation of the training samples.
Feature selection: An attempt was made to examine features that are correlated with the target variable as explained in sub-section 3.4.
The last step in the data preprocessing process was to output the pre-processed dataset. An examination of the completeness of data was performed to ensure a dataset with zero columns containing missing values. This preparation enhances the reliability of the model training process.
3.3 Feature engineering
Table 2 presents the descriptions of all the input variables including the newly created input variables after the feature engineering process. To reflect the practicality that actual project size is not known at the tendering stage, the project size variable was recoded into four categories using the tendering limits set in the Singapore BCA’s (2024b) CRS for CW01 and CW02 projects. The tendering limits for Grades A1, A2, B and C contractors were used to categorize the project data sample into extra-large, large, medium and small projects, respectively. Next, to account for the movements of the two economic factors over the six-year period, the newly created input variables capture these factors’ quarterly increasing or decreasing trends and rates of change using the respective statistics compiled by BCA (2024a, 2024d).
3.4 Feature selection
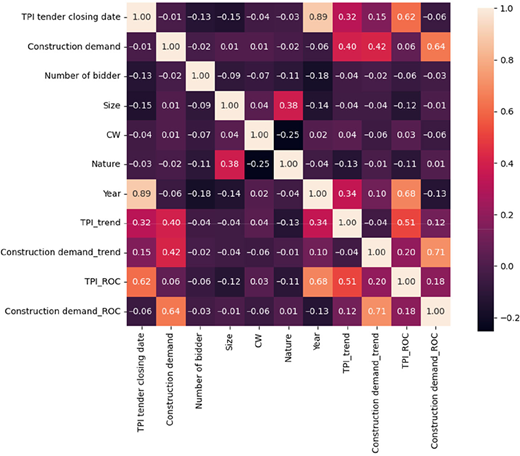
Figure 2 shows the heatmap of the Pearson correlation coefficients between each pair of features in the dataset. The overall low correlation values between the target variable and the features suggest that none of the individual features has a strong linear relationship with the number of bidders. The inherent variability in the dataset might decrease the strength of the correlations, indicating that the number of bidders is influenced by a combination of factors rather than any single feature. Therefore, ML models incorporating possible non-linear relationships are required to better understand and predict the number of bidders using the dataset.
4. Model development
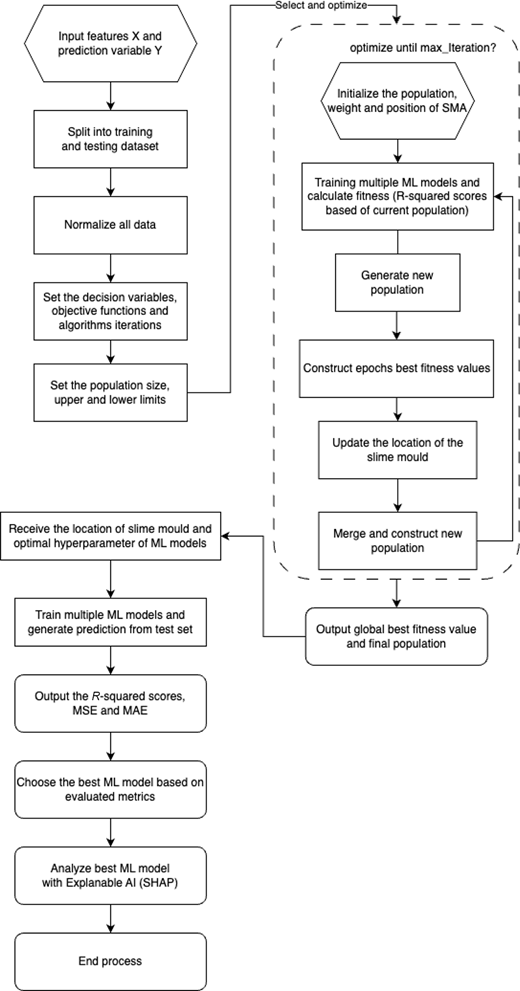
Figure 3 shows the flow chart of the model training and optimization process using datasets D1 (project characteristic variables only) and D2 (project characteristic and economic-related variables). These datasets were randomly divided into two sets, i.e. 70% of observations were used as the training set and the other 30% as the testing set. In the present study, the datasets are of moderate size and structured nature. Classical ML algorithms have been shown to perform well on tabular or structured data, which contrasts with large-sized datasets that typically require to fully leverage DL architectures. Implementing a deep neural network on a small dataset risks overfitting, since DL architectures typically involve a large number of parameters that demand significantly larger training set (Gohel et al., 2024). Thus, this study uses ML algorithms, which is consistent with the collection of prediction studies in the construction competitive bidding processes as highlighted above. The performance of the selected ML models using the testing set would be presented as the final results. The details of these steps are presented next.
4.1 Supervised machine learning models
Supervised ML methods have been increasingly applied to predictive tasks for dealing with complex problems in the construction industry context due to their ability to model complex relationships in datasets (Datta et al., 2024; Regona et al., 2023). The supervised ML methods explored in the present study are Adaptive Boosting (AdaBoost) regression, Extra Tree (ET) regression, Gradient Boosting (GB) regression, Random Forest (RF), Categorial Boosting (CatBoost) and Extreme Gradient Boosting (XGBoost). It should be noted that these supervised ML methods have been applied in varying construction management-related problems and were applied in the present study on the prediction of the number of bidders as justified below.
4.1.1 Adaptive boosting regression (AdaBoost).
AdaBoost regression is an ensemble technique that combines multiple weak learners [typically decision trees (De Ville, 2013)] to create a strong learner (Schapire, 2013). It adjusts the weights of incorrectly predicted instances so that subsequent learners focus more on difficult cases. In the context of predicting the number of bidders, AdaBoost could incrementally improve prediction accuracy by focusing on projects where the initial predictions of the number of bidders were incorrect.
4.1.2 Extra tree regression.
ET regression, short for extremely randomized trees regression, is an ensemble learning technique that constructs a multitude of decision trees at training time (Geurts et al., 2006). This method is particularly effective for regression tasks due to its ability to model complex and non-linear relationships. In the context of construction bidding, the number of bidders can be influenced by various factors such as project size, type and nature of work. ET could capture these intricate relationships to predict the number of bidders with higher accuracy.
4.1.3 Gradient boosting regression.
GB regression builds an additive model in a forward stage-wise fashion, allowing for the optimization of arbitrary differentiable loss functions (Natekin and Knoll, 2013). It is particularly powerful for handling non-linear data dependencies through its ensemble of weak prediction models, usually decision trees (De Ville, 2013). For predicting the number of bidders, GB can leverage its sequential correction of predecessors’ errors to fine-tune predictions.
4.1.4 Random Forest.
RF in Segal (2004) is an ensemble learning method that creates a forest of decision trees, usually trained with the bagging method (Breiman, 1996). Each tree in the forest is built from a sample drawn with replacement from the training set. For prediction, the mode of the predictions from all trees is taken. This method is highly effective in reducing overfitting and is robust against outliers and non-linear data. In the context of the number of bidders prediction, RF could handle the variability in construction projects effectively, providing reliable and interpretable results.
4.1.5 Categorical boosting.
CatBoost is an algorithm for GB on decision trees, designed to handle categorical variables with minimal preprocessing (Prokhorenkova et al., 2018). It provides a robust solution to the common issue of categorical feature handling in ML. Given that construction projects often involve categorical variables (e.g. type and nature of work), CatBoost could be particularly good at predicting the number of bidders by efficiently processing such data.
4.1.6 Extreme gradient boosting.
XGBoost is an optimized distributed GB library designed to be highly efficient, flexible and portable (Chen and Guestrin, 2016). It implements ML algorithms under the GB framework. XGBoost provides a parallel tree boosting (also known as GB Decision Trees, GB Machines) that solves many data science problems in a fast and accurate way. For the number of bidders prediction, XGBoost could handle sparse data and scale efficiently for large datasets.
4.2 Machine learning models training and hyperparameter fine-tuning with slime mould algorithm
The slime mould algorithm (SMA), introduced by Li et al. (2020) models the foraging behaviour and adaptations of the organism Physarum polycephalum. The algorithm uses weights to represent the positive and negative feedback mechanisms observed in slime mould foraging, generating three distinct morphologies. As a eukaryotic organism adapted to cool, humid environments, slime mould primarily feeds on Plasmodium. During feeding, the organism searches for food that surrounds it, and secretes digestive enzymes. Its migration patterns involve a sector-shaped leading edge and an interconnected network of veins enabling cytoplasmic flow. The SMA draws inspiration from this ability to form efficient networks connecting multiple food sources.
Slime mould approaching a food source induces oscillations that propagate through its venous network, increasing cytoplasmic flow. This flow expands vein diameter, while a decrease in flow results in constriction. Thus, food concentration reinforces specific paths for optimal nutrient acquisition. This feedback system allows the slime mould to establish a superior route connecting food sources. Notably, its unique biology enables simultaneous utilization of multiple food sources. Upon encountering a superior source, the organism can partition its biomass for optimal resource exploitation. Conversely, the slime mould abandons areas with lower food density for exploration.
In the present study, the SMA for hyperparameter optimization was chosen instead of exhaustive grid search method due to its unique advantages and robust performance characteristics. While exhaustive grid search is a straightforward and commonly used method for hyperparameter tuning, it comes with significant computational costs, especially as the number of hyperparameters and their possible values increase. In high-dimensional spaces, the number of potential combinations grows exponentially, making grid search computationally expensive and time-consuming (Zhou et al., 2024). SMA, being a metaheuristic optimization technique, is designed to efficiently explore the search space without the need to evaluate every possible combination of hyperparameters. In contrast, grid search method tends to explore the search space exhaustively, which can lead to inefficiencies, especially when many combinations result in poor performance (Yu and Zhu, 2020). On the other hand, SMA is inspired by the foraging behaviour of slime moulds, which allows it to balance exploration and exploitation effectively. This balance is crucial for navigating the complex and high-dimensional search space of hyperparameter tuning (Gharehchopogh et al., 2023). Finally, the grid search method evaluates hyperparameters at predefined intervals, which may miss the optimal combination if it lies between these grid points. This method lacks the flexibility to adaptively focus on promising regions of the search space (Yu and Zhu, 2020). Contrastingly, SMA is inherently adaptive and can dynamically adjust its search strategy based on the performance of the current solutions, which allows to focus more computational resources on the most promising areas of the search space, increasing the likelihood of finding better hyperparameter settings. Empirical benchmarks have demonstrated that SMA competes favourably with other meta-heuristic algorithms in various optimization tasks (Arrieta et al., 2020).
4.2.1 Hyperparameters optimization method based on slime mould algorithm.
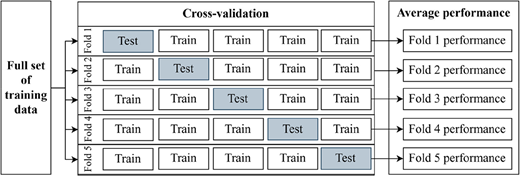
The ML hyperparameter optimization problem was framed as a single-objective optimization task, with the optimization of key ML hyperparameters conducted using the SMA. To prevent overfitting and ensure the robustness of the model, a five-fold cross-validation method was used during the optimization process. This approach divided the training data into five subsets, where the model was trained on four subsets and validated on the remaining one, which is shown in Figure 4. This process was repeated five times, with each subset serving as the validation set once. The final model was then evaluated on a separate testing dataset that was not used during the training or optimization phases, providing an unbiased estimate of the model’s generalization performance. The SMA was run for 500 epochs within this cross-validation framework to thoroughly explore the hyperparameter space and identify the best combination of parameters that maximize the model’s performance. The pop size and probability thresholds were chosen based on Li et al. (2020). The evaluated hyperparameter range and selected hyperparameter values for each ML model are presented in Appendices 1 and 2, respectively.
4.3 Linear regression as a baseline model
To assess the predictive performance of ML models, linear regression (LR) was used a baseline model. A general model of LR is as follows:
where Y is the estimated number of bidders, and X1, X2,…, Xp are the input features, β0, β1, β2,…,βp are parameters to be estimated using the least squares criterion and ε is an error term with a random normal distribution. After the parameters β0, β1, β2,…,βp are known, the LR model could be established to predict the number of bidders.
4.4 Model evaluation metrics
Three common predictive performance measures were adopted to evaluate the accuracy of the different algorithms. This refers to the magnitude of the differences between an individual measurement and the true value and is computed by mean absolute error (MAE), root mean square error (RMSE) and R-square score.
MAE:
RMSE:
Coefficients of determination (R-squared):
where: is a set of predictions for a set of test instances d1,…, dn; is mean of the target value; y1,…, yn is the set of target value and n is the number of samples.
A lower MAE score signifies a superior predictive model, as it demonstrates that the predictions made by a model are closer to the actual observations. In contrast to MAE, the RMSE considers both the size and direction of the prediction errors, providing a measure of the errors’ dispersion. Due to the squaring of the prediction errors, RMSE values tend to exceed MAE values, especially with larger sample sizes and error magnitudes. Furthermore, the R-squared (R2) metric measures the squared correlation between the observed and predicted values, indicating how much of the variance in the outcome variable is explained by the independent variable. In essence, R-squared serves as a measure of how well the data fits the regression model.
4.5 Post hoc approaches: explaining machine learning model
The majority of currently applied ML models often achieve impressive results in regression and classification problems in very different application areas. Unfortunately, most of these complex networks work as black-box algorithms such that the user is only provided with the prediction or decision of the model, but with none or very limited information on how these results were obtained. However, the benefit of ML models will be much higher for the data analysts and the experts in the application domain if they are provided with additional information about the prediction process.
Post hoc approaches comprise interpretability and explainability for black-box models for which explanations are sought to describe particular aspects of the considered model (Arrieta et al., 2020). For example, feature attribution methods relate the model output to a small number of numeric or semantic input features (Chen et al., 2022). Lundberg and Lee (2017) introduced SHapley Additive exPlanations (SHAP), which can explain a model in whole or instance wise. The core concept of SHAP is the game theory fundamentals to explain and interpret the ML models’ output. The Tree-SHAP in Lundberg et al. (2020) was used in the present study that uses following equation (5) to compute the SHAP values:
where f denotes the explanation model, N is the maximum size of coalition and ϕ ∈ R denote the feature attribution. A matrix of SHAP values is passing to the bar plot function, then generates a global feature importance plot by averaging the absolute SHAP values for each feature across all samples. This provides a clear ranking of features based on their overall impact on the model’s predictions, with higher mean absolute SHAP values indicating more influential features, and vice versa. A corresponding bar plot effectively highlights which features are most critical to the model’s decision-making process. Equations (6) and (7) are used to calculate feature attribution:
where:
The term S denotes a subset of input features and x is a vector of feature values of instance (instance which needs to be interpreted). Shapley value is obtained through a value function (gx). p is the number of features. E[g(x)|xK] expresses the expected value of the function on subset S.
5. Results
5.1 Model evaluation and comparison
The performance of the LR and six ML models using datasets D1 and D2 for the testing set is summarized in Table 3. With reference to the three model evaluation metrics, all ML models’ predictive performance has improved with the inclusion of economic features in dataset D2. This is clearly demonstrated by the generally lower MAE and RMSE error metrics across all ML models for dataset D2. Consistently, higher R2 values were recorded across all ML models, and more specifically R2 values for D2 are at least approximately 60% higher than D1. In contrast, LR models for both D1 and D2 have not recorded noticeable improvement across all three model evaluation metrics. It should also be noted that the two LR models recorded the lowest R2 values along with the highest error metrics compared to all ML models. Overall, the model evaluation metrics provide strong evidence of higher predictive performance for ML models than the LR model for both datasets.
When comparing the predictive performance of the six ML models using D2, the model evaluation metrics show that XGBoost is generally the best predictive performance with MAE and RMSE error metrics of 4.543 and 6.021, respectively. While it is noted that XGBoost’s MAE is marginally higher than ET (4.539), its RMSE and R2 value of 0.168 rank top among all ML models. This is followed by ET, GB and RF of comparable predictive performance, suggesting that these four ML models have the potential of predicting the number of bidders in construction competitive bidding in future modelling attempts.
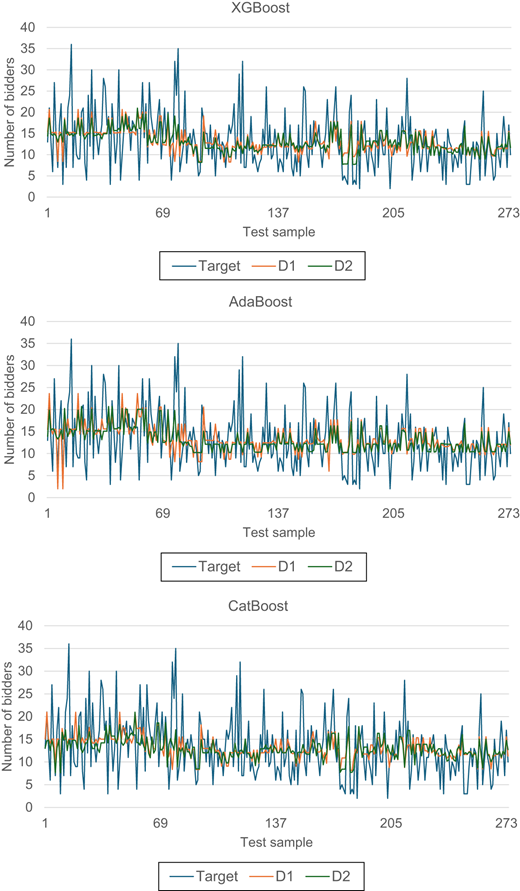
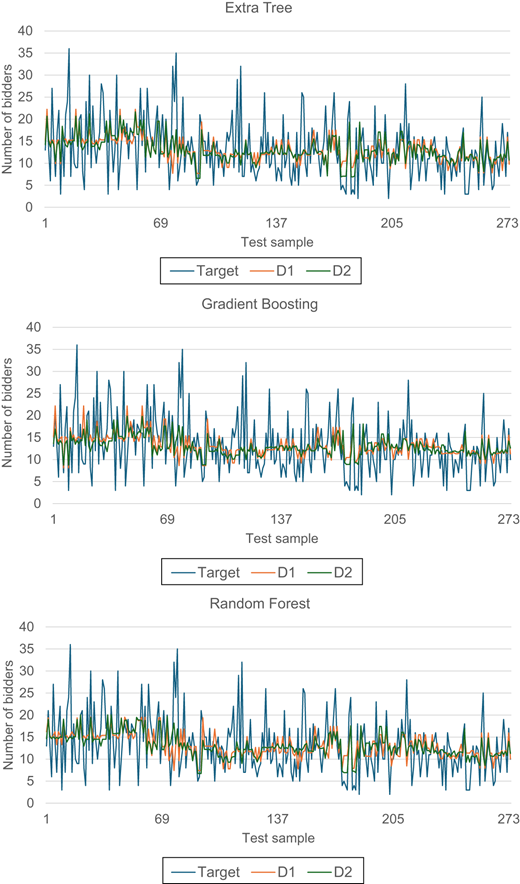
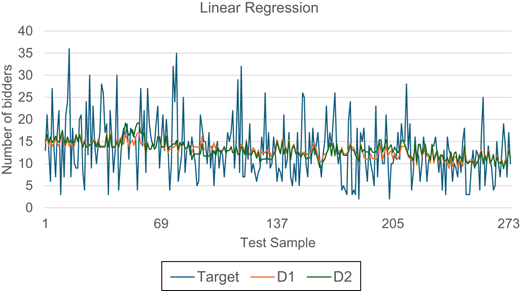
Next, to further examine the models’ predictive performance, Figure 5 shows the prediction and target plots of LR and ML models using the testing set. Each individual plot compares the performance of the respective models using D1 and D2 datasets against the target line (i.e. the number of bidders on the y-axis). Generally, the D1 (i.e. the orange) and D2 (i.e. the green) prediction lines of better performing ML models (i.e. XGBoost, ET, GB and RF) are able to capture the general trend of number of bidders in the testing set, despite of discrepancies in predicting some cases of considerably higher or lower number of bidders (i.e. the observed peaks and troughs in the blue target lines). These spikes are captured to some extent by all ML models, though there are instances where the predictions do not reach the actual peaks. This might indicate that certain influential factors driving the peaks are not fully captured by the models. Also, there are less variabilities in predictions between D1 and D2 for these ML models as the prediction lines tend to stay closer and move in the same direction. Indeed, for the best model XGBoost using D2 (i.e. the green line), it is noted that the model has captured many of the observed peaks and troughs in the target line. In contrast, there are more fluctuations and/or irregularities in both D1 and D2 predictions for other ML models. For example, in AdaBoost, there are considerably discrepancies in predictions in which model using D1 appears to outperform D2 for the first 100 test sample. Similarly, in CatBoost, both models using D1 and D2 have consistently underpredicted the peaks and troughs in the target line. Finally, for the LR models, the predictions for both D1 and D2 are relatively unvarying and standing between 10 and 15 bidders and, thus, failing to capture all the observed peaks and troughs in the testing set.
5.2 Best model interpretation
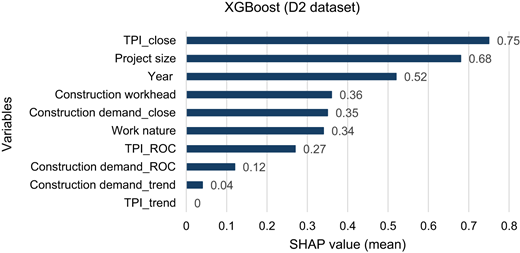
As revealed above, the XGBoost model using dataset D2 has the best predictive performance. To facilitate the examination of the importance of the input variables, Figure 6 depicts the mean absolute SHAP values of the input variables in this best optimal model. Among the top five variables, three are related to project characteristics along with two variables related to economic factors. The latter suggests that economic factors are influential in predicting the number of bidders. Among the project characteristic variables, project size is the most important variable, and this is followed by construction workhead, calendar year when the tenders closed and work nature. On the other hand, the economic-related variables when the tenders closed are of higher importance compared to their respective quarterly trends and rates of change. Both TPI and construction demand when the tenders closed are among the top five variables, signifying to some extent competing bidders had have placed greater importance on the prevailing market conditions when they decided to bid (or submit a tender), but not so for the respective quarterly trends and rates of change, especially the TPI and construction demand trends are at the bottom of the bar plot.
6. Discussion
Being a pioneering work that explores the application of ML models on predicting the number of bidders in construction competitive bidding, its aim is not to train a perfect ML model but, on the contrary, to explore the potential of ML models in this prediction problem. In achieving this in the realm of construction bidding models that have been mainly developed using statistical methods, LR models were developed and served as a baseline in evaluating the predictive performance of six ML models. The results clearly show that the ML models outperform the LR models regardless of dataset choice, in which the predictive performance of the LR models are rather similar between datasets D1 and D2. Contrastingly, there are notably improvements in ML models’ predictive performance metric in terms of R2 for D2 dataset that includes both project characteristics and economic factors. These improvements seemingly indicating the need of inclusion of economic factors in this prediction problem, providing supporting evidence of the association detected between market conditions and number of competing bidders in the literature (e.g. De Neufville et al., 1977; Ngai et al., 2002; Skitmore, 1981). However, it is noted that the R2 values across all ML models using D2 are relatively low, ranging between 0.126 and 0.168. On the one hand, it is indeed inconclusive to determine whether these values are neither good nor bad given the significance of complexity involved in the construction bidding decision-making context. On the other hand, these R2 values, along with the recorded MAE and RMSE error metrics, indicate the challenges in this prediction problem and offer insights for future modelling attempts. Firstly, a key message from these error metrics is that the presence of background noise in the prediction of number of bidders since there are many possible variables affecting contractors’ decision to bid, which in turn determine the number of competing bidders in tenders (Ahmed et al., 2024; Oo et al., 2023). The background noise can largely be explained by the fact that there are significant heterogeneities across individual contractors’ who respond differently in terms of both their (i) intrinsic bid/no-bid preferences, and (ii) responses towards a set of factors affecting their decision to bid (Oo et al., 2007a, 2008a, 2008b). These heterogeneities are driven by individual contractors’ project selection objectives which may be classified into monetary, non-monetary and marketing-related objectives at the time of bidding (Skitmore, 1989). Thus, future modelling attempts could consider capturing the heterogeneities across individual contractors by considering individual firm characteristics including their current workload, need for work and past bidding success.
Secondly, there exists outliers or extremities in the dataset, which could also be partly explained by the notion of bidders’ heterogeneity, in which some projects would attract more (or less) or extremely high (or low) number of bidders. Indeed, some past studies have found that the number of bidders is different relative to project size and type, location and client (Al-Arjani, 2002; Drew et al., 2001), and a possible refinement that aimed at better prediction in previous studies using statistical methods was to focus on projects of homogeneous nature (identical or similar project type, client and location), and used project size as a proxy of the number of bidders (Ballesteros-Pérez and Skitmore, 2016; Ballesteros-Pérez et al., 2016). However, it was preferable not to remove the outliers in the present study in enabling a full and initial exploratory strategy using a rich collection of projects of varying size, construction workhead and work nature, noting that project location variable is not applicable in the present study given the small geographical size of Singapore. In this way, this exploratory study would provide an insight into the potential of different ML models in predicting number of bidders. Thirdly, the model evaluation metrics also indicates that some influencing variables have not been captured in the available dataset in this exploratory study, suggesting the need for future work to refine the prediction process. In addition to the individual firm characteristic variables as suggested above, other influential project- and economic-related variables could potentially result in improved predictive performance in future modelling attempts.
Next, the performance differences between XGBoost (i.e. the best performing model) and other ML models using D2 can be explained by several model-specific characteristics and handling of data complexities. XGBoost outperforms due to its advanced regularization techniques, efficient parallelized tree boosting, which collectively prevent overfitting and enhance predictive accuracy (Kedam et al., 2024). Also, for the other three better performing ML models, namely, ET, GB and RF often show robust performance due to their ensemble nature but can lack the fine-tuned regularization of XGBoost, leading to potential overfitting in high-dimensional data (Belkin et al., 2018). ET, while providing efficient and fast training through randomized feature selection and threshold splits, often lacks the fine-tuning and boosting mechanism of XGBoost, leading to lower predictive accuracy (Belkin et al., 2018). GB has similar principles with XGBoost but typically lacks the same level of computational efficiency and scalability (Bentéjac et al., 2021). Finally, RF, with its ensemble of decision trees, offers good generalization but may underperform relative to XGBoost due to its inability to capture complex interactions as effectively without boosting (Bentéjac et al., 2021). To avoid overfitting, the present study evaluated the final ML models on an unseen testing set that was not used during the training or optimization phase. These strategies ensured balanced model complexity and generalizability, particularly in more sophisticated models like XGBoost and GB, while maintaining a comprehensive comparison framework.
In terms of the importance of input variables in explaining the ML models’ predictive performance, the SHAP value results focus on the best performing XGBoost model using dataset D2. It is not surprising that project size is the most important variable, which has been used as a proxy of number of bidders in the literature as highlighted above. This is because project size reflects the project risks and complexities, and it is a major determinant of the number of contractors who are capable to undertake a particular project with required capital and management skills (Hillebrandt, 2000). There is also empirical evidence that contractors have a preferred value range for either smaller or larger contracts in their decision to bid (Drew and Skitmore, 1992; Flanagan, 1982; Oo et al., 2008a). According to Odusote and Fellows (1992), contractors would try to avoid competing for projects that are too large and likely to stretch their available resources including cash flow, and projects that are beyond their experience range and normal geographical area of operation. This can be explained since these projects are associated with greater inherent project risks. Nonetheless, apart from the resource constraints and contractors’ preferred value range, there is an optimum size of contract that a contractor is allowed to bid for as determined by the tendering limits set by construction clients, especially from the public sector agencies. The latter is applicable to the current study, in which the tendering limits set by the Singapore BCA (2024b) were adopted in the feature engineering to define the project size. Next, the other important insight offered by the SHAP values is that the economic-related variables also topped the list of important variables, further signifying the need for and importance of considering economic-related variables in future attempts on predicting number of bidders. Although inconclusive, the SHAP values seemingly highlight the importance of prevailing TPI and construction demand, which reflect the market conditions, in predicting the number of bidders. Contractors were more selective in their decision to bid if there were more contract opportunities (in times of high demand), i.e. there is an inverse relationship between the number of competing bidders and number of projects available for tender or level of construction demand (de Neufville et al., 1977; Oo et al., 2008a; Soo and Oo, 2014). Accordingly, these studies reported higher number of bids received in times of recession of low demand. Indeed, the importance of market conditions in modelling bidders’ bidding behaviour has been well evidenced in the literature (e.g. Runeson and Skitmore, 1999; Oo et al., 2007a, 2007b, 2008a). However, unfortunately, a comprehensive theoretical framework on construction competitive bidding is absent in the literature despite the fact that the key assumptions in Friedman’s (1956) bidding theory have been challenged in the literature (Runeson and Skitmore, 1999; Skitmore et al., 2006). Such a situation has posted challenges for researchers in identifying and selecting the relevant variables in their modelling attempts.
7. Research implications
The findings from this exploratory study clearly have implications for future works in predicting number of bidders in construction competitive bidding. In terms of theoretical implications, the findings show that there is a need to consider both the project characteristics and economic-related variables reflecting prevailing market conditions in this prediction problem. Given that there is no definite measure of prevailing market conditions in construction (Ngai et al., 2002), future works could consider other economic-related variables such as construction demand forecast, number of tenders available for bidding, material price indices and demand and prices of basic construction materials. In addition, individual firm characteristic variables should be considered in future modelling attempts. Also, it would be necessary to consider other influential factors affecting the number of bidders (a resultant of contractors’ decision to bid decision-making process) including but not limited to: project payment terms and client-related variables which have been revealed as important in Oo et al.’s (2023) meta-analysis.
Turning to methodological implications, the findings suggest that there is a potentiality of using ML models in predicting number of bidders, which has been shown to outperform LR statistical model for the dataset in the present study. Although inconclusive, this exploratory modelling attempt reveals that XGBoost, ET, GB and RF algorithms could be the candidate models for future modelling attempts. The possible refinements in the modelling process should include other influential factors as suggested above and use smaller and yet complex datasets of pooled tenders with similar characteristics that reduce intrinsic variability of datasets. Alternatively, future models could leverage large-sized datasets along with a more comprehensive set of influential factors, which might help strengthen model performance. Also, since the ML models seem to smooth out the peaks and troughs to some extent, it is important to consider whether capturing these extremities is crucial for the decision-making context and, if so, to focus on improving the models’ sensitivity to such variations. However, while AI’s potential in the construction competitive bidding context is considerable, it is not without constraints including data accessibility and overfitting risks. Datasets in construction domain often suffer from fragmentation and proprietary restrictions, limiting both size and quality. Moreover, models could be overfitting, capturing noise rather than reliable patterns, especially when trained on inadequate or non-representative data. Above all, this exploratory study provides a fresh outlook of predicting the number of bidders using ML algorithms, contrasting to previous modelling attempts using statistical and mathematical approaches.
8. Conclusions
Forecasting the number of bidders in upcoming tenders has important managerial implications for both construction clients and contractors, facilitating informed decision-making in the construction services procurement process. However, a stagnation of research efforts on this prediction problem is observed with only a handful of studies over the past decade. Moreover, the focus of previous studies was mainly on statistical distribution of the number of bidders in which a satisfactory solution was never reached. These form the point of departure of this present study in exploring the potentiality of using ML models in predicting the number of bidders, offering a new perspective to this prediction problem. The findings show that ML models’ predictive performance outperforms the linear regression model (i.e. the baseline model), and that the best performing model is the XGBoost algorithm. Next, in terms of the importance of predictor variables, the results suggest that there is a need for and importance of considering economic-related variables for a better prediction. Project size, work nature (new or alteration/upgrading) and construction workhead (general building or civil engineering) are all important variables in the best performing ML model. These exploratory findings clearly have implications from the theoretical and methodological perspectives and offer insights for future modelling attempts.
Regarding limitations, as a pioneering study that explores the application of ML algorithms on predicting the number of bidders, the developed ML models are of exploratory nature. While there is no perfect model being discovered, this study sets a good foundation for future modelling attempts. Indeed, much additional theorizing and many more empirical investigations are needed, and this will take many more years to address this prediction problem successfully and of practical value in the industry. It is hoped that the present study can foster future modelling attempts including exploring advanced ML algorithms that combine multiple prediction models to leverage their diverse strengths and improve the overall prediction accuracy. Next, the other limitation is the use of a single bidding dataset from Singapore since the construction procurement practices vary across countries, which embedded in specific institutional contexts and policies. This prompts a future research avenue using data from multiple regions or countries towards generalizable models, and to investigate regional variations in degree of competition in competitive bidding. The variations may require the need to consider features that are specific to local institutional contexts. Nonetheless, future work could adapt the feature sets in the present study as a starting point of model development and calibrate the models to local institutional contexts or construction contracting business environments. Conducting comparative studies with smaller or more diverse data sources from multiple regions would help validate present findings, underscore the flexibility of the modelling approach and highlight region-specific adjustments that might be needed. Given that reliable historical data is critical for prediction accuracy, future modelling attempts could include construction client-related factors and other influential factors affecting the number of bidders in competitive bidding. It is also possible to analyze project descriptions or tender documents using NLP techniques to extract relevant features that could influence the number of bidders.
Data availability
Some or all data, models or code used during the study were provided by a third party. Direct requests for these materials may be made to the provider as indicated in the Acknowledgements.
The authors are grateful to the Singapore Ministry of Finance for their consent of using the procurement opportunities information from the GeBIZ website. Special thanks to Ms. Yixi Zhang for performing the data collection process.