One question we are frequently asked is, “how do you evaluate your online teachers when you don’t actually observe them in a physical setting?” The Mesa Distance Learning Program has wrestled with this issue for several years and has tried different approaches that would improve skills for teaching online (i.e., experienced teachers mentoring new teachers, online professional growth on demand, distributing recent research and new teaching techniques). Another concern is, “how do we know, whatever we do, that it was effective and did, in fact, improve teacher performance? Where is the evidence?”
Most learning management systems can sample the interactions between the teacher and students. We can determine the amount and quality of feedback provided to students, and we can monitor and provide feedback on these and other activities on a daily or other interval basis. Over time, we worked with our staff to develop appropriate teacher expectations and to establish a score on each expectation. This could be interpreted to serve as a means to evaluate our teachers in terms of meeting our expectations. Of course, all of our teachers have to be highly qualified and certified in their subject area of expertise.
The first step was to identify the expectations needed to ensure a high customer response from our parents and teachers. We developed five topics we felt were critical to assess, and the criteria that tells us the expectation was met appears in Table 1.
Following each expectation is the criteria used to determine if the teacher met the expectation. “Falls far below the standard” means the expectation was not met. “Approaches the standard” means the standard was not met, but was close. “Meets the standard” means that the expectation was met. “Exceeds the standard” means the expectation was met at a higher level than expected.
We also surveyed each teacher to determine whether the criteria (enclosed within parenthesis) were appropriate. According to this survey, the teachers felt the standard listed as acceptable on the survey needed to be higher.
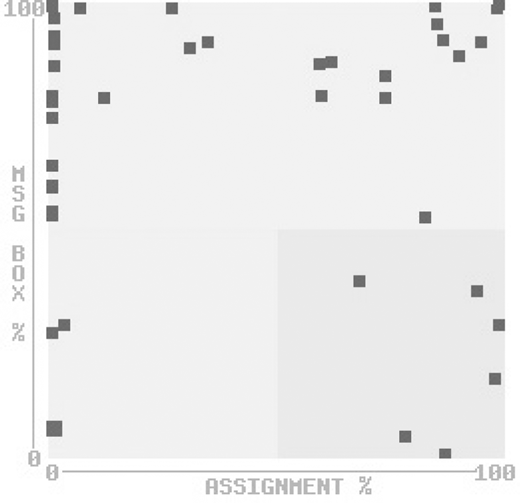
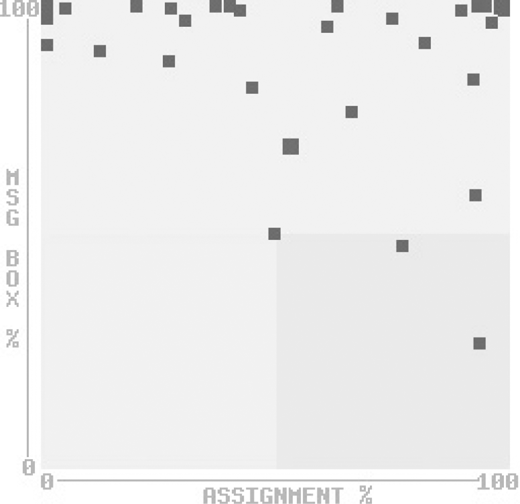
Another area we felt important to evaluate was the issue of feedback to students. It was not enough for the teacher to note “good job” or “nice work.” We wanted quality feedback that could help the student improve. In our system, feedback was accomplished through the message box reply or on the lesson document itself. Since the management system kept track of all feedback, we could judge which type of feedback was used electronically. However, our specialists felt a need to verify the quality by sampling teacher feedback several times per month. A scattergram was used to plot teacher feedback. A scattergram would have a green dot to indicate where that teacher was on the scattergram, whereas the blue dots represent all the teachers in a curriculum area or department, and the red dots represented all the other teachers in the program. The teacher met this standard if their green dot was in the upper half (scattergram 2). Teachers did not meet the expectation if they were in the bottom left quartile (scattergram 1).
At our annual teacher meeting, the evaluation system was explained to our teachers. All teachers were given feedback (scattergram 1) on how they met the expectation. Obviously, teachers could tell how well they were meeting the feedback expectations as compared to all other teachers in the program. It was pleasing to realize that a large percentage of our teachers were already meeting the expectation.
One month after informing our teachers about this electronic system of evaluation, and the initial individual profile provided at the meeting, we took our second look at the data. We were pleasantly surprised to note the differences. That is, scattergram 2 indicated that all the dots were in the correct quartile(s). The number of teachers meeting this expectation was 100%.
We had anticipated that some teachers would think that no action would be taken regardless of what they did or did not do. At the annual meeting, we also distributed a rubric outlining the steps that would be taken if standards were not met. The rubric is presented in Table 2.
For most teachers, the first step of the rubric was all we needed to have a highly performing staff. We’ve had to use all of the rubric steps for only one instructor. Currently, our specialists examine the individual teacher profile once a month and use the rubric if necessary. We have had significant teacher improvement in meeting our expectations without really saying much.
To determine if the process used was statistically significant, we took, for each expectation, the first score provided at the fall meeting as our beginning point (pretest). We then took the score 1 year later (posttest) to determine whether or not the gains in teacher performances were significant or not using a simple (t) test of significance. Although most of our teachers were meeting our expectations from day one, we were especially concerned about the few who were doing only enough to get by, but not really putting forth their best effort.
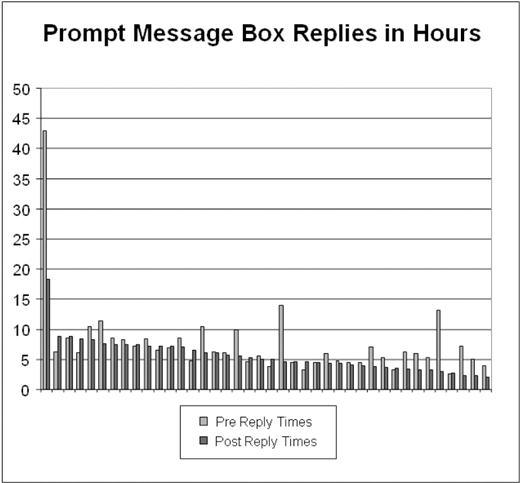
The first comparison measured differences in reply times between pre- and post-intervention. At pretest, the average reply time was 7.6 hours. At posttest, the average reply time was 5.5 hours, a difference of 2.1 hours. These reply times were found to be significantly correlated r(41) = .72, p < .01. There was a significant effect for reply times, t(40) = 2.91, p < .01, with posttest reply times being significantly lower than pretest reply times.
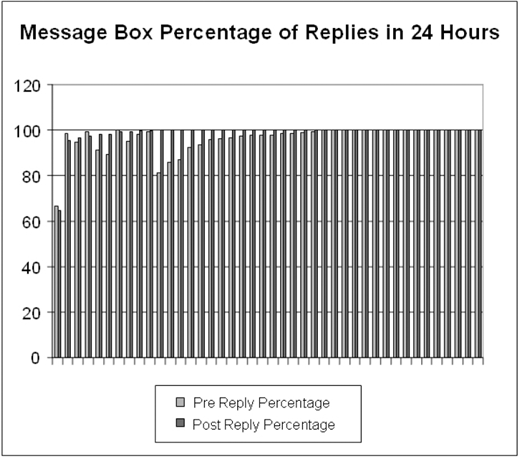
The percentage of replies in 24 hours generally increased from pretest to posttest. There was a ceiling effect exhibited in much of the data, with both pre- and post-test percentages being 100%. As such, inferential statistics were not applicable to this type of data.
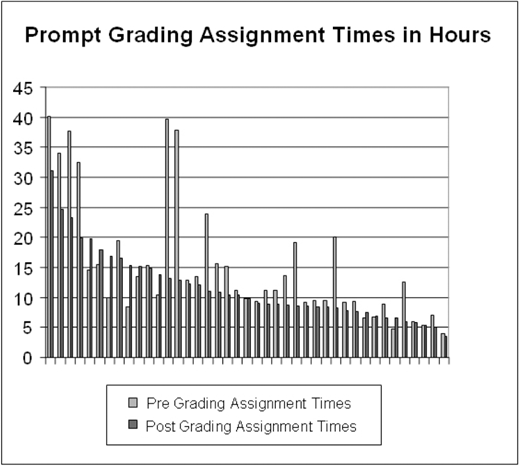
The third comparison measured differences in grading assignment times in a 48hour period between pre- and post-intervention. At pretest, the average grading time was 15.1 hours. At posttest, the average reply time was 11.4 hours, a difference of 3.7 hours. These reply times were found to be significantly correlated r(42) = .71, p < .01. There was a significant effect for grading times, t(41) = 3.36, p < .01, with post-test grading times being significantly lower than pretest grading times (see Figure 5.).
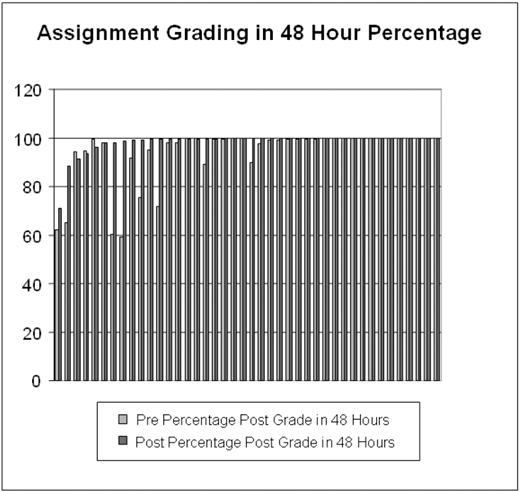
The percentage of grades posted in 48 hours generally increased from pretest to posttest. There was a ceiling effect exhibited in much of the data, with both pre- and post-test percentages being 100%. As such, inferential statistics were not applicable to this type of data (see Figure 6).
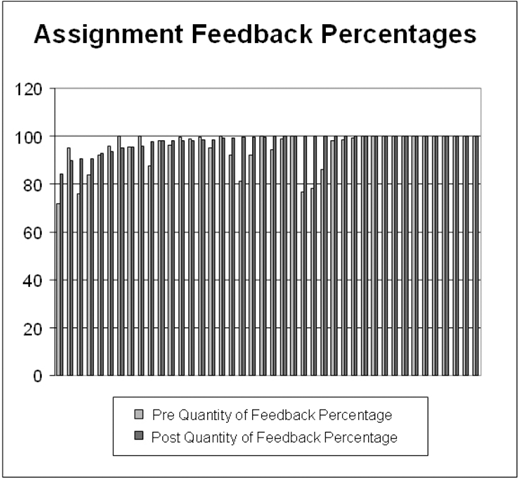
The quality of feedback percentages generally increased from pretest to posttest. There was a ceiling effect exhibited in some of the data, with both pre- and post-test percentages being 100%. Inferential statistics were not applicable to this type of data.
The response times and quality of responses improved from pretest to posttest on all five measures. Teachers responded more quickly after the intervention, and the quality of their feedback improved as well.
Of course, those teachers doing a solid job from day one continued on that path for the year. By analyzing the data for just those not meeting expectations on day one, there was a significant difference in their score gains from pre- to post-test.
The original question was, “where is the evidence that indicates that, whatever is done to evaluate online teachers, that the process was effective and statistically significant?” This study shows evidence that teacher performance was statistically changed for online teachers by providing a list of the expectations, by providing feedback to how each teacher scored on those expectations, and by providing specific consequences. We found that the process did change and improve online teacher performance.
About the author's