

This paper aims to examine the link between the corporate social responsibility (CSR) communication efforts of companies and their ability to obtain public procurement contracts.
The authors are exploiting a database with the number of public procurement contracts won by SBF 120 companies in France and a constructed CSR index over the period of 2007–2015. The authors provide estimates of the amount of public contracts won by those companies.
The results suggest a striking influence of CSR communication on the ability of firms to win contracts.
This study focused on the case of the SBF 120 companies under the French regulatory system and European directives, which are different from the obligations in North American countries. Second, our constructed CSR index may be too simplistic in nature, and its application is limited only to the French context. Third, we do not have any evidence about the efficiency of well-ranked firms in our study. CSR reporting is still considered to be a form of communication, even if formal, that can contain information that does not especially reflect reality, as the scandals of several companies have shown in recent years (e.g. Volkswagen, Eiffage, Enron).
Companies should consider Business-to-Government (B-to-G) market when investing in CSR actions.
This is one of the first empirical studies measuring the impact of CSR on the ability of companies to win public contracts.
本文擬透過研究商家到政府的市場,去探討公司的企業社會責任傳播能力與它們取得公共採購合約能力之間的關係。研究的方法是利用SBF 120間在法國的公司取得公共採購合約數目的數據庫,以及一個涵蓋2007年 至 2015年期間的構築CSR指數。研究結果顯示、在某一年,公司事先的企業社會責任的傳播,對其取得更多合約能力的影響至為驚人。
1. Introduction
Government procurement represents a business where taxpayers’ money is used to equip the country in infrastructure, goods and services that are of importance to society and the economy. It represents 12% of the growth domestic product (GDP) of the European Union [1] and 13% of the GDP of OECD countries, on average OECD (2013). These percentages embody momentous business opportunities for companies, both nationally and internationally, which entail several strategic decisions.
In the European context, since 2014, public procurement directives have referred to public procurement as a policy instrument to be used to achieve smart, sustainable and inclusive growth while ensuring the most efficient use of public funds (Directive, 2014/24/EU of the European Parliament and of the Council of 26 February 2014 on Public Procurement and Repealing Directive, 2004/18/EC, 2014). Hence, public procurers are encouraged to look after broader objectives than just low prices. In addition, Directive 2013/34/EU of the European Parliament and Council, amending Directive 2006/43/CEE with regard to companies’ annual reports, financial statements and consolidated financial reports for a certain type of firm, imposes on European Union member states, including France, the obligation to request the reporting of social responsibility variables from business entities to understand the evolution of their activities, the results and status in terms of their impact on the environment, society and economy along with traditional financial variables. Firms are thus obligated to report on their CSR activities.
Furthermore, public procurement is an important constituent of demand-oriented innovation policy that enables the development of sustainable practices (Brammer and Walker, 2011; Rolfstam, 2009, Bianchi et al., 2019). In this regard, governments try to ensure that companies can be held liable for their actions and initiatives through the introduction of regulation and regulatory frameworks. In fact, the government is a stakeholder in the Business-to-Government (henceforth, B-to-G) market on the demand side and private companies are the suppliers. For several years, the focus of the management field was primarily on the B-to-C and B-to-B markets (Flammer, 2018), but in reality, the B-to-G market is equally important and should be studied further. In recent years, research has focused on looking at CSR almost exclusively from the corporation’s side by studying topics such as whether and how CSR practices should be evaluated or what are the best CSR strategies (Lee and Carroll, 2011; McWilliams and Siegel, 2001; Sen and Bhattacharya, 2001). Nonetheless, sustainability has recently become a major goal for both private and public entities, influencing laws, policies, processes and public procurement decisions. However, other than a few exceptions, most of the CSR literature has revolved around private entities, with little attention given to the roles and responsibilities of governments and public organizations in terms of pushing toward social responsibility and sustainability (Crane et al., 2014). In the past years, researchers have focused on looking at CSR almost exclusively through the corporation’s side by studying topics such as whether and how CSR practices should be evaluated or what are the best CSR strategies (McWilliams and Siegel, 2001).
To fill this research gap, this paper explores whether there exists a link between CSR efforts made by companies and their success in public procurement. To do so, the paper tackles the following research question: “Do companies with a high CSR index win more public procurement contracts?”. This research question focuses on the study of the B-to-G market, taking into consideration not only companies but also governments and the impact of CSR on their decision-making. To answer our research question, we use two datasets that represent a collection of information about public procurement in France for 9 years, ranging from 2007 to 2015, and a constructed CSR index for the SBF 120 companies. The SBF 120 companies are based on the French stock market index that includes the 120 most actively traded stocks listed in Paris.
We posit that enlarging the scope of objectives followed by public procurers increases contractual complexities and, hence, transaction costs (Brown and Potoski, 2003; Brown et al., 2007; Saussier and Tirole, 2020). CSR efforts made by companies are a way to reduce asymmetric information with public authorities and thus constitute a signal that secures public procurers and generates a higher level of trust (Brown et al., 2007). Our empirical results show that firms’ CSR rankings are positively correlated with the number of public procurement contracts they obtained. In other words, their reporting plays a momentous role in their capacity to win public contracts. In fact, our results suggest that an increase of 1% in a company’s global CSR index at year t–1 leads to an increase in the public procurement amounts won by the company at year t by 4%–6% depending on the specifications. This result highlights that CSR efforts might convey positive results not only through B-to-B or B-to-C markets but also through the B-to-G market. They suggest that CSR improves firms’ competitiveness in the market for government procurement contracts.
We believe our paper makes several contributions to the managerial literature. First, to our knowledge, this paper is the first empirical work that scrutinizes the influence of CSR communication on companies’ ability to win public procurement contracts in France. In addition, we develop an original proposition that takes into consideration not only the willingness of companies to communicate their CSR actions but also the reaction of the demand side, that is, the government, with regard to the CSR information communicated by companies in terms of attributed contracts. In addition, this paper adds to the already vast literature regarding competitive advantage and strategies (Porter and Kramer, 2006) in a new market with an unexplored stakeholder until now, which is the government as a public buyer. Moreover, this paper sheds light on the role of the government and its profile as a “customer” with an important public duty toward its citizens.
The remainder of this paper is as follows. The literature review section tackles the notion of responsible public procurement and CSR communication and discusses the role of CSR in procurement transactions. Then, the data section presents both sets of data and the construction process of the CSR index, followed by the empirical strategy and the results sections, which present the methodology and the different results. Finally, the discussion section provides a discussion of the results of the empirical study, followed by a conclusion with the research limitations and several propositions for future research endeavors.
2. Literature review and conceptual propositions
2.1 Responsible public procurement and CSR communication
Governments in Europe have started to draft and put into place socially responsible public procurement [2], while businesses, on their end, have started to implement socially responsible purchasing practices in response to government demand. Responsible public procurement takes the form of governments that include objectives to be followed by bidders during the call for bids and contract execution. These objectives that must be taken into consideration through procurement contracts during the award process may include human rights, safety, diversity, issues related to disabled workers and environmental preservation (Carter and Jennings, 2004). Public authorities, through their procurement practices, aimed at influencing the market through contracting socially responsible companies to increase their motivation to act responsibly and develop responsible management practices (European Commission, 2011). In this sense, responsible public procurement represents a transition operated by governments toward a framework of public procurement that pushes toward introducing sustainable criteria, using public procurement as a policy instrument. In addition, public procurement has a vital role in the Europe 2020 strategy, as it is considered one of the market instruments that enable sustainable and all-inclusive levels of growth with regard to the use of public funds (Edman and Nohrstedt, 2017). As an example, in France, the presence of CSR variables and implications in public procurement decisions has been introduced by a set of criteria that represent up to 10% of the criteria for selection in the procurement process, which aims to show the firm’s actions in terms of CSR [3].
On the corporate side, firms’ CSR strategies are conveyed through a set of CSR communication materials. Studies have discussed the concerns of transparency and trust with regard to CSR communication since CSR communication and reporting have become vital for companies (Chaudhri, 2014). The drivers for CSR communication are various and broad in scope (Hanke and Stark, 2009; Bialkova and Paske, 2020), but their main objective is common and aims to achieve and protect the firm’s organizational legitimacy (Arvidsson, 2010). In this regard, a side of the existing academic literature has established the importance of effective CSR communication since it is of momentous importance for companies’ social disclosure and CSR reputation (Tata and Prasad, 2015). CSR communication in this sense acts as a means to align CSR actions to the expectations of stakeholders (Tata and Prasad, 2015), including the government, as a client. From the management perspective, the challenges of CSR communication reside in how CSR is communicated to relevant stakeholders and how their needs in terms of information are satisfied (Arvidsson, 2010). Nonetheless, CSR communication is vital because it enables audiences to be informed about a firm’s intentions in terms of CSR and helps influence the expectations of its stakeholders (Tata and Prasad, 2015). For this reason, reporting in the area of CSR has become a necessity for firms to improve and maintain their relationship with their stakeholders (Hanke and Stark, 2009), especially with governments when companies deal with governmental entities as their main clients.
2.2 The role of CSR in public procurement transactions
CSR is viewed as the set of corporate actions that aim to advance and enhance stakeholder relations and, at the same time, social welfare (McBarnet et al., 2009). In this sense, CSR has been established as a variable that decreases information asymmetries between organizations and the relevant stakeholders (King et al., 2005). In fact, CSR has been found to show the willingness of a firm to allocate a number of resources to develop a sustainable relationship with its stakeholders (Barnett, 2007); among these stakeholders, the government constitutes an important player in its role of the “client” in the B-to-G market. Thus, there are fundamental differences between the B-to-G and B-to-C or B-to-B markets since the purchasing decisions undertaken by the government are different from the decisions made by a consumer or a private business (Flammer, 2018). Although CSR is taken into consideration by the contracting process of public authorities, the academic literature has not deeply explored its underlying components and impact. Indeed, apart from the study conducted by Flammer in 2018, there is little information about firm strategies that enable them to be competitive in the B-to-G market and obtain procurement contracts, along with the role of CSR in terms of this attribution. The existing literature mainly focuses on the effect of CSR on the competitiveness of firms in the B-to-C and B-to-B markets (Flammer, 2018).
In terms of theory, the current literature focuses on the idea that CSR actions and practices enable the decrease in information asymmetries between firms and their relevant stakeholders (King et al., 2005). A firm that undertakes CSR actions and strategies signals to stakeholders the unobservable attributes that help specific companies and organizations fill institutional voids and consider society at large (Porter and Kramer, 2006). If stakeholders who value CSR place importance on unobservable attributes, they may contract at a premium with these companies that adopt CSR practices (Ramchander et al., 2012; Spence, 1974). Indeed, previous studies have documented that by engaging in CSR, firms may trigger positive responses from suppliers, for instance (King et al., 2005; Montiel et al., 2012). In the case of public procurement, firms that engage in CSR initiatives could be more likely to be considered as being “good citizens” and thus effective business partners since they may be less inclined to engage in unethical opportunistic behaviors (Flammer, 2018) and less exposed to external stakeholder activism (Kivleniece and Quelin, 2012). Moreover, companies that act as good corporate citizens both develop sustainable relationships with their stakeholders and improve their internal processes, which can signal their commitment over the long run (Hanke and Stark, 2009). This signal can also be conveyed to investors and distinguish the firm from its competitors (Su et al., 2016).
Another area of the literature posits that firms are solely driven by the strategic motive of being socially responsible, which protects them against unfavorable future regulation, thus creating a potential halo effect when deciding whether to adopt CSR or enhance existing CSR actions (Hong and Liskovich, 2015).
Overall, studies suggest that CSR communication might be viewed as a way to reduce asymmetric information and cope with transaction costs that may be high when the contract complexity is significant (Brown and Potoski, 2003; Williamson, 1985). In fact, when contracting parties cannot write an agreement that is secure enough to generate trust, they rely on signals concerning the efforts made by their partners and their good faith. Thus, we hypothesize the following:
Companies with good CSR practices are more likely to obtain public procurement contracts.
3. Data
3.1 The case of France
To test our hypotheses, we collected data on French public procurement contracts obtained by SBF 120 companies. SBF 120 (Société des Bourses Françaises) includes the 120 most traded stocks in Paris. Indeed, the SBF 120 includes all the CAC 40 (Continuous Assisted Quotation) companies added to 80 stocks listed under Euronext Paris. The choice of the SBF 120 companies is justified by the fact that publicly traded companies are considered to be first adopters and trendsetters with regard to the different types of corporate communication (Arvidsson, 2010). In addition, publicly traded companies are subject to considerable European and French regulations with regard to both environmental aspects and CSR obligations, such as the NRE [4] law for mandatory reporting and Grenelle I and II for the environment, thus pushing them to produce at least one annual report about their CSR strategies and extra financial reports.
Specifically, the data we used for this study concerned public procurement in France over the course of 9 years, between 2007 and 2015. The data were collected by a private company called Info Pro Digital [5], a digital information and service enterprise specialized in software, databases and platform leads for professionals. Among its activities in the databases category, the company collects information about the overall call for tenders in France (more than 250K calls per year) as well as award notices for the most important contracts. By matching the two datasets, we obtained information about the amount of public procurement contracts won by SBF 120 companies over the studied period (Figure 1).
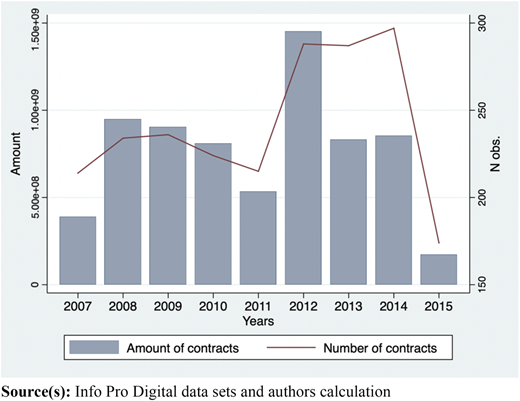
Number and amount of French public procurement contracts won by SBF 120 companies over the period 2007-2015 (limited to contracts with an amount > 10K€)
Number and amount of French public procurement contracts won by SBF 120 companies over the period 2007-2015 (limited to contracts with an amount > 10K€)
The final sample for this study consisted of 95 out of the 120 companies [6]. Those companies won, depending on the studied year, between 200 million euros and 1.5 billion euros public contracts per year, corresponding to 150–300 contracts per year with different types of public contractors (Figure 2).
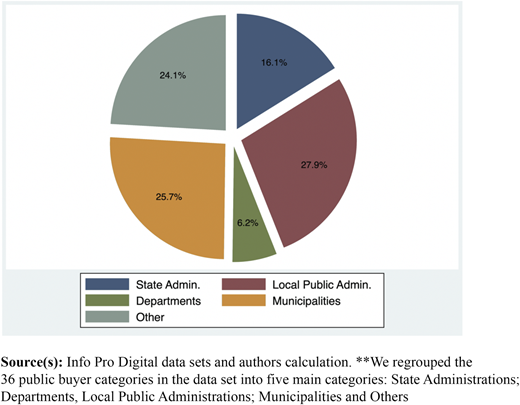
French public procurement contracts won by SBF 120 companies catégorized by public contractors over the period 2007-2015 (limited to contracts with an amount > 10K€)
French public procurement contracts won by SBF 120 companies catégorized by public contractors over the period 2007-2015 (limited to contracts with an amount > 10K€)
3.2 CSR index for the SBF 120 companies
We collected data for the CSR index construction. We decided to construct our own CSR index for several reasons. First, among well-known CSR indexes (e.g. Dow Jones Sustainability Index series [DJSI], FTSE4GOOD series, KLD Global Sustainability Index Series GSI]), there is a low level of convergence in their evaluation of the CSR profiles of the companies they include because their measures differ according to the industry and type of activities, which push researchers and practitioners to question their overall validity (Chatterji et al., 2016). Second, France is one of the European countries with a high number of regulatory obligations regarding CSR and sustainable development in terms of corporate activities, thus placing companies in a regulatory environment different from that elsewhere. Indeed, even though CSR is a widely recognized concept, there are different national patterns of CSR that have an effect on firms’ CSR adoption, practices and performance with national frameworks that impact their actions and strategies in terms of CSR (Gjølberg, 2009). Thus, creating a CSR index in relation to a regulatory framework specific to France with measures that may impact the decision of the French public buyer seemed of added value because the unit of analysis was procurement contracts operated on the French territory with the aim of providing public services for French citizens.
To construct our CSR index, data was directly extracted from the reports of the companies that follow the NRE reporting norms set by the French government. Indeed, in their annual reports or reference documents, publicly traded companies in France publish a set of CSR indicators related to the three main aspects of CSR and sustainable development, environmental, social and economic/societal aspects, answering the criteria of the NER law. Reporting in the context of CSR is of high importance to corporations since it allows them to boost their communication with their stakeholders and shareholders (Hanke and Stark, 2009). Additionally, publicly traded companies usually need financial resources and expertise to develop and implement formal CSR strategies, actions and reports (Panwar et al., 2014). In this sense, we used CSR reports and reference documents to construct our CSR index. In fact, these reports are generated by all the SBF 120 companies on an annual basis following a set of variables imposed by the current laws, making their collection and their comparison pertinent over the length of the studied period (Albertini, 2014). Moreover, these reports are considered within the management field as proper communication means in terms of conveying companies’ CSR actions and strategies (Arvidsson, 2010, Golob and Bartlett, 2007). Reports for all companies from 2007 to 2015 were collected in English with no required translation, as they are available to the public free of charge.
An example of the indicators in the reports include investments in environmental compensation actions, the evaluation of economic and territorial impact or the optimization of environmental processes indicating the multidimensional facets of CSR. Given the availability of the data for the companies in our sample, we constructed the CSR index by creating a matrix with the 57 indicators in line with the NRE law to enable us to rate the reporting of the companies and construct a rating based on whether or not they answer the overall items set by the law. In this sense, our CSR index was constructed on the basis of three main dimensions: the environmental dimension, the social dimension and the eco-societal dimension. In each block, a set of categories was developed that included several items.
First, the environmental dimension (Environmental CSR Index) with a focus on specific ecological and environmental aspects is presented in Table 1.
Environmental CSR index dimensions and sub-dimensions
| Dimension 1 | Water, Raw Materials and Energy |
| Sub-dimension 1.1 | Water resources consumption |
| Sub-dimension 1.2 | Raw materials consumption |
| Sub-dimension 1.3 | Energy consumption |
| Sub-dimension 1.4 | Measures for energy efficiency |
| Sub-dimension 1.5 | Measures for renewable energy efficiency |
| Sub-dimension 1.6 | Conditions for soils usage |
| Sub-dimension 1.7 | Air, water and soil discharges |
| Dimension 2 | Biodiversity |
| Sub-dimension 2.1 | Measures for biodiversity equilibrium |
| Sub-dimension 2.2 | Measures for environmental preservation |
| Sub-dimension 2.3 | Measures for animal species preservation |
| Sub-dimension 2.4 | Measures for plant species preservation |
| Dimension 3 | Environmental management |
| Sub-dimension 3.1 | Environmental evaluation procedures |
| Sub-dimension 3.2 | Environmental certification procedures |
| Sub-dimension 3.3 | Measures of conformity with environmental regulations |
| Sub-dimension 3.4 | Expenditure for impact prevention on the environment |
| Sub-dimension 3.5 | Internal environmental management department |
| Sub-dimension 3.6 | Environmental risk reduction means and methods |
| Sub-dimension 3.7 | Compensation measures for pollution incidents |
| Dimension 4 | Respect of agreements |
| Sub-dimension 4.1 | Amount of provisions and risk warranties for the environment |
| Sub-dimension 4.2 | Amount of indemnities after judicial decision |
| Amount of compensation actions after judicial decision | |
| Dimension 5 | Subsidiaries |
| Sub-dimension 5.1 | Elements on the environmental objectives assigned to subsidiaries |
Second, the social dimension (Social CSR Index) focuses on aspects with regard to both internal and external stakeholders, as presented in Table 2.
Social CSR index dimensions and sub-dimensions
| Dimension 1 | Employment |
| Sub-dimension 1.1 | Total employees |
| Sub-dimension 1.2 | Distinction between CDD & CDI |
| Sub-dimension 1.3 | Recruiting difficulties/issues |
| Sub-dimension 1.4 | Layoffs & layoff reasons |
| Sub-dimension 1.5 | Overtime hours |
| Sub-dimension 1.6 | Outside of company workers |
| Sub-dimension 1.7 | Plans for employee reduction |
| Sub-dimension 1.8 | Plans for job-saving |
| Sub-dimension 1.9 | Efforts for staff reclassification |
| Sub-dimension 1.10 | Re-hiring and follow-up measures |
| Sub-dimension 1.11 | Organization of work time for full-time employees |
| Sub-dimension 1.12 | Organization of work time for part-time employees |
| Sub-dimension 1.13 | Salaries and their evolution |
| Sub-dimension 1.14 | Social security costs |
| Sub-dimension 1.15 | Incentive bonus and profit-sharing |
| Dimension 2 | Professional agreements |
| Sub-dimension 2.1 | Professional relationships |
| Sub-dimension 2.2 | Summary/overview of collective agreements |
| Dimension 3 | Work conditions |
| Sub-dimension 3.1 | Absenteeism and absenteeism reasons |
| Sub-dimension 3.2 | Hygiene conditions |
| Sub-dimension 3.3 | Security conditions |
| Dimension 4 | Training |
| Sub-dimension 4.1 | Training programs |
| Dimension 5 | Equality and inclusion |
| Sub-dimension 5.1 | Professional equality between women and men |
| Sub-dimension 5.2 | Employment and inclusion of handicapped workers |
The third set of our CSR index is composed of the dimensions and subdimensions linked to aspects of the potential societal and economic impact of the company’s activities and strategies in regard to the communities within which it operates (Eco-Societal CSR Index). The complete set of the economic and societal dimensions and subdimensions is presented in Table 3.
Eco-societal CSR index dimensions and sub-dimensions
| Dimension 1 | Outsourcing |
| Sub-dimension 1.1 | Importance of outsourcing |
| Sub-dimension 1.2 | Communication with outsourcing partners |
| Sub-dimension 1.3 | Respect of outsourcing dispositions (& contracts) |
| Dimension 2 | Territorial and economic impacts |
| Sub-dimension 2.1 | Evaluation of the territorial impact of company’s activities – employment |
| Sub-dimension 2.2 | Evaluation of the territorial impact of company’s activities – local development |
| Sub-dimension 2.3 | Evaluation of the impact of subsidiaries’ activities internationally – local development |
| Dimension 3 | Relationships with stakeholders |
| Sub-dimension 3.1 | Relationships with ONGs for social inclusion |
| Sub-dimension 3.2 | Relationships with academic/educational establishments |
| Sub-dimension 3.3 | Relationships with ONGs for environmental protection |
| Sub-dimension 3.4 | Relationships with consumer associations |
| Sub-dimension 3.5 | Relationships with local resident’s associations |
| Sub-dimension 3.6 | Donations |
For each category, a number of items represent various aspects. For each dimension and each category within the dimension, we consider a set of qualitative subindicators that take values of 0 or 1. For each subindicator, we coded (1) when the item was discussed in the reporting materials of the company and (0) when the item was not discussed in the reporting materials. Once the coding process was completed, we calculated a score for each dimension per company and per year and a final total score for each company per year. These scores represent the reporting level for each dimension and each company from 2007 until 2015. The calculation of the total score enabled us to have a general panorama of the evolution of their reporting over the studied period. The value of the CSR index may fluctuate from 0 to 57 in total, as presented in total and by category (Figure 3).
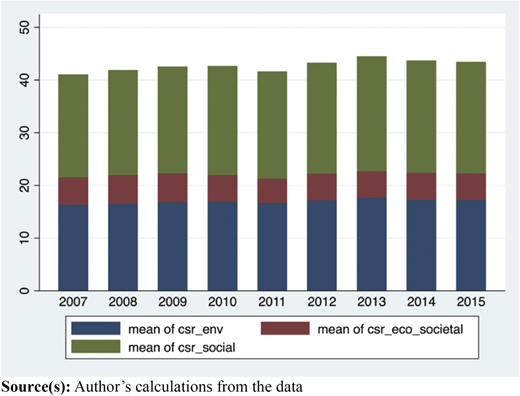
CSR Index averages (looking at three dimensions: Environment, Social and Eco-Societal) from 2007 to 2015 for SBF 120 companies. **CSR indexes are the sum of subdimensions that are present in the companies’ reporting material
CSR Index averages (looking at three dimensions: Environment, Social and Eco-Societal) from 2007 to 2015 for SBF 120 companies. **CSR indexes are the sum of subdimensions that are present in the companies’ reporting material
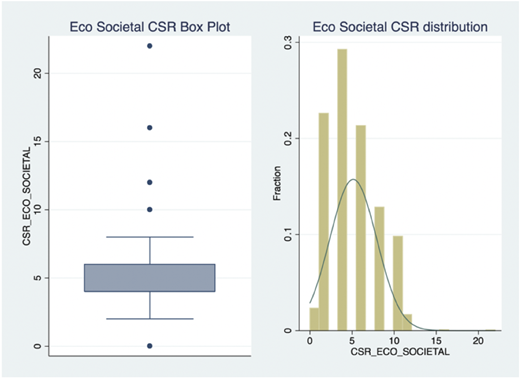
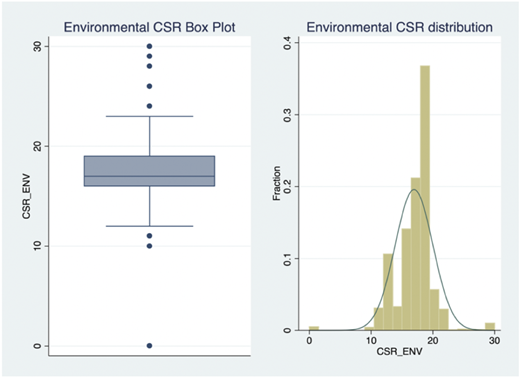
While the fluctuations show, on average, no drastic changes or extreme cases, they nonetheless show fluctuations over time within and between companies. In the following figures, we computed box plots and the distribution of our CSR variables over the studied period from 2007 to 2015. Box plots indicate the degree of dispersion (spread), and skewness indicates whether or not the data within the interquartile range (i.e. the blue box plot regroups 50% of the observations) is concentrated. Our results clearly underline that the upper and lower quartiles are less concentrated, which is well illustrated by the distributions of the CSR variables. Even though the median score of the eco-societal component of the CSR index is approximately 5 in our sample, it varies between 0 and 15, with a large fraction of our observations distributed between 1 and 11 (Figure 4).
While the median score for the environmental component of our CSR index is approximately 17 in the studied sample, it varies between 0 and 30, with a large fraction of our observations distributed between 10 and 20 (Figure 5).
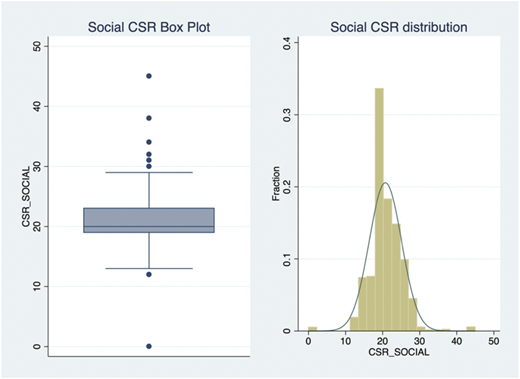
While the median score of the social components of our CSR index is approximately 20 in our sample, it varies between 0 and 30, with a large fraction of our observations distributed between 12 and 28 (Figure 6).
We expect this variance to be correlated with the amount of public procurement contracts companies were able to win between 2007 and 2015.
4. Empirical strategy
4.1 Baseline estimation
To examine whether CSR affects the allocation of procurement contracts, we estimate the following OLS regressions:
where i indexes firms; t indexes years; indexes public buyers, γi, ηa and θt are firm, public buyer and year fixed effects, respectively; Procurement is the euro amount of procurement contracts allocated to company i at time t by public buyer a; and CSRindex is the CSR index of company i at year t–1; we also run regressions distinguishing the CSR index dimensions (i.e. eco-societal, social and environmental). This gives us four versions of our model. The coefficients of interest are αs estimated in each of our models. Due to the logarithmic specification of the dependent variable, those coefficients measure the percentage change in the value of procurement contracts corresponding to an increase in CSR indexes by 1%. By using a firm’s fixed effects in our estimates, we control for a potential heterogeneity that does not vary over time between firms and that may influence firms’ capacity to win public procurement contracts. However, this capacity might also be influenced by firm characteristics that evolve over time. To capture such heterogeneity, we created a set of control variables. First, we controlled for the evolution of firms’ turnover using the variable “Turnover”, which measures the firms’ turnover each year in millions of euros. Second, we controlled for the amount of total assets and number of employees (Total Assets and NBEmployees). Last, we controlled for the experience of the company, coding for how long it has been operating (Age). By using these control variables, we expect to track the evolution of the efficiency of firms. All firms in our sample are involved in the B-to-G market with public authorities, looking for public procurement contracts and at the same time contracting with other private clients. The higher the increase in their global turnover, total asset value, number of employees and experience, the more efficient they should be in winning contracts, in general. Hence, we expect that this variable will be positively correlated with the amount of public procurement contracts they won.
In addition, we also run models that consider the interaction between CSRindex and the type of involved public buyer. We thus estimate in addition of the previous one, an extended version of our baseline model:
We distinguished local public authorities and municipalities (i.e. municipalities, association of municipalities and regions) versus other type of buyers, such as state authorities (variable LOCAL). Our aim is to determine whether public procurers differ with their capabilities and willingness to cope with increased procurement complexity associated with following broader objectives than just prices.
4.2 Endogeneity issues
The inclusion of fixed effects for firms and public buyers limits the possibility that omitted variables that we do not observe and that are time-invariant characteristics of the firm or the public buyer may drive a spurious relationship between our CSR index and the allocation of procurement contracts. However, these fixed effects do not permit to control for unobservable time-varying firms or, more importantly, public buyer characteristics. In other words, our regressions from Eqns (1) and (2) are subject to classic reverse causality issues. In order to attend to this issue, we used the lagged value of firms’ CSR indexes. To obtain a consistent estimate of α and αj, one would need an instrument for the CSR indexes, i.e. a variable that triggers exogenous change in the CSR index components or an exogenous shock that would permit a natural experiment of the influence of a change in CSR index components on the allocation of public procurement contracts. When such instrument is not available, the use of lagged explanatory variables is a common strategy in response to endogeneity concerns. This “lag identification” is particularly pertinent in the context of our study since it purports to alleviate threats to causal identification without requiring any other data than that available in the dataset [6].
4.3 Descriptive statistics
The descriptive statistics used are presented in Table 4.
Descriptive statistics
| Variable | Definition | Obs | Mean | Std. dev | Min | Max |
|---|---|---|---|---|---|---|
| Log-procurement | Logarithm of the won amount of public procurement | 1,309 | 13.40458 | 1.990129 | 9.218408 | 20.18195 |
| Log-TotalCSR | Lagged logarithm of the total CSR score | 1,309 | 3.730356 | 0.1974393 | 3.332205 | 4.430817 |
| Log – EcoSocCSR | Lagged logarithm of the economic and societal CSR score | 1,285* | 1.510449 | 0.543244 | 0.6931472 | 2.772589 |
| Log Env-CSR | Lagged logarithm of the environmental CSR score | 1,309 | 2.816905 | 0.1747508 | 2.302585 | 3.401197 |
| Log social CSR | Lagged logarithm of the social CSR score | 1,309 | 3.010819 | 0.1976853 | 2.484907 | 3.806663 |
| LOCAL | Takes value 1 if the public procurer is a local authority (municipality, association of municipalities, regional authority) | 1,309 | 0.403 | 0.4907596 | 0 | 1 |
| 2007 | Dummy that takes value 1 if the year = 2007 | 1,309 | 0.091673 | 0.2886741 | 0 | 1 |
| 2008 | Dummy that takes value 1 if the year = 2008 | 1,309 | 0.1352177 | 0.3420867 | 0 | 1 |
| 2009 | Dummy that takes value 1 if the year = 2009 | 1,309 | 0.1413293 | 0.348494 | 0 | 1 |
| 2010 | Dummy that takes value 1 if the year = 2010 | 1,309 | 0.1191749 | 0.3241181 | 0 | 1 |
| 2011 | Dummy that takes value 1 if the year = 2011 | 1,309 | 0.1245225 | 0.3303029 | 0 | 1 |
| 2012 | Dummy that takes value 1 if the year = 2012 | 1,309 | 0.1092437 | 0.3120639 | 0 | 1 |
| 2013 | Dummy that takes value 1 if the year = 2013 | 1,309 | 0.1077158 | 0.3101396 | 0 | 1 |
| 2014 | Dummy that takes value 1 if the year = 2014 | 1,309 | 0.1168831 | 0.3214037 | 0 | 1 |
| 2015 | Dummy that takes value 1 if the year = 2015 | 1,309 | 0.052712 | 0.2235433 | 0 | 1 |
| Total assets | 740 | 58495.48 | 122883.5 | 0 | 840069 | |
| NBEmployees | 740 | 112874 | 83034.24 | 0 | 427921 | |
| Turnover | 740 | 31375.5 | 37921.03 | 0 | 251725 | |
| Age | 740 | 70.21757 | 54.00629 | 0 | 346 |
Importantly, the switch from 1309/1285 observations to 740 observations is explained by the fact that among the 95 companies from the SBF 120 that constituted our sample and database, some companies did not archive their financial information for more than 6 or 8 years, which generated missing information with regard to our control variables. Furthermore, some companies among the 95 studied companies were created and then proceeded to an alliance or a merger after 2008, such that some information was missing for the previous years.
5. Empirical results
5.1 CSR index and the amount of public procurement contracts
The results of our baseline regressions without including control variables are presented in Table 5, and the results accounting for the control variables are presented in Table 6.
Results from OLS Log-Log regressions from public procurement amounts of more than 10,000 €, with lagged CSR indexes, without control variables
| (1) | (2) | (3) | (4) | |
|---|---|---|---|---|
| OLS | OLS | OLS | OLS | |
| b/se | b/se | b/se | b/se | |
| Total CSR | 4.073*** (1.310) | |||
| Eco-societal CSR | 0.667 (0.601) | |||
| Social CSR | 3.442*** (1.226) | |||
| Environmental CSR | 4.247*** (1.324) | |||
| Intercept | −6.176 (4.846) | 7.109*** (1.482) | −1.049 (3.637) | −2.959 (3.831) |
| Years F.E | Yes | Yes | Yes | Yes |
| Categories F.E. | Yes | Yes | Yes | Yes |
| Companies F.E | Yes | Yes | Yes | Yes |
| Interact Cat*CSR | Yes | Yes | Yes | Yes |
| r2 | 0.355 | 0.341 | 0.354 | 0.358 |
| N | 1309 | 1289 | 1309 | 1309 |
Note(s): Heteroskedasticity-robust standard errors are reported in parentheses, with 36 categories of public buyers. Every CSR variable is lagged. *denotes significance at 10%, ** significance at 5%, and *** significance at 1% level
Results from OLS Log-Log regressions from public procurement amounts of more than 10,000 €, with lagged CSR indexes and with control variables
| (1) | (2) | (3) | (4) | |
|---|---|---|---|---|
| OLS | OLS | OLS | OLS | |
| b/se | b/se | b/se | b/se | |
| (1.879) | ||||
| Eco-societal CSR | 0.202 (0.876) | |||
| Social CSR | 5.381*** (1.710) | |||
| Environmental CSR | 6.752*** (1.929) | |||
| Total assets | −0.078 (0.511) | −0.148 (0.516) | 0.003 (0.514) | −0.223 (0.515) |
| Age | −0.256 (0.464) | 0.199 (0.514) | −0.241 (0.470) | −0.307 (0.441) |
| Turnover | 0.327 (0.456) | 0.314 (0.479) | 0.237 (0.441) | 0.224 (0.461) |
| NBEmployees | 0.076 (0.659) | −0.019 (0.683) | −0.033 (0.646) | 0.073 (0.661) |
| Intercept | −13.459 (10.571) | 8.264 (8.271) | −5.278 (9.211) | −6.895 (9.415) |
| years F.E | Yes | Yes | Yes | Yes |
| Categories F.E. | Yes | Yes | Yes | Yes |
| Companies F.E | Yes | Yes | Yes | Yes |
| Interact Cat*CSR | Yes | Yes | Yes | Yes |
| r2 | 0.399 | 0.379 | 0.400 | 0.408 |
| N | 707 | 687 | 707 | 707 |
Note(s): Heteroskedasticity-robust standard errors are reported in parentheses, with 36 categories of public buyers. Every CSR variable is lagged. *denotes significance at 10%, ** significance at 5%, and *** significance at 1% level
The first striking empirical result is the influence of CSR indexes on the ability to win public procurement contracts for SBF 120 companies. Our results suggest that an increase of 1% in a company’s global CSR index at year t–1 leads to an increase of more than 4% in the public procurement amounts won by the company in year t (Column 1, Table 5). Interestingly, it seems that the social and environmental components of the CSR index are the most important ones in this respect, while the eco-societal component of the CSR index has no impact (see Columns 2–4, Tables 5 and 6). Moreover, when adding our control variables, it appears that they are not significant at all, and our qualitative results do not change with regard to the impact of CSR ranking on the ability of firms to win public procurement contracts. Additionally, an increase of 1% in a company’s global CSR index at year t–1 leads to an increase of more than 6% in the public procurement amounts won by the company at year t (Column 1, Table 6) when the control variables are added. Our hypothesis is thus corroborated by our results.
Interestingly, none of our control variables has a significant impact on the results. It suggests that the ability of firms to increase their business in the private sphere does not impact their ability to win public procurement contracts.
5.2 The reaction of public authorities to a firm’s CSR index evolution
To meticulously scrutinize the reaction of public authorities to the evolution of a firm’s CSR index, we examined the influence of the CSR index given the type of public buyer. We reduced the number of categories of public buyers from 36 to 2 categories, namely, local public authorities and municipalities (i.e. municipalities, association of municipalities and regions) versus other buyers, such as state authorities (LOCAL). As stated above, our aim is to determine the public procurers with the capabilities to cope with the increased procurement complexity that accompanies following broader objectives than just prices. In that sense, our variable LOCAL regroups the public procurers that may be more reluctant to engage in CSR objectives with their public procurement contracts because of the fear of high transaction costs. Such fear would translate into a procurement strategy that is simply to look at price/quality ratios when selecting offers.
We rerun our regressions showing the results of interacting terms (LOCAL*CSR), and the results are given in Table 7 (without control variables) and Table 8 (with control variables).
Results from OLS Log-Log regressions with lagged CSR indexes for two public buyer categories (local public vs state authorities) for amounts of public procurement >10,000 €, without control variables
| (1) | (2) | (3) | (4) | |
|---|---|---|---|---|
| OLS | OLS | OLS | OLS | |
| b/se | b/se | b/se | b/se | |
| LOCAL | 9.029*** (2.065) | 1.542*** (0.339) | 6.429*** (1.671) | 9.087*** (1.725) |
| Total CSR | 2.191** (0.891) | |||
| LOCAL*Total CSR | −2.214*** (0.551) | |||
| Eco-societal CSR | 0.726** (0.346) | |||
| LOCAL*Eco-societal CSR | −0.490** (0.208) | |||
| Social CSR | 1.328*** (0.670) | |||
| LOCAL*Social CSR | −1.885*** (0.553) | |||
| Environmental CSR | −1.931*** (0.950) | |||
| LOCAL*Environmental CSR | −2.961*** (0.611) | |||
| Intercept | 3.281 (3.606) | 10.274*** (1.490) | 7.497*** (2.451) | 5.993** (3.041) |
| years F.E | Yes | Yes | Yes | Yes |
| Companies F.E | Yes | Yes | Yes | Yes |
| r2 | 0.248 | 0.242 | 0.245 | 0.252 |
| N | 1309 | 1289 | 1309 | 1309 |
Note(s): Heteroskedasticity-robust standard errors are reported in parentheses. LOCAL is a dummy variable indicating when the public buyer is a local public authority (i.e. municipalities, association of municipalities and regional level authorities). Every CSR variable is lagged and logged. *denotes significance at 10%, ** significance at 5%, and *** significance at 1% level
Results from OLS Log-Log regressions with lagged CSR indexes for two public buyer categories (local public vs state authorities) for amounts of public procurement >10,000 €, without control variables
| (1) | (2) | (3) | (4) | |
|---|---|---|---|---|
| OLS | OLS | OLS | OLS | |
| b/se | b/se | b/se | b/se | |
| LOCAL | 8.443*** (2.418) | 1.457*** (0.475) | 6.269*** (1.941) | 9.466*** (2.002) |
| Total CSR | 3.411** (1.356) | |||
| LOCAL*Total CSR | −2.036*** (0.648) | |||
| Eco-societal CSR | 0.693 (0.437) | |||
| LOCAL*Eco-societal CSR | −0.335 (0.286) | |||
| Social CSR | 2.185** (0.998) | |||
| LOCAL*Social CSR | −1.798*** (0.643) | |||
| Environmental CSR | 3.184** (1.455) | |||
| LOCAL*Environmental CSR | −3.104*** (0.720) | |||
| Total assets | −0.133 (0.459) | −0.095 (0.452) | −0.091 (0.461) | −0.150 (0.460) |
| Age | −0.276 (0.540) | −0.027 (0.562) | −0.257 (0.550) | −0.248 (0.525) |
| Turnover | 0.446 (0.439) | 0.482 (0.443) | 0.378 (0.435) | 0.360 (0.440) |
| NBEmployees | 0;053 (0.631) | −0.015 (0.635) | −0.008 (0.628) | −0.002 (0.631) |
| Intercept | 3.821 (3.660) | 10.724*** (1.490) | 7.479*** (2.551) | 5.998** (3.051) |
| years F.E | Yes | Yes | Yes | Yes |
| Companies F.E | Yes | Yes | Yes | Yes |
| r2 | 0.260 | 0.246 | 0.255 | 0.267 |
| N | 707 | 687 | 707 | 707 |
Note(s): Heteroskedasticity-robust standard errors are reported in parentheses. LOCAL is a dummy variable indicating when the public buyer is a local public authority (i.e. municipalities, association of municipalities and regional level authorities). Every CSR variable is lagged and logged. *denotes significance at 10%, ** significance at 5%, and *** significance at 1% level
We find that while companies that increase their CSR score win more public contracts, this effect is less important when dealing with local public authorities (i.e. the interaction terms are negative regardless of the CSR index component that is being considered). Consequently, this result suggests that local authorities are less inclined to incorporate CSR objectives in their public procurement contracts. One valid explanation might be that they fear high transaction costs, as those objectives are difficult to contract on and can increase contractual difficulties.
6. Conclusion
In recent decades, CSR has clearly become the talk of the town among different stakeholders, and governments are no exception. Today, more than ever, public authorities are pressured to account for social and environmental aspects in their procurement decisions given the high impact that companies’ activities and actions may have on citizens’ well-being. In this regard, this study explored the existing correlation between companies with a high CSR index and public procurement contracts for 95 companies from the SBF 120 companies. The results show that, for these SBF 120 companies, given the French context, there is a positive correlation between their CSR index and their capacity to obtain public procurement contracts. This is because governments pay attention to their contracting decisions to respond to their duty in regard to citizens’ well-being, especially since public procurement uses taxpayers’ money. Our results highlight the ability of CSR to act as a nonmarket differentiation tool upon which managers can rely to gain further public procurement contracts by optimizing their CSR strategies and communication with different institutional stakeholders.
As is the case for any research endeavor, our study has limitations that can lead to future research questions. First, our study focused on the case of the SBF 120 companies under the French regulatory system and European directives, which are different from the obligations in North American countries, leading us to believe that the effect will not be the same from one national regulatory framework to another. Thus, future research can compare the SBF 120 companies with companies in countries with different regulatory frameworks. Second, our constructed CSR index may be too simplistic in nature, and its application is limited only to the French context since it is based on the NRE law. Hence, future studies can develop and explore other CSR indexes based on different standardized components of CSR or CSR regulatory obligations. Third, researchers can study further and in more depth the B-to-G market to understand the different dynamics generated by the existence of CSR in public procurement transactions and the variables that can impact the decision of public authorities in their choice of companies. Lastly, we do not have any evidence about the efficiency of well-ranked firms in our study. CSR reporting is still considered to be a form of communication, even if formal, that can contain information that does not especially reflect reality, as the scandals of several companies have shown in recent years (e.g. Volkswagen, Eiffage, Enron). Produced rankings have proven that because of the lack of convergence of their measures, they do not portray the exact CSR profile of companies (Chatterji et al., 2016). It would be therefore interesting to conduct additional studies that look at the connection between firms’ CSR activities and their ability to deliver better quality for public services.
This paper forms part of a special section “Innovation, Management, and Governance for Sustainable Growth”, guest edited by Alba Yela Aránega.
Notes
At the European level, responsible public procurement has long been encouraged, at least since the 2004 Directive, in which the EC encouraged the use of public procurement considering policy aspirations other than merely cost minimization.
For further information, see https://www.infopro-digital.com/?lang=en.
The sample is limited to 95 companies because 25 of the SBF 120 companies do not contract with the government.
A few conditions are necessary for this technique to be accurate, namely, that there exists (1) a serial correlation in the potentially endogenous explanatory variable and (2) no serial correlation among the unobserved sources of endogeneity (Bellemare et al., 2017).
