This study adapts, validates and assesses the dimensionality of the Retail Service Quality Scale (RSQS) within the context of a high-frequency, low-involvement European proximity retail chain.
An adapted 18-item RSQS questionnaire was completed by 340 customers; after screening, 311 valid responses were retained. Alternative CFA specifications were compared, including correlated first-order and bifactor models. Bifactor dimensionality indices were computed to assess whether the scale was primarily driven by a general factor. An 8-item short-form scale (RSQS-SF-8I) was developed through a bifactor-guided procedure and validated by CFA. Nomological validity was examined through the scale's association with the loyalty construct.
The bifactor results indicate that the scale is predominantly driven by a general factor, while retaining residual specificity, particularly in the Personal Interaction dimension. RSQS-SF-8I showed a very good fit and high reliability. Moreover, both the general factor of the bifactor model and the latent RSQS-SF-8I factor were strongly associated with the loyalty construct. Finally, the procedure employed for developing the short-form scale offers a replicable path for constructing short-form scales with strong psychometric properties.
This study contributes to the retail service quality literature by validating an RSQS-based framework for a European high-frequency proximity retail context and by developing a psychometrically robust short-form scale. In addition, it extends prior research by applying a bifactor specification and a formal dimensionality assessment to the analysis of retail service quality.
1. Introduction
European retail has undergone a deep transformation, in which differentiated formats coexist with large-scale retailing to satisfy heterogeneous purchasing motivations (Bonfrer et al., 2022). In this context, proximity formats have established themselves as a response to time constraints in everyday shopping, offering accessibility, speed and simplicity of experience (Volpe et al., 2017; Reimers and Clulow, 2009). Within European urban retailing, these formats generally appear as compact neighborhood outlets embedded in local retail networks. This configuration differs from several Asian and US convenience-store settings, where proximity formats are more often examined in relation to mini-supermarkets, fuel-linked convenience stores or broader service ecosystems with more heterogeneous assortments and experiential aspects (Gibson et al., 2022; Yokoyama et al., 2022). The global spread of these formats is linked to demographic and urban transformations, with the growth of smaller households and everyday consumption practices (Reimers and Clulow, 2009; Yokoyama et al., 2022). At the urban level, these broader transformations make proximity formats an integral part of everyday shopping, especially for younger consumers whose mobility patterns favor nearby outlets.
In the European context, the retail chain considered in this study represents a well-established proximity retail format operating in densely populated urban areas. The format is characterized by frequent customer visits, short shopping missions, limited basket size, extended opening hours and a service experience centered on accessibility, speed and convenience. These operational features distinguish European proximity retailing from larger grocery and supermarket formats and make it particularly suitable for investigating service quality in high-frequency, low-involvement retailing contexts.
The competitive sustainability of proximity retail formats is strongly related to service quality. Service quality supports customers' satisfaction and loyalty (Cuong and Khoi, 2019; Veloso and Sousa, 2022). In proximity retail formats, quality emerges as a trade-off between proximity, accessibility, continuity and reliability (Terblanche, 2018; Dabholkar et al., 1996; Vázquez et al., 2001; Gibson et al., 2022). Technologies can enrich the service experience, but they do not replace the fundamental features associated with the physical format (Bäckström, 2023; Zhang et al., 2022).
To measure service quality, psychometric tools are required to translate intangible constructs into assessable and comparable dimensions, thereby generating operational guidelines for management (MacKenzie et al., 2011). Among the available approaches, the bifactor model represents a valuable alternative considered in the present study (Teeluckdharry et al., 2021). Its application enables a more precise examination of construct dimensionality by separating the general effect of perceived service quality from the specific effects associated with each scale dimension (Morin et al., 2016). Recent studies highlight the model's ability to simultaneously represent overall service quality perceptions and their specific components (Chiu and Won, 2016). Bifactor modeling has increasingly been adopted as an alternative to first-order and second-order multifactorial models in factorial validation processes (Njeri et al., 2025; Rodriguez et al., 2016). It has been used to assess construct dimensionality within hierarchical structures of service quality (Ekaabi et al., 2020), to establish criteria for developing short service quality scales (Carter et al., 2023; Koğar, 2020) and to estimate reliability indices related to both general and specific service quality factors (Suzuki et al., 2025). Despite its potential, bifactor modeling is still underused in studies on service quality.
Given the inherent complexity of service quality scales, rigorous validation procedures are essential (MacKenzie et al., 2011). Moreover, lengthy questionnaires may induce respondent fatigue and increase non-response rates, thereby negatively affecting collected data quality (Jeong et al., 2023). In this context, short-form scales represent a viable solution, as they can preserve content coverage and validity while reducing cognitive load and the risk of non-response. The literature provides robust methodological guidance for scale reduction while maintaining adequate psychometric properties (Koğar, 2020; Suzuki et al., 2025).
To our knowledge, the literature still offers limited evidence on service quality frameworks specifically validated for proximity retail formats in the European context, and even more limited evidence on short-form scales specifically calibrated for high-frequency retail and micro-service experiences. Given the centrality of proximity formats in the European retail landscape, the present work addresses this gap by pursuing three main objectives:
- (1)
to identify the reference quality framework and explore its dimensionality;
- (2)
to develop and validate the related short-form scale;
- (3)
to evaluate the nomological validity of the construct.
The research questions are:
Which existing service-quality framework provides the most appropriate theoretical basis for assessing service quality in high-frequency, low-involvement European proximity retailing?
Does the identified framework maintain structural consistency?
Does the derived short-form scale retain suitable psychometric properties?
Does the quality measurement show a significant association with customers' loyalty intentions?
The work aims to make three main contributions. On a theoretical level, it aims to identify a reference framework for assessing service quality in the European high-frequency, low-involvement proximity retail context examined in this study. It also aims to propose a short-form scale based on rigorous psychometric and content criteria. Methodologically, the work aims to integrate validation, dimensionality assessment and scale reduction procedures. From a managerial point of view, the work aims to provide proximity format operators with robust and effective tools to monitor quality and link it to behavioral outcomes relevant to profitability.
The rest of the present work is organized as follows. Section 2 presents the relevant literature studies. Section 3 illustrates the methodological approach of the present work. Section 4 reports the empirical analysis and results obtained. Section 5 discusses the implications of the work results. Finally, Section 6 concludes the work.
2. Literature review
Although service quality has long been studied in retailing, the literature still does not appear to offer a fully consolidated and psychometrically established framework specifically tailored to high-frequency, low-involvement proximity retailing, considered as a distinct retail format.
Early research on service quality in retailing drew on broader generic service quality models, but the Retail Service Quality Scale (RSQS) proposed by Dabholkar et al. (1996) established the most robust and widely recognized retail-specific framework in the literature (Mehta et al., 2000). Dabholkar et al. conceptualized retail service quality through five dimensions: Physical Aspects, Reliability, Personal Interaction, Problem Solving and Policy. These dimensions remain relevant today because they refer to recurrent components of the retail service encounter. Particularly, Physical Aspects concern the tangible conditions of the outlet environment; Reliability refers to the consistency of routine service delivery; Personal Interaction captures the role of employee contact in assistance and trust formation; Problem Solving concerns the retailer's response to service issues; and Policy reflects the operating rules that affect convenience, access and payment conditions. Subsequent research, however, has shown that retail service quality is not format-neutral. In supermarket retailing, Vázquez et al. (2001) developed CALSUPER as a more format-sensitive alternative, while later studies in grocery environments suggested that the relative salience and configuration of service dimensions vary across store formats and shopping missions. More recent evidence has reinforced this format-contingent view. Goić et al. (2021), using a longitudinal grocery dataset across store formats, showed that the drivers of customer satisfaction differ systematically depending on the format considered. In the same direction, Bonfrer et al. (2022), in their systematic review of physical grocery retail formats, concluded that shopper responses and retail competition are deeply shaped by format changes. Studies closer to the proximity and convenience domain provide further, though still fragmented, evidence. Gibson et al. (2022) showed that convenience-store evaluations are embedded in a broader set of format-specific evaluative cues, thus reinforcing the need for context-sensitive conceptualization in proximity-oriented retail settings. Yokoyama et al. (2022), focusing on mini-supermarkets in urban retail markets, demonstrated that customers' retail format perceptions moderate satisfaction formation. Graciola et al. (2020) similarly showed that mini-market and supermarket formats condition the relationships among store image, perceived value and behavioral responses. At the same time, adjacent service-quality and in-store experience studies suggest that proximity-oriented retail settings increasingly require models that capture both transactional efficiency and experiential cues. Zhang et al. (2022) developed an integrated store service quality measurement scale for omni-channel retailing, while Shamim et al. (2024) proposed an S–O–R-based experiential framework for measuring in-store customer satisfaction in non-fuel retailing, a context that shares several operational similarities with compact, convenience-led formats. Additional recent evidence further highlights the importance of format-specific consumer responses in routine Fast-Moving Consumer Goods contexts, as shown by Rajaguru et al. (2024) on retail patronage across formal and informal grocery channels and by Thakur et al. (2024) on consumer engagement across kirana stores, neighborhood convenience stores, supermarkets, hypermarkets and online retailers. At the construct level, these recent studies address format specificity through different variables, including convenience-store experience, revisit intentions, store image, perceived value, customer-experience mechanisms, personalization and post–purchase convenience. Conceptually and methodologically, however, these aspects remain difficult to integrate, as many studies rely on context-specific constructs, different outcome variables and retail contexts that only indirectly represent the low-involvement proximity shopping episode considered here.
Taken together, these studies indicate that the literature offers several theoretically relevant models for grocery, mini-supermarket, convenience and neighborhood retail settings, but still provides limited evidence of a widely accepted measurement framework specifically validated for European high-frequency, low-involvement proximity retailing. In this context, the adaptation and re-specification of RSQS are not only theoretically justified but particularly valuable for the present analysis, as the scale offers a robust and authoritative retail-specific foundation, while retaining the flexibility needed to capture the distinctive features of proximity retail formats.
Beyond the differences between retail formats, the literature also indicates that customer-perceived service quality may be shaped by internal organizational conditions. Service climate, organizational service orientation, leadership and organizational culture contribute to the conditions in which frontline employees operate and interact with customers. These factors may influence daily service practices, service consistency, employee behavior and customer orientation (Schneider et al., 1998; Bowen and Schneider, 2014; Lytle et al., 1998; Hartline and Ferrell, 1996; Homburg and Pflesser, 2000). These elements, however, should be considered antecedents of customer-perceived retail service quality, distinct from the dimensions of retail service quality.
Finally, with regard to short-form scales, although retail service quality research has long relied on multidimensional instruments, recent evidence suggests that the field still lacks a broadly consolidated tradition of rigorously validated short-form scales. Contemporary scale-development research in retail and omnichannel domains is characterized by conceptual proliferation and operational heterogeneity, with many studies either retaining relatively extended instruments or introducing new context-specific measures (Hollebeek et al., 2024; Zhang et al., 2022). At the same time, the development of condensed instruments such as the 12-item version of the SafeCX framework indicates a growing recognition that parsimonious scales can offer substantial analytical and managerial value when measurement efficiency, reduced respondent burden and practical diagnostic usability become central design criteria (Rahman et al., 2026). In parallel, retail service quality research still frequently relies on adapted RSQS applications in supermarket settings, confirming that rigorously validated short forms remain comparatively limited in this domain (Musasa and Tlapana, 2023). Against this background, the use of a short-form scale in retail service quality should be interpreted as a methodologically effective response to a still unresolved measurement tension between dimensional richness and practical empirical usability.
3. Materials and methods
The research procedure comprised three phases: questionnaire design, data collection and screening and data analysis. Each phase is described in detail below.
3.1 Questionnaire design
The questionnaire was based on the RSQS instrument. In particular, RSQS was used as a retail-specific reference framework whose core domains remain suitable for contemporary outlet-service evaluation, while requiring contextual adaptation to the European proximity format examined here. As mentioned above, the original scale comprises 28 items organized into five dimensions:
Physical Aspects (PA): includes 6 items (PA1–PA6) assessing the modernity of the equipment, the visual appeal of the environment, the cleanliness of customer-accessible areas and the ease of locating products and moving around the store;
Reliability (REL): includes 5 items (REL1–REL5) assessing compliance with stated timelines and commitments, operational accuracy, product availability and the execution of error-free transactions;
Personal Interaction (PI): includes 9 items (PI1–PI9) measuring technical competence, the ability to inspire confidence, perceived security, courtesy, helpfulness, prompt service, individualized attention and professionalism;
Problem Solving (PS): includes 3 items (PS1–PS3) measuring the willingness to handle returns and errors, the interest shown in resolving customer problems and staff readiness to provide immediate and direct solutions;
Policy (POL): includes 5 items (POL1–POL5) concerning product quality, parking availability, the convenience of opening hours, the acceptance of various payment methods and the availability of loyalty or store credit cards.
The questionnaire was pre-tested on a sample of 90 respondents recruited across multiple urban retail locations belonging to the chain under consideration. The purpose of the pre-test was to verify lexical clarity, comprehension and item relevance in the context of a high-frequency, highly standardized proximity retail format. Both qualitative (i.e. participants' comments) and quantitative criteria were used. In particular, the analysis of missing values revealed an anomalous concentration of non-response on specific items, as shown in Table 1.
These items were assessed for contextual relevance and subsequently excluded from the final questionnaire. Specifically, these items referred to situations that were either irrelevant or rarely encountered in the typical purchasing experience of the context examined. For instance, items on public-area cleanliness, store layout or parking addressed aspects that were marginal, only partially applicable or absent in the format. Likewise, statements about personalized attention, transaction security or telephone courtesy were of limited applicability, given the high level of standardization and the brief nature of customer interactions. Similarly, items related to returns, complaints or store credit cards referred to practices that were rare or non-existent in this retail context. Their exclusion was intended to improve the consistency of the adapted measurement framework and align it with the operational features of the format, enabling a more reliable assessment of perceived service quality. For these reasons, all PS items and several items from the PA, PI and POL dimensions were excluded. The final questionnaire was then structured into three main sections.
Section 1 – Service quality assessment
This section included 18 items from the adapted RSQS scale used in this study. Service perceptions were assessed using a 5-point Likert scale.
Section 2 – Sociodemographic data
This section collected participants' sociodemographic characteristics, including gender, age, survey area, purchase frequency, product categories purchased and the main reason for visiting.
Section 3 – Loyalty intentions
This section included two items capturing positive Word-of-Mouth (WOM) and reuse intention. Including these two behavioral outcomes was consistent with the original RSQS instrument. The response scales followed the original instrument. Reuse intention was measured on a 7-point scale ranging from “I don't think so” to “definitely,” and WOM was measured on a 5-point scale ranging from “not at all” to “completely.”
3.2 Data collection and screening
The questionnaire developed was used to collect the data required for the empirical analysis through an on-site intercept procedure. Adult customers who were in or leaving the selected outlets were invited to complete the questionnaire voluntarily. Potential insufficient-effort responding was assessed by computing the within-participant standard deviation of item responses, with a value of zero suggesting an invariant response pattern (Dunn et al., 2018). Non-responses were handled through median imputation at the respondent level. Skewness and kurtosis were examined to assess whether the variables approximated a normal distribution (Hair et al., 2010). In addition, multivariate normality was evaluated using Mardia's test (Mardia, 1970, 1974). Finally, univariate and multivariate outliers were detected through standardized z-scores and Mahalanobis distance (p < 0.01), respectively.
3.3 Data analysis
Statistical analyses were conducted using IBM SPSS AMOS 24. A sample size of approximately 300 cases was targeted, which, for a CFA of comparable complexity, is generally regarded as adequate to support stable estimates and good model fit (MacCallum et al., 1996; Brown, 2015; Kline, 2023).
3.3.1 Confirmatory factor analysis (CFA)
CFA was estimated using maximum likelihood under the assumptions of univariate and multivariate normality and the absence of outliers, conditions that support efficient parameter estimates (Kline, 2023). Prior to the analysis, the item correlation matrix was inspected, and correlations greater than 0.85 were considered potential indicators of collinearity or redundancy (Mertler et al., 2021).
Model fit was evaluated using complementary fit indices. The chi-square statistic and the χ2/df ratio were considered. Although χ2 is sensitive to sample size, χ2/df values below 3 generally indicate good fit. Comparative Fit Index (CFI) and Tucker–Lewis Index (TLI) compare the specified model with the null model. Values above 0.95 denote excellent fit, while values above 0.90 indicate acceptable fit (Hu and Bentler, 1999). Root Mean Square Error of Approximation (RMSEA) assesses the discrepancy in approximation between the observed and model-implied covariance matrices, with values around 0.05 indicating close fit and values up to 0.08 indicating reasonable fit (Browne and Cudeck, 1993; Steiger, 1990). Akaike Information Criterion (AIC) is used for comparative purposes, with lower values indicating a better balance between fit and parsimony (Akaike, 1974). The joint interpretation of the indices follows the recommendations to avoid rigid cutoffs and to consider the modeling context under examination (Marsh et al., 2004).
Convergent validity was assessed by examining whether Composite Reliability (CR) exceeded 0.70 and Average Variance Extracted (AVE) exceeded 0.50. Discriminant validity was evaluated by verifying that latent inter-factor correlations did not exceed the 0.85 threshold (Brown, 2015) and by applying the heterotrait–monotrait ratio of correlations (HTMT), following Henseler et al. (2015). HTMT values below 0.85 were interpreted as supporting discriminant validity under the conservative criterion, whereas values below 0.90 were considered acceptable under the more liberal criterion commonly adopted for conceptually related constructs.
3.3.2 Model specification
The model specifications follow a comparative approach aimed at exploring the validity and dimensionality of RSQS in the context under consideration. Starting from the adapted RSQS, a series of alternative CFA specifications has been tested, including correlated first-order models. The aim was to identify the most parsimonious and empirically consistent structure of RSQS in the context examined. The adapted RSQS was also specified as a bifactor model, in which a general service quality factor influences all 18 items, whereas orthogonal factors capture the unique variance associated with each scale dimension. This configuration allows the decomposition of the items' common variance, separating the portion attributable to the general factor from that associated with each specific domain.
Assessment of the bifactor model's adequacy requires the global fit indices described above, while the construct's dimensionality is evaluated on the basis of specific bifactor dimensionality indices. These indices estimate the proportion of variance attributable to the general factor relative to that attributable to the specific factors (Rodriguez et al., 2016; Reise et al., 2013). The Explained Common Variance (ECV) quantifies the proportion of the common variance in the items that is attributable to the general factor, with values above 0.70 commonly interpreted as supporting predominant unidimensionality of the scale. The Percentage of Uncontaminated Correlations (PUC) assesses the proportion of item correlations that are unaffected by specific factors. PUC values above 0.70 further reinforce the hypothesis of unidimensionality. Finally, Omega Hierarchical (ωh) expresses the proportion of the total score variance that is attributable to the general factor, after partialling out the variance due to specific factors and measurement error, with ωh values greater than 0.80 interpreted as evidence of an essentially unidimensional structure. In addition, the Omega Subscale indices (ωs), which represent the proportion of variance in subscale scores that is attributable to a specific factor, after accounting for the variance explained by the general factor, can be evaluated to provide a broader perspective. The joint interpretation of these indices allows an accurate and robust analysis of the degree of essential unidimensionality or, conversely, the multidimensional nature of the construct (Reise et al., 2013).
3.3.3 Development and validation of a short-form scale
To ensure adequate coverage of the adapted RSQS, the short-form scale was developed by selecting items from each retained content domain. Item selection was guided by the best-fitting model, with the aim of maximizing empirical salience while preserving conceptual coverage. Finally, the nomological validity was evaluated by estimating the association between the latent factor of the short-form scale and the loyalty construct, by reporting the correlation coefficient and significance level (Koğar, 2020; MacKenzie et al., 2011).
4. Empirical results
4.1 Data collection and screening
Data were collected in a European country in early 2025. The outlets considered were located in major metropolitan and other urban areas. The sample consisted of 340 respondents. Because the number of customers approached was not recorded, a conventional response rate could not be computed. However, 340 questionnaires were completed and, after screening, 311 valid questionnaires were retained, corresponding to a usable questionnaire rate of 91.5%. Specifically, 20 questionnaires were excluded because they showed indications of potentially insufficient-effort responding, with an item-score standard deviation equal to zero. Univariate and multivariate outliers were also examined. The univariate screening did not lead to any additional exclusions, whereas 9 additional questionnaires were excluded because of multivariate anomalies. The final data did not reveal substantial issues related to univariate and multivariate distributional assumptions. The final dataset comprised 311 questionnaires, exceeding the targeted threshold of approximately 300 cases, and thereby supporting the robustness of the subsequent confirmatory factor analyses.
The sociodemographic characteristics of the participants are reported in Table 2. The final sample shows a marginally higher proportion of women than men. The most represented age group is 18–25 years, followed by 26–35 years, indicating a predominantly young profile. Geographically, most respondents were drawn from the main metropolitan survey areas, with the remainder distributed across other urban locations. Regarding purchasing behavior, almost half of the respondents visit stores several times a week. The most frequently purchased category is food and beverages, followed by alcohol and tobacco products. The main reasons for shopping are speed and convenience. A considerable proportion of respondents reported quick or last-minute purchases, consistent with the usage pattern typically associated with proximity retail formats. Overall, the sample profile is consistent with the usage patterns usually observed in high-frequency proximity retail settings.
Descriptive statistics were computed to provide a preliminary profile of respondents' perceptions across the adapted RSQS items. Results reported in Table 3 indicate a general tendency toward mid-to-high evaluations. In particular, the highest mean scores concern payment acceptance (POL4: M = 4.45), convenient opening hours (POL3: M = 4.42), timely service delivery (REL2: M = 4.14) and merchandise availability (REL4: M = 4.13). These indicators are directly related to the operational core of proximity retailing, where accessibility, continuity and transaction simplicity are central to the service provided. In contrast, the lowest scores concern employees' communication of service times (PI5: M = 3.14), knowledge to answer customer questions (PI1: M = 3.21), courtesy (PI8: M = 3.21) and prompt service (PI4: M = 3.25).
4.2 Confirmatory factor analysis and model specification
The specification of the empirical model involved the adapted version of RSQS comprising 18 items organized into four factors: PA, REL, PI and POL.
The preliminary analysis of the item correlation matrix showed no coefficients above the critical threshold of 0.85. This finding does not suggest problematic collinearity among the indicators. The 4-factor adapted RSQS showed a satisfactory fit to the data (Table 4).
However, discriminant validity indicated a limitation of the 4-factor specification. In addition to the latent factor correlation between PA and REL, which was 0.92 and exceeded the 0.85 threshold, discriminant validity was further assessed through the heterotrait–monotrait ratio of correlations (HTMT). As shown in Table 5, the HTMT value between PA and REL was 0.904. This value exceeded the conservative 0.85 threshold and was also slightly above the more liberal 0.90 threshold, highlighting insufficient empirical separability between PA and REL. In contrast, the remaining HTMT values were below 0.85, indicating that the discriminant-validity problem was limited to the PA–REL relationship.
This empirical overlap is theoretically plausible, since routine proximity shopping links the material organization of the store to the perceived regularity, availability and accuracy of the service. Accordingly, PA and REL were merged into a single latent factor PA + REL, while PI and POL were retained as distinct factors. The 3-factor model exhibited a marginally worse fit than the 4-factor model (Table 4). Table 6 reports the standardized and unstandardized regression weights for each item, along with their standard errors. CR and AVE values for each factor are also provided.
As shown in Table 6, several items showed standardized loadings above 0.80, indicating their strong association with their related factors. CR values exceeded the recommended threshold for all three factors. AVE values were satisfactory for PA + REL and PI, each exceeding the 0.50 threshold, whereas POL fell marginally below it. Overall, these results support the convergent validity of the 3-factor model, with only minimal concerns related to POL. In the 3-factor solution, inter-factor correlations did not exceed the 0.85 threshold, supporting the empirical separability of the retained factors. Moreover, the HTMT results (Table 5) further supported this structure, with all values below the conservative 0.85 criterion. The highest value was observed between PA + REL and POL (0.835), suggesting moderate conceptual proximity. The values for PA + REL and PI (0.722) and PI and POL (0.610) were below the conservative threshold. Accordingly, the 3-factor structure was considered empirically sound because it resolved the PA–REL discriminant-validity problem while preserving adequate separation among the retained dimensions.
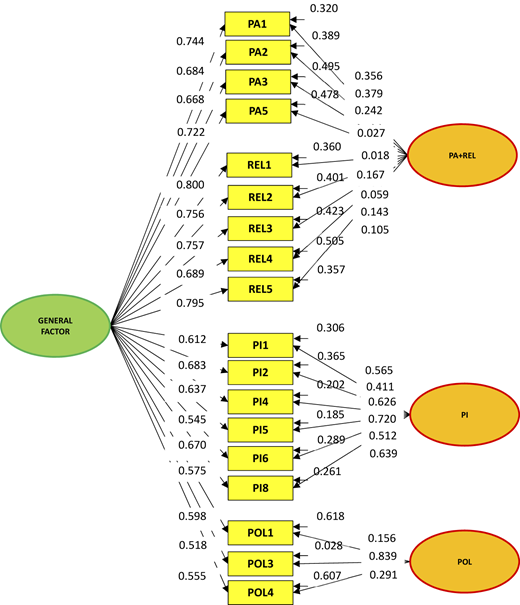
A single-factor model was also estimated, loading all items on one latent factor. This model showed very poor fit (Table 4) and was rejected. It was therefore concluded that, in the context under examination, the adapted RSQS is characterized by three dimensions, namely PA + REL, PI and POL. Since the retained correlated solution comprised exactly three first-order factors, the corresponding higher-order specification with one second-order factor was just-identified at the higher-order level and statistically equivalent to the correlated three-factor model under standard identification. For this reason, it was not treated as an additional competing model and was not used to draw separate empirical conclusions. Then, a 3-factor bifactor model was estimated, specifying a general factor loading on all 18 items of the adapted RSQS and three orthogonal specific factors corresponding to PA + REL, PI and POL. Among the estimated specifications, the bifactor model exhibited the best fit (Table 4). The χ2/df value indicated an excellent correspondence between the observed and model-implied matrices and the incremental fit indices exceeded the criteria for excellent fit. RMSEA suggested a very small approximation error. AIC further favored the bifactor model, indicating a better balance between fit and parsimony relative to the alternative specifications. Figure 1 shows the 3-factor bifactor model.
4.3 Bifactor dimensionality and reliability indices
Bifactor dimensionality and reliability indices, including ECV, PUC, ωh, ωs and I-ECV, were computed from the standardized factor loadings and residual variances of the bifactor solution (Figure 1). ECV was 0.713, and ωh was 0.865, indicating that a substantial proportion of the common variance and total-score variance, respectively, is attributable to the general factor. At the same time, PUC was 0.647, that is, slightly below the conventional 0.70 threshold. Taken jointly, these indices support the interpretation of the scale as predominantly driven by a general factor, while also suggesting that some residual specific variance remains. Subscale specificity was limited overall, although not absent (ωs = 0.044 for PA + REL; 0.438 for PI; 0.290 for POL). The extremely low ωs value for PA + REL indicates that almost all the variance in the corresponding items is accounted for by the general factor. In contrast, the PI subscale shows moderate residual specificity, whereas the POL subscale retains only limited specificity.
The joint interpretation of these bifactor dimensionality indices suggests that the empirical structure of the model is predominantly driven by a general factor (Rodriguez et al., 2016; Reise et al., 2013), while retaining some residual specificity in the relational dimensions, particularly PI. In the proximity format considered here, short and highly regularized interactions may lead customers to evaluate service quality largely in global terms. Nevertheless, the residual specificity associated with PI indicates that interpersonal interaction still constitutes a meaningful source of differentiation within an otherwise highly standardized service model. Accordingly, using the 18 adapted RSQS items as an overall score appears theoretically and empirically supported, while the residual contribution of PI should not be neglected.
4.4 Short-form RSQS-SF-8I
Based on the results of the 3-factor bifactor model, a short-form of the adapted RSQS (RSQS-SF-8I) was developed. The short-form was designed to preserve adequate conceptual coverage of the four retained content domains after adaptation (PA, REL, PI and POL), although in the empirical solution PA and REL converged into a single latent factor PA + REL. Two items were selected for each retained content domain by primarily considering Item Explained Common Variance (I-ECV) values, while also preserving conceptual coverage within each domain. I-ECV quantifies the proportion of an item's common variance that is attributable to the general factor, relative to the total common variance explained jointly by the general and specific factors (Rodriguez et al., 2016). The selected items were PA3, PA5, REL1, REL3, PI2, PI6, POL1 and POL4. In the PI domain, PI2 and PI6 were retained in order to preserve the confidence-helpfulness component of interpersonal service quality. For these items, Table 7 shows the standardized regression weights for the general (SRWg) and specific (SRWs) factors and related I-ECV values.
The resulting short-form scale was then specified as an 8-item single-factor model and was subjected to CFA. The bifactor validation of the reference scale supported the plausibility of the single-factor specification of the short-form scale. The CFA results showed a very good fit to the data. A residual covariance was specified between PI2 and PI6. This specification was theoretically justified because both items belong to the Personal Interaction domain and capture closely related interpersonal aspects, namely employees' ability to inspire customer confidence and their perceived availability to help customers. In the proximity retail context examined here, these two aspects may share a localized relational component not fully accounted for by the general short-form factor. The χ2 = 34.812 (df = 19) and the χ2/df ratio = 1.832. The incremental indices (CFI = 0.985; TLI = 0.978) exceeded the conventional excellence thresholds, while the RMSEA = 0.052 (90% CI: 0.023–0.079) indicated a low approximation error. Finally, construct reliability was assessed using omega (ω). The obtained value (ω = 0.861) confirmed the high internal consistency of RSQS-SF-8I and indicated that the selected items contribute consistently to the latent factor.
4.5 Nomological validity
CFA was performed on the 3-factor bifactor model and RSQS-SF-8I, including the external loyalty construct in addition to the scales' factors. Prior to estimation, the two loyalty indicators were z-standardized because they were measured on different response scales. Associations between the general factor of the 3-factor bifactor model, the latent RSQS-SF-8I factor, and the loyalty construct were evaluated within CFA (Carter et al., 2023; MacKenzie et al., 2011).
In the 3-factor bifactor model, CFA results showed a very good fit. The χ2 value was 323.147 (df = 151) and the χ2/df ratio was 2.140. The incremental indices (CFI = 0.958; TLI = 0.947) exceeded the reference thresholds, while the RMSEA = 0.061 (90% CI: 0.052–0.070) indicated a small approximation error. In terms of association level, the correlation between the general quality factor and the loyalty construct was 0.688, p < 0.001.
In the RSQS-SF-8I model extended with the loyalty construct, the CFA results showed good fit and a parsimonious factor structure (χ2 = 81.925, df = 33; χ2/df = 2.483; CFI = 0.965; TLI = 0.952; RMSEA = 0.069, 90% CI: 0.050–0.088). The correlation with the loyalty construct was high, namely 0.731 (p < 0.001).
5. Discussion
The results confirm that RSQS is an appropriate retail-specific reference framework, while showing that its original structure does not directly translate into the high-frequency, low-involvement proximity retailing context examined here. Compared with the original RSQS, the present study identifies a more compact structure. In particular, after contextual adaptation, PS was not retained because return, complaint, and service-recovery situations were rarely encountered in the examined format. In contrast, within the retained domains, PA and REL converged empirically into a single dimension.
This pattern is consistent with RSQS-related studies showing that service-quality dimensions vary across retail environments. Supermarket-oriented applications, such as Vázquez et al. (2001) and Musasa and Tlapana (2023), confirm the usefulness of RSQS-based measures while underlining the need for contextual adaptation. The present study extends this evidence to European proximity retailing. In this setting, the convergence of PA and REL is particularly meaningful. Customers appear to evaluate the material organization of the outlet, merchandise availability, transaction accuracy and service regularity as connected aspects within the same routine shopping episode. This differs from larger or more complex retail formats, where the physical environment and reliability may remain more clearly distinguishable. Moreover, the merger is consistent with low-involvement consumer processing. Because proximity-shopping episodes are short and routine, customers are less likely to analytically separate the different operational aspects that shape the service encounter. They appear to form a more holistic evaluation during the specific shopping occasion. This interpretation helps explain why PA and REL emerge as a combined dimension.
The bifactor solution further strengthens this interpretation. It indicates that perceived service quality in the context under examination is predominantly driven by a general factor, suggesting that customers mainly form an overall judgment. At the same time, the residual specificity of PI shows that employee contact remains a distinguishable component of perceived service quality, even within a standardized and low-involvement service model. This finding is particularly relevant in light of the increasing spread of self-service and automated retail technologies. Automation can strengthen convenience, speed and operational standardization. However, human contact remains a specific source of assistance, courtesy and empathy. Interpersonal aspects do not disappear in this proximity format but operate as a source of specific differentiation.
The RSQS-SF-8I translates these findings into a parsimonious measurement instrument. This contribution aligns with the broader literature on scale parsimony, which emphasizes that short forms are useful when they reduce administration time without sacrificing construct coverage and validity (Smith et al., 2000; Stanton et al., 2002; Goetz et al., 2013). RSQS-SF-8I was developed as a context-specific short-form, while maintaining adequate conceptual coverage of the reference scale domains. In this sense, parsimony is understood as a trade-off between measurement efficiency and theoretical coverage. This is particularly relevant for proximity retailing, where customers are often interviewed during brief shopping visits and lengthy questionnaires may be impractical.
The strong association between perceived service quality and loyalty intentions confirms the behavioral relevance of the construct captured by both the adapted RSQS and RSQS-SF-8I. The association between the general quality factor and loyalty, together with the association between the short-form factor and loyalty, supports the nomological validity of both scales. These results indicate that the proposed service-quality framework is not only psychometrically sound but also relevant for understanding customer loyalty in the high-frequency, low-involvement proximity retailing examined here.
6. Conclusions
From a theoretical point of view, the results support the relevance of RSQS in the service context examined here, while its structure is also re-specified in an adapted 18-item version. The values obtained for the bifactor dimensionality indices indicate that the scale is predominantly driven by a general factor, while retaining residual specificity in certain dimensions, particularly PI.
Methodologically, the study combines validation through alternative CFA models with bifactor dimensionality indices, thereby offering a rigorous framework for examining the structure of retail service quality scales. In addition, the short-form development procedure guided by I-ECV values and conceptual coverage provides a transparent approach for future scale-reduction studies in related service contexts.
At the managerial level, the findings provide proximity retailers with empirically validated tools supported by nomological validity. In particular, RSQS-SF-8I offers a compact tool for repeatable service-quality monitoring. Moreover, the empirical convergence between PA and REL further suggests that managers should treat store environment and service dependability as an integrated operational area. In proximity retailing, layout clarity, product availability, transaction accuracy and timely service should be coordinated as parts of a single service system. Finally, the aggregated service quality score derived from the bifactor model and from the RSQS-SF-8I offers a reliable metric for monitoring overall service quality and its association with loyalty outcomes.
The cross-sectional design limits the ability to assess the temporal stability of the validated framework. Moreover, the short-form scale was developed and validated on the same sample, which calls for further testing through holdout-sample procedures or external validation on independent datasets. In addition, because the empirical evidence derives from a single proximity retail chain, the generalizability of the findings remains necessarily circumscribed. Future research could address these limitations by adopting longitudinal designs, independent validation samples and comparative applications across different retail chains and proximity retail contexts.