Urban MICE competitiveness research consists of two clusters, one that is public-statistics-based and another that is questionnaire-based. Supply-side research on urban MICE competitiveness is rare. Based on the findings of Chen (2014) and other scholars, the purpose of this paper is to design counterpart statistical indicators to empirically analyze CMCA member cities.
After calculating the standardized Z value of the original statistical data for 17 CMCA member cities, the authors conducted confirmatory factor analysis for the first-level principal components, based on which hierarchical clustering was performed; then, regression analysis was conducted with the MICE profit factor as the dependent variable and the cost factor, tight support factor and facilitating factor as the independent variables to support publishing articles.
The confirmatory factor analysis showed that the urban MICE competitiveness indicators from the supply-side perspective include the profit factor, cost factor, tight support factor and facilitating factor.
On the basis of research findings from the demand perspective and the literature review, the authors constructed an urban MICE competitiveness indicator system from the perspective of the supply side and conducted principal component analysis. However, because of the inaccessibility of panel data, the current data were only sufficient to conduct the research. If panel data could be acquired, further research could be conducted to perfect the current indicator system for urban MICE competitiveness.
The findings suggest that tourism total income, tourism foreign exchange income, inbound tourist number, number of exhibitions, exhibition area, number of UFI member cities and number of ICCA member cities were the main reason for the gap between different cities’ competitiveness and the reform focus for improving urban MICE competitiveness. The cost factor had a significantly negative influence on urban MICE competitiveness, implying that the higher the average hotel room price and revenue per available room, the less competitive the MICE host city is.
The tight support factor exerts a significant positive influence on urban MICE competitiveness from the supply-side perspective, while the cost factor exerts a significant negative influence. The findings suggest that the tourism total income, tourism foreign exchange income, inbound tourist number, number of exhibitions, exhibition area, number of UFI member cities and number of ICCA member cities were the main reason for the gap between different cities’ competitiveness and the reform focus for improving urban MICE competitiveness. The cost factor had a significantly negative influence on urban MICE competitiveness, implying that the higher the average hotel room price and revenue per available room, the less competitive the MICE host city is.
The research bridge the empirical statistics and the questionnaire-based perception study on urban MICE tourism image, and advance to construct an empirical statistics based indicator system for urban MICE tourism image.
1. Introduction
Because of its high consumption, low price sensitivity, relative stability, high industrial correlation, added value, radiation effect and treatment as a business sector, MICE has attracted much attention from both local governments and academics (Allen et al., 2012). The China MICE Cities Alliance (CMCA) was founded in September 2012 and boasted 17 member cities at the end of 2016.
Urban MICE competitiveness has become a research hotspot as Michael P’s Diamond Model has been widely applied to construct a general urban MICE competitiveness indicator system (Lee, 2004; Zhang, 2014; Cai and Wu, 2014; Yu and Niu, 2012; Piao and Zhang, 2011; Yang, 2010a, b; Lee and Zhan, 2009; Hu, 2009; Lee, 2008; Lee et al.,). The analytical hierarchy process (AHP) has also been widely used to construct general urban MICE competitiveness indicator systems (Ma and Chen, 2013; Ye, 2010; Wang et al., 2009; Lee, 2016; Liu, 2014; Qi, 2007). Factor analysis has been utilized to evaluate urban MICE competitiveness in Guangzhou (Wu, 2009). Fuzzy evaluation (Lee, 2008; Lee et al., 2007; Zhao and Zhao, 2007; Yan and Yu, 2007), IPA (Deng and Lin, 2014; Wang, 2013), SEM (Chen, 2014) and TOPSIS (Wu and Zheng, 2011) have also been utilized to study urban MICE competitiveness. Urban MICE competitiveness has also been studied from the perspective of industrial clusters (Lu, 2012; Cai and Tang, 2011; Zhang et al., 2010; Zhang and Zhang, 2015; Wang, 2014).
Qi (2007) selected 50 indicators to construct an urban MICE competitiveness evaluation system. Based on the available urban statistics regarding facilities, transportation, services, price image, climate and the environment, Zhu (2011) conducted a confirmatory evaluation of urban MICE competitiveness in 17 coastal MICE destination cities. Wang (2015) found that the first five factors influencing Beijing’s MICE development are transportation, professional management level, event theme, sufficient information exposure, climate and the natural environment. Chen (2014), using SEM, found that urban environment, cost, leisure and MICE quality are the principal factors influencing urban MICE image.
Structural reform of the supply side is an important top-level strategy for the sustainable development of China’s economy in the new era, and its implementation will significantly influence the MICE industry in China. Two published academic articles retrieved from CNKI have discussed China’s MICE industry. Fang (2016) discussed the strategy to promote China’s MICE industry from the supply side. Fan and Wang (2017) described their vision of the supply-side structural reform of the MICE cultural industry.
In summary, urban MICE competitiveness research consists of two clusters: one that is based on public statistics and another that is based on questionnaires. Supply-side research on urban MICE competitiveness is rare. Based on the findings of Chen (2014) and other scholars, this research designed counterpart statistical indicators to empirically analyze CMCA member cities and enriched the research on urban MICE competitiveness from the supply side.
2. Methodology
2.1 Principal component analysis
Principal component analysis is widely utilized in the social sciences for dimension reduction. Each principal component is a linear combination of the original variables, and it is assumed that none of the principal components are correlated. If there are m samples and p variables for each sample, a matrix of n rows and p columns is formed:
The original variables are x1, x2, …, xm, and the new variables are y1, y2, …, yp (p⩽m). Then:
y1, y2, …, yp are the original variable indicators; x1, x2 ,… xm are the first, second,…, pth principal components. eij(i=1, 2,…, p, j=1, 2, …, m) is the loading of principal component yi.
2.2 Regression analysis
Regression analysis is a multivariate statistical technique used to find causal relationships between two or more types of variables. Based on the findings of the principal component analysis, multiple linear models were constructed with the following formula:
β0, β1, β2 and β3 are the model parameters; Yi is the profit factor score for the ith city; Di is the tight support factor score for the ith city; Ai is the cost factor score for the ith city; Oi is the facilitating factor score for the ith city; and ξi is the unknown factor score for the ith city.
3. Data sources and selection of the urban MICE competitiveness indicators
3.1 Selection of the urban MICE competitiveness indicators
According to the research findings of Chen (2014), Qi (2007), Zhu (2011) and Lee, the authors constructed an urban MICE competitiveness indicator system from the perspective of AHP. The first-level indicators include the MICE profit and cost factors and the support and facilitating factors. Considering the theoretical foundation and data accessibility, 23 second-level indicators were selected (Table I).
3.2 Data sources and processing
The original data sources are the Statistical Bulletin of the National Economic and Social Development of Corresponding Cities (2014), the Urban Statistical Yearbook of China (2015), each city’s tourist bureau website and statistical yearbook (2015) and the China Exhibition Statistics Report (China Exhibition Economy Research Association, 2015).
After calculating the standardized Z value of the original statistical data, the authors conducted confirmatory factor analysis for the first-level principal components, based on which hierarchical clustering was performed; then, regression analysis was conducted with the MICE profit factor as the dependent variable and the cost factor, tight support factor and facilitating factor as the independent variables.
4. Analysis of the factors influencing urban MICE competitiveness from the supply-side perspective
4.1 Profit and cost factors of urban MICE competitiveness
A KMO test was conducted on the standardized values, and the KMO value was 0.728, greater than 0.7. Bartlett’s test was significant at the level of 0.000, indicating the feasibility of the factor analysis. The original nine indicators were explained by two factors with eigenvalues greater than 1, and the cumulative variance contribution rate was 86.912 percent, indicating that the two factors have strong explanatory power. The profit and cost factors of urban MICE competitiveness (Fa) include total tourism income X1, tourism foreign exchange income X2, inbound tourist person-time X3, average hotel room price X4, revenue per available room X5, number of exhibitions X6, exhibition area X7, number of ICCA member cities X8 and number of UFI member cities X9 (Table I), the respective factor loadings of which are shown in Table II; the cutoff point is 0.787, far above 0.5. Fa includes variables X1, X2, X3, X6, X7, X8 and X9 as the profit factors, and Fb includes X4 and X5 as the cost factors (Table II).
The tourism profit and cost scores for the CMCA member cities were obtained using the following formula:
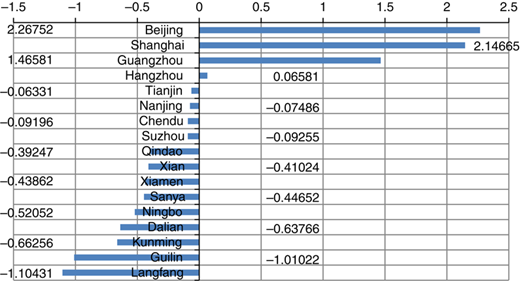
According to the above formula, the tourism profit and cost scores for the CMCA member cities were calculated (Table III).
4.2 Tight support factor and facilitating factor
The rotated matrix for factor loading (Table IV) shows that variables X11, X12, X13, X14, X15, X16, X19, X20, X21 and X22, the loadings of which are greater than 0.5, explain a principal component that can be named the tight support factor for MICE (Fc) and that variables X10, X17, X18 and X23, the loadings of which are greater than 0.5, explain a principal component that can be named the tight support factor for MICE (Fd). The MICE industry needs substantial transit support, and tourism resources and the environment can improve the experience of MICE visitors.
Taking the variance contribution of each factor as the weight, the scores (Table V) for the MICE tight support and facilitating factors of each CMCA member city were calculated according to:
4.3 Comprehensive urban MICE competitiveness
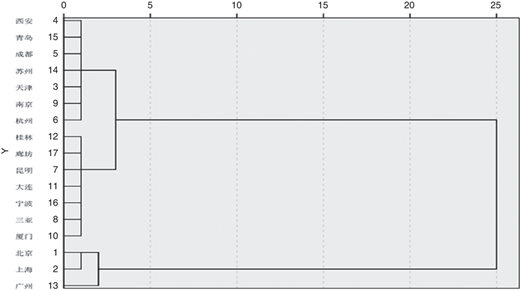
A further factor analysis of the profit and cost factor scores and the tight support and facilitating factor scores was performed to obtain the comprehensive urban MICE competitiveness score for each city (Table V). Based on these results, hierarchical cluster analysis was conducted. The 17 cities could be classified into three classes (Figure 1).
4.4 Regression analysis of the factors influencing urban MICE competitiveness
With the profit factor as the dependent variable and the cost factor, tight support factor and facilitating factor as the independent variables, regression analysis was conducted. The model summary shows that the adjusted R2 was 91.6 percent and was significant at the 0.000 level, indicating that 91.6 percent of the variance of the model was explained and at least one of the independent variables entered the intended regression model (Tables VI and VII).
After the test of Cook’s distance and the Mahalanobis distance, two outliers (Shanghai and Guangzhou) were removed from the sample. The tolerance values for each independent variable were between 0 and 1, and the VIF values for each independent variable were between 1.0 and 10, indicating the absence of collinearity problems. The significance level of the facilitating factor, 0.141, indicates that the facilitating factor did not enter the regression model (Table VIII). The final model is as follows:
5. Discussion and findings
The authors work enriched the current research by ① constructing an empirical framework for urban MICE tourism image from the supply side and ② integrating a questionnaire-based study and empirical study on urban MICE tourism image that will provide implications for both practitioners and researchers from the supply side, especially in a country where the government and public sectors are the primary organizers of MICE.
5.1 Urban MICE competitiveness indicators from the supply-side perspective
The confirmatory factor analysis showed that the urban MICE competitiveness indicators from the supply-side perspective include the profit factor, cost factor, tight support factor and facilitating factor. The profit factor included variables such as tourism total income, tourism foreign exchange income, inbound tourist number, number of exhibitions, exhibition area, number of UFI member cities and number of ICCA member cities, which indicates the strong radiation effect on the economy. The cost factor included variables such as average hotel room price and revenue per available room. The tight support factor included variables such as the number of exhibition centers, number of 4-star hotels, number of 5-star hotels, number of travel agents, number of employees in the tertiary industry at year-end, civil aviation traffic volume, GDP, total retail sales of consumer goods and local financial revenue. The facilitating factor included variables such as number of scenic spots above 4 A, railway traffic volume, highway traffic volume and green land area. The results of the principal component analysis show that the initial urban road area at year-end had no significant influence, which requires further research.
5.2 Implications for the principal components influencing urban MICE competitiveness from the supply-side perspective
The tight support factor exerts a significant positive influence on urban MICE competitiveness from the supply-side perspective, whereas the cost factor exerts a significant negative influence. The findings suggest that the total tourism income, tourism foreign exchange income, inbound tourist number, number of exhibitions, exhibition area, number of UFI member cities and number of ICCA member cities were the main reason for the gap between different cities’ competitiveness and the reform focus for improving urban MICE competitiveness.
The cost factor had a significantly negative influence on urban MICE competitiveness, implying that the higher the average hotel room price and revenue per available room, the less competitive the MICE host city is.
5.3 Status quo of the 17 CMCA member cities from the supply-side perspective
The CMCA member cities can be classified into three clusters: international MICE cities, regional MICE cities and local MICE cities. Beijing, Shanghai and Guangzhou are the international MICE cities that are the most competitive in most indicators (Figure 2).
Among regional MICE cities, Xi’an and Chengdu are comprehensive economic and political centers in Northwest and Southwest China, respectively, while Tianjin is the gateway city to Beijing. Hangzhou, Nanjing and Suzhou are compact hinterland cities in the Yangtze River Delta Megalopolis; Qingdao is the gateway city to the Shandong Peninsula Megalopolis, the urban MICE competitiveness of which is neither high nor low, with most indicators being moderate.
Local MICE cities are less competitive, and each has unique problems. Sanya’s MICE profit is lowest but has the highest cost, while Xiamen’s cost is relatively high.
6. Limitations and prospects
Based on research findings from the demand perspective and the literature review, the authors constructed an urban MICE competitiveness indicator system from the perspective of the supply side and performed principal component analysis. However, because of the inaccessibility of panel data, the current data were utilized to conduct the research. If panel data could be acquired, further research could be conducted to refine the current indicator system for urban MICE competitiveness.
Foundation: research on the principal factors influencing urban MICE tourism image from the perspective of systemic markets, taking Guangzhou and Macau as examples, Guangdong Natural Science Foundation (2016A030313707, 2015WTSCX032).