

This paper examines how third-party online food delivery reshapes restaurant economics and operations and translates empirical interview findings into a practical, evidence-based roadmap for adoption. The study aims to help managers decide when and how to list with delivery aggregators while protecting core assets and unit economics.
Semi-structured interviews were conducted in 2019 with 17 US restaurant owners and operators, including 11 active users of third-party online food delivery and 6 non-users. Transcripts were analyzed using thematic analysis. Findings were synthesized with subsequent industry developments, including COVID-19 impacts and emerging automation and AI technologies, to derive pragmatic stage-gate guidance for practitioners.
Three crosscutting themes emerged: motivations and perceived benefits, operational adjustments and predictable trade-offs. These themes converge on three practical conditions that determine net benefit from platform delivery: positive menu item contribution margins, reliable delivery workflows with packing quality assurance and access to order-level data for ROI analysis. Building on user experience, the paper presents a four-stage stage-gate roadmap with stage-specific gates, measurable criteria and remedial decision rules to screen fit, pilot operations, validate systems and commercial terms and scale with durable governance.
The paper converts qualitative insights into an actionable stage-gate adoption framework that bridges academic analysis and managerial practice. It offers concrete gate criteria and deliverables that managers, consultants and researchers can use to test, negotiate and govern platform delivery while preserving brand and operational assets.
Introduction
Background
The paper looks at how third-party online food delivery (TPOFD) has reshaped the United States (US) restaurant landscape and translates the insights from Traynor, Bernard, Moreo, and O’Neill (2022) into practical guidance for operators. Instead of treating TPOFD as a purely technological trend, it reframes the findings as actionable strategies for organizational change and asset management, giving managers a clearer path to capturing digital demand without undermining their core business. The rapid expansion of TPOFD has become one of the industry's most disruptive developments, fundamentally shifting how restaurants compete and deliver value (Müller, 2018). While these platforms can broaden reach (See-Kwong, Ng, Wong, & Chong, 2017) and unlock new revenue streams, they also bring significant operational and financial tradeoffs that operators must understand and plan for (Maimaiti, Zhao, Jia, Ru, & Zhu, 2018).
On the customer side, strong demand for convenience and variety has accelerated the shift toward digital ordering and changed how guests discover and select restaurants. This has intensified competition for visibility on delivery apps (Kang & Namkung, 2019; Kimes, 2019). With smartphone ownership near universal, 91% of US adults and 98% of those ages 18–29 (Pew Research Center, 2024), it's no surprise that younger diners drive much of this digital ordering behavior. Gen Z, often described as “true digital natives,” expects frictionless omnichannel access and personalized experiences (Francis, 2018). Technology providers serving the restaurant industry also note that Gen Z prioritizes mobile-first ordering, speed, novelty, authenticity and sustainability, which makes a strong platform presence increasingly important for menu design, promotions and order-fulfillment decisions (Toast, 2024).
Because of these consumer shifts, restaurants face growing pressure to offer TPOFD simply to remain competitive and visible in a digital marketplace (Hirschberg, Rajko, Schumacher, & Wrulich, 2016). To help operators navigate this shift, the paper applies an organizational-change lens and offers a structured Stage-Gate TPOFD roadmap. This roadmap enables leaders to make evidence-based decisions at each phase rather than relying on assumptions. The process ends with a sustainability checkpoint after Stage 4, an operational review that verifies performance stability across key performance indicators (KPIs) and compares actual results against original projections (Cooper, 2008).
Key findings
This paper interprets those empirical findings in light of recent industry developments and broader contextual shifts, including COVID-19 and emerging technologies like robotics and generative AI. In 2019, the research team conducted semi-structured interviews with 17 US restaurant operators: 11 using TPOFD and 6 who had chosen not to adopt it (Table 1).
Details of study participants based on restaurant classification
| Industry Segment | TPOFD user | TPOFD non-user |
|---|---|---|
| Quick Service Restaurant | 3 | 0 |
| Fast Casual | 3 | 2 |
| Casual | 3 | 1 |
| Casual Fine | 2 | 3 |
Their insights fall into three practical themes: what motivated them and the benefits they saw, how TPOFD changed day-to-day operations and the trade-offs they encountered. Together, these themes highlight the balancing act operators face: pursuing additional revenue and digital visibility through expanded customer reach, while also protecting their core assets, maintaining service quality and keeping unit economics healthy.
Motivations and perceived benefits
Motivations to adopt delivery platforms usually stem from managers' perceptions that these services can offer commercial or operational advantages. These perceived benefits often put pressure on non-users to at least explore the platforms, though many hesitate to adopt them until they see clear, data-backed proof that those expectations will actually pay off.
Demand, discovery and customer profile
TPOFD platforms can help drive repeat off-premises business and serve as discovery tools that attract new, mobile-first customers. These guests often skew younger, prioritize convenience and feel completely at ease ordering through apps. For many operators, platform orders represent incremental sales that help fill slow dayparts and offer a low-cost way to test new menu items and promotional ideas.
Economics and conditionality: entry benefits versus unit economics
TPOFD platforms lower upfront investment by providing the delivery drivers, routing systems and payment infrastructure, allowing smaller concepts to offer delivery without buying or managing their own fleet. However, that accessibility comes with ongoing per-order expenses – commissions, packaging costs and promotional fees – that can significantly tighten contribution margins. As a result, the net benefit depends heavily on disciplined menu item (stock keeping unit) level economics, along with smart pricing and packaging decisions. Without those controls in place, the extra volume generated by TPOFD may not translate into actual profit.
Operational adjustments due to TPOFD
As restaurants add third-party online delivery, three linked operational demands recur: resource planning, workflow separation and menu and policy calibration.
Operational resources and workflows
Delivery adds ongoing operating costs and forces changes to both kitchen and front-of-house workflows. Because delivery orders can come in unpredictable bursts, scheduling becomes more complicated and often requires flexible or contingency staffing. To protect the dine-in experience, many operators set up dedicated pack-and-pick stations, staging and heat-holding areas and clearer handoff procedures. Space, staffing and communication practices are closely connected, so they're most effective when planned together rather than treated as separate fixes. These operational adjustments also help build stronger long-term capabilities: clearer portioning, packing (final assembly) checklists and better timing controls improve everyday consistency and, once fully developed, increase resilience. Restaurants with delivery-ready workflows were better positioned to pivot during major demand disruptions.
Menu and pricing
Most operators narrow their delivery-ready menus, removing fragile or time-sensitive dishes to protect food quality during transit. They also adjust pricing and portioning to account for commissions, packaging costs and added labor, either through modest price increases or by redesigning portions and packaging. Thoughtful menu curation and menu item-level economics are therefore essential controls for keeping delivery financially sustainable.
Trade-offs
Platform delivery offers clear upsides, but it also entails predictable trade-offs. Both users and non-users tend to recognize the same potential benefits, yet they respond to them differently. Operators who adopt TPOFD usually validate the business case once they have solid menu economics and workflow controls in place. Non-users, on the other hand, often see those benefits as theoretical and focus more on perceived risks, which ultimately become a barrier to adoption. This difference in expectations shapes whether the perceived advantages turn into real gains or remain unresolved liabilities.
Customer experience risks
The platform delivery model creates last-mile risks that can hurt the guest experience and damage brand reputation. Independent drivers may mishandle food, arrive late, or ignore handling instructions, leading to meals that arrive cold, damaged, or incorrectly assembled. When these failures happen, restaurants often end up covering the cost of making things right because guests typically blame the operator – not the delivery platform. This increases the burden of complaint management and service recovery and can reduce the likelihood of repeat business. Additionally, sudden spikes in delivery orders can pull staff away from in-house operations and degrade the dine-in experience.
Economic and operational burden
While TPOFD platforms reduce the upfront costs of offering delivery, their commissions and related fees can significantly tighten per-order margins. Operators also face additional expenses such as packaging, packing labor, promotional fees and accelerated wear and tear on equipment. Technical issues, such as limited point of sale (POS) integration, basic menu-building tools and restricted access to order-level data, add manual work and make it harder to understand true menu-item profitability or convert platform customers into direct buyers. Together, these factors create operational drag that can offset the value of incremental volume unless operators actively manage unit economics and workflow controls.
Actionable insights
The themes point to three key operational and financial indicators that determine whether TPOFD produces a net benefit:
strong contribution margins at the menu item (SKU) level,
dependable delivery workflows supported by solid packing and quality-assurance practices and
access to order-level data that enables accurate return on investment (ROI) analysis.
Building on these insights, the synthesis of future operational strategies for TPOFD users produced a Stage-Gate–based roadmap for adoption. The Stage-Gate-based system is widely used to manage innovation and complex operational change by breaking large initiatives into short sequential work stages separated by evidence-based decision gates. Think of Stage-Gate as a series of short sprints with pit-stops: focused work is completed at a stage, then paused at a gate to be assessed and decide the next move. This keeps risk visible, execution disciplined and spending tied to proof, not hope. This structure helps surface risk early, ensures disciplined execution and focuses investment on the most promising opportunities (Cooper, 2014).
Stages are cross-functional work blocks with clearly defined objectives, for example, running a two-week pilot for TPOFD with a compact menu (Figure 1). Gates are decision points with brief stop-and-check reviews run by a small set of gatekeepers who examine standardized deliverables against explicit, simple pass/fail criteria and choose an action (Cooper et al., 2002). For example, the owner, general manager and kitchen manager convene to assess the two-week compact-menu pilot; they review a one-page pack-accuracy log, average time-to-handoff and menu item-level contribution for the top five items against preset thresholds, then decide on the action to take. Each gate results in one of four actions:
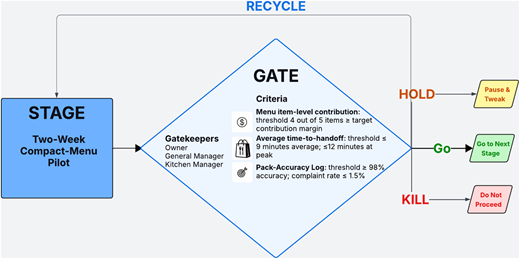
Example of stage and gate for a two-week compact-menu pilot assessing top-five item contribution, average time-to-handoff and pack-accuracy
Example of stage and gate for a two-week compact-menu pilot assessing top-five item contribution, average time-to-handoff and pack-accuracy
Go: The project moves forward to the next stage.
Hold: The decision is paused at the current gate for minor adjustments; the previous stage is not reopened.
Recycle: The project is sent back to the prior stage for targeted rework and then returns to re-run the gate.
Kill: The pathway is stopped, either for the entire project or for a defined scope such as specific menu items or markets and lessons learned are documented.
After Stage 4 (Scale & Sustain), the process concludes with an Operational Sustainability Review, which compares actual results with initial projections and determines whether to continue, expand, optimize, recycle aspects, or roll the initiative back (Cooper, 2008).
In the roadmap (Figure 2), each stage has a clear purpose, a focused set of activities and an evidence-based gate that tests one or more of the three core operational and financial indicators. The early stages assess readiness and basic unit economics, the pilot stage validates execution under real operating conditions and the intermediate stages confirm systems integration and commercial terms. The final stage establishes governance, preventive-maintenance routines and customer-retention practices to ensure stable, long-term performance before any broader rollout.
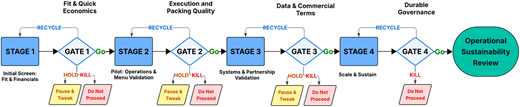
Stage-gate roadmap for TPOFD adoption in the United States: four stages separated by gates; final operational sustainability review
Stage-gate roadmap for TPOFD adoption in the United States: four stages separated by gates; final operational sustainability review
Stage 1: screen - fit and financials
Purpose
Confirm concept fit and whether quick menu item economics justify a pilot.
Key actions
Assess service style and cuisine fit. If delivery risks the core experience, consider a limited delivery menu, pickup only, or controlled in-house fulfillment.
Check local demand profile and digital behavior to judge likely reach.
Produce quick per menu item estimates for representative items that include platform price, food cost, packaging, incremental labor and commission.
Gate 1: fit and quick economics
Deliverables
Concept fit assessment detailing service style, cuisine and guest experience compatibility, risk assessment and recommended delivery approach, rationale for adoption and recommended next step.
Quick economics estimating contribution margin for the top 3–5 menu items using platform price, food, packaging, incremental labor costs and commission.
Customer profile snapshot summarizing local demand indicators and digital behavior that justify adoption.
Criteria
Positive menu item contribution margins: measured by per menu item contribution estimates using platform price, food cost, packaging, incremental labor and commissions.
Reliable delivery workflows with packing quality assurance: measured by quick operational feasibility checks such as available packing space, obvious throughput bottlenecks and whether a pilot would materially degrade in-house service.
Access to order-level data for ROI analysis: measured by an early indication of whether local TPOFD platforms can provide periodic order-level data reports.
Output
Go - advance to Stage 2.
Hold – pause at Gate 1 so minor fixes can be made, such as narrowing the initial delivery menu, adjusting pricing, portioning, or packaging for representative menu items, confirming minor capacity tweaks, or securing a basic periodic data export, without reopening Stage 1; the team then re-presents at Gate 1.
Recycle – return to Stage 1 for additional stage work, such as redoing per menu item contribution estimates, revisiting feasibility and capacity assumptions or strengthening the data-access plan, and re-run Gate 1 with updated deliverables.
Kill – do not proceed to pilot. Document reasons and capture learning.
Stage 2: pilot - operations and menu validation
Purpose
Validate execution in real conditions and confirm delivery can be done reliably and profitably at a contained scale.
Key actions
Run a timebox pilot with a compact delivery-ready menu.
Implement simple controls: dedicated pack and pick area, packing checklist, tamper seals, clear handoff rules and surge staffing plans.
Track per-order economics, packing errors, time to handoff and complaint patterns.
Trial light customer take-back tactics to test conversion to owned channels.
Gate 2: execution and packing quality
Deliverables
Pilot report covering pilot volume, actual per menu item contribution (using real pilot data), packing errors, time-to-handoff, complaints and any reconciliation notes.
Packing quality assurance evidence demonstrating packing quality assurance procedures were used during the pilot: completed checklists, photos of packing stations or sealed bags and sample check runs.
Summary of take-back tactic trial and early conversion results from simple tactics to convert platform buyers to direct channels (single-use direct-order codes, landing page conversions, sign-ups).
Criteria
Positive menu item contribution margins: measured by actual per-order contribution for pilot menu items and sensitivity to promotions and TPOFD commission.
Reliable delivery workflows with packing quality assurance: measured by observed packing accuracy, error types and frequency, handoff times and whether delivery peaks can be absorbed without degrading dine-in service.
Access to order-level data for ROI analysis: measured by whether the pilot generates sufficient transactional detail to calculate menu item level economics, even if exports are manual or periodic.
Output
Go – advance to Stage 3.
Hold – pause at Gate 2 so limited operational fixes can be made, such as refining packaging, adjusting the pack-station workflow or checklists, tightening handoff rules, or refining surge staffing, without conducting a completely new pilot; the team then re-presents at Gate 2 with brief confirmatory evidence.
Recycle – return to Stage 2 for a targeted re-pilot, such as compacting the menu, redesigning packaging, reconfiguring pack/pick or refining staffing and handoff timing, and then re-run Gate 2 with new pilot evidence.
Kill – do not proceed to broader adoption if execution cannot be made reliable and with reasonable fixes.
Stage 3: systems and partnership validation
Purpose
Confirm that data access, integration and commercial terms support a durable, measurable business case.
Key actions
Secure reliable order-level exports or API access sufficient for menu item economics and ROI analysis.
Test POS mapping and reconciliation.
Use pilot evidence to negotiate practical platform terms such as data access, time-limited commission structures, or co-funded promotions.
Define and test service recovery and escalation process with the TPOFD aggregator, including a joint incident log and post-incident review.
Gate 3: data and commercial terms
Deliverables
Representative transactional data (actual orders) exports for representative window orders to calculate menu item level economics and reconcile platform vs. POS records.
Integration summary showing how POS and TPOFD platform fields map or fail, and how much manual reconciliation was required.
Summary of pilot commercial terms describing the negotiated commercial and promotional terms piloted with the TPOFD aggregator.
Service-recovery protocol for handling delivery failures plus sample incident entries showing how many incidents, resolution times and outcomes.
Criteria
Positive menu item contribution margins: measured by incremental ROI under proposed commercial terms. Confirm that contribution margins remain positive with platform commission, negotiated promotional costs and any co-funding are applied.
Reliable delivery workflows with packing quality assurance: measured by whether documented recovery and escalation processes reduce unresolved failures and whether packing and handoff KPIs hold under pilot commercial conditions.
Access to order-level data for ROI analysis: measured by reliable, recurring access to order-level exports or application programming interface (API) data that include menu item, modifiers, fees and timestamps at a cadence sufficient for reconciliation and ROI tracking.
Outputs
Go – proceed to Stage 4.
Hold – pause at Gate 3 so minor mapping, cadence, or contract items can be finalized, such as confirming the export schedule, completing a missing POS field map, tidying reconciliation steps, or clarifying promotion and commission math, without renegotiation or reintegration; the team then re-presents at Gate 3.
Recycle – return to Stage 3 for additional stage work, such as securing recurring order-level feeds with required fields, completing POS integration and exception handling, renegotiating commissions, co-funded promotions or data-access clauses, and exercising the recovery/escalation process, and then re-run Gate 3 with updated evidence.
Kill – withdraw or pause expansion if the TPOFD aggregator will not provide necessary data or reasonable commercial terms, and remediation fails. Consider alternative fulfillment models or different partners.
Stage 4: scale and sustain
Purpose
Embed the channel at scale while protecting assets and ensuring performance remains durable.
Key actions
Scale volume while monitoring a compact governance dashboard that includes contribution margins by menu item, packing accuracy, time to handoff, direct conversion and equipment uptime.
Implement preventive maintenance plans and critical spares aligned to observed duty cycles.
Operationalize customer take-back tactics and measure conversion to owned channels.
Establish a weekly operational review and monthly commercial review.
Gate 4: durable governance
Deliverables
Operational dashboard export showing selected KPIs over the governance window (example 4–8 weeks). Typical KPIs include contribution margin by menu item, packing accuracy rate, average time-to-handoff, direct conversion and equipment uptime.
Preventive maintenance schedule and plan tied to observed duty cycles and a list of critical spare parts with lead times.
Summary of customer take-back program performance and trends in direct conversion that evaluates ongoing customer-recapture tactics and their effectiveness at converting TPOFD platform customers into direct customers.
Governance review that summarizes trends, risks, mitigations and recommended next steps.
Criteria
Positive menu item contribution margins: measured by sustained contribution margins over governance window, accounting for seasonality and ongoing promotions.
Reliable delivery workflows with packing quality assurance: measured by long-run stability of packing accuracy, handoff times, complaint rates and the ability of maintenance and staffing plans to support increased duty cycles.
Access to order-level data for ROI analysis: measured by routine, operationalized data flows into governance reporting that enable daily or weekly monitoring.
Outputs
Go – continue to scale and embed TPOFD.
No hold decision is taken at Stage 4 – Any pause or optimization decision is made at the subsequent Operational Sustainability Review (OSR). During such a pause, the team maintains steady-state operations, implements targeted improvements without reopening earlier stages and prepares a new governance window for OSR re-presentation.
Kill – strategically scale back or suspend TPOFD platform exposure or withdraw from the platform channel if failure cannot be corrected without unsustainable investment or unacceptable reputational risk.
Operational sustainability review
Purpose
Verify that third-party delivery remains net-positive at steady state and that safeguards for economics, customer experience/brand and operations are durable. The review concludes with a formal decision to continue/expand, optimize, recycle, or roll back/exit.
Evidence window
Assess performance over a defined governance window (for example, four to eight weeks) at stable volume.
Deliverables
Operational dashboard covering per menu item contribution margins, packing accuracy, average time to handoff, complaint and chargeback rates, direct-channel conversion and equipment uptime.
Data and reconciliation pack documenting order-level export or API cadence required field completeness (menu items, modifiers, fees, timestamps), POS, general-ledger match rates and an exception log with clearance times.
Customer experience and recovery report summarizing incident counts by type, resolution times, outcomes and make-good costs.
Maintenance and reliability summary showing preventive-maintenance completion versus plan, critical spares on hand versus target and unplanned downtime.
Commercial terms snapshot detailing effective commission and promotion burden, any co-funding and measured return on investment.
Owned-channel “take-back” results reporting conversion and repeat-purchase cohorts from codes, QR flows, or customer relationship management journeys.
Criteria
Positive menu item contribution margins: demonstrated sustained margins at or above the agreed threshold after commissions, packaging, incremental labor and promotions, with fee and promotion sensitivity understood.
Reliable delivery workflows with packing quality assurance: packing accuracy at or above target, average time to handoff at or below target and complaint rates within agreed limits over the review window.
Access to order-level data for ROI analysis: recurring, timely feeds (for example, next-day availability) that include required fields, achieve the agreed match rate to the POS system and clear exceptions within the service-level agreement.
Output
Go (expand and continue) - proceed under business-as-usual governance and, where appropriate, expand units, markets, dayparts, or catalog scope according to the playbook.
Hold - pause at the review to implement targeted improvements, such as pricing or packaging refinements, staffing or maintenance cadence adjustments, report automation, or minor term adjustments, without reopening earlier stages; re-run the governance window and re-present at the review.
Recycle - return upstream for additional stage work only when structural issues exist to Stage 3 for data cadence, integration, or commercial terms, or to Stage 2 for an operation's re-pilot; then re-run the review with a new steady-state window.
Kill - reduce scope (for example, catalog, hours, or markets) or exit the TPOFD channel where thresholds cannot be met without unacceptable risk or cost; document lessons learned.
Conclusions
This paper examined how third-party online food delivery reshapes restaurant economics and operations and translated those findings into practical strategies for managers. Although the original results predate the COVID-19 pandemic, later work (Traynor, Owens, O'Neill, & Rahman, 2024) shows that delivery platforms helped many operators stay afloat by preserving cash flow during major demand shocks.
TPOFD expands reach and revenue when paired with organizational changes that protect core assets. The Stage-Gate roadmap keeps adoption disciplined by using explicit checkpoints and ending with an Operational Sustainability Review that compares actual performance with initial projections. This process ensures that next steps are grounded in evidence, prevents premature scaling and safeguards key operational assets.
Emerging technologies, such as robotics and generative artificial intelligence, offer promising efficiency gains, but they should be tested through short, tightly scoped pilots with strict ROI gates. In practice, operators should approach TPOFD as a measured growth channel: pilot it, measure it, protect core assets and scale only when the KPIs clearly demonstrate a net benefit.
