This study aims to investigate the drivers of bank automation system performance expectancy compared to that of bank employees. The purpose is to shed light on the role played by consumers' cognitive schema on automation that is the perfect automation schema (PAS).
A survey was administered to about 500 Italian subjects to measure their PAS; financial knowledge, anxiety, and security; and sociodemographic and socioeconomic variables. Ordered probit regressions and an instrumental variable two-stage least squares regression are run.
The analyses reveal that cognitive schemas play a crucial role in consumer expectations in banking. Individuals with stronger PAS tend to have more positive expectations about bank automation performance compared to employee performance. Financial anxiety and knowledge positively affect bank automation performance expectancy while women, older people, and financially insecure subjects have poor expectations of automated banking systems.
This study extends the understanding of key consumer characteristics that affect bank automation performance expectancy compared to that of bank employees in services delivery in the Italian context. Moreover, it provides useful results for researchers, practitioners, banking institutions, and regulators.
1. Introduction
After the 2008 Global Financial Crisis, the banking industry's focus shifted; instead of prioritizing innovation, the industry began to prefer product operations that generated the highest revenue (Northey et al., 2022). However, with the onset of the COVID-19 pandemic in early 2020, the world experienced widespread social distancing, lockdowns, and isolation measures. These circumstances accelerated the process of digital transformation within the banking sector, reshaping payments, wealth management, lending, and insurance (Bank for International Settlements, 2021). Artificial intelligence and automation are significantly impacting both consumers and financial institutions (Mogaji et al., 2021a, b; Molina-Collado et al., 2021). Smart wallets, robo-advisors, and voice assistants (Donepudi, 2017), selfie-pay (Tomić and Todorović, 2018), blockchain (Kshetri and Voas, 2018), and self-driving cars with bank accounts (King, 2018) are just a few examples of how banks are exploiting automation in their daily operations. Most bank customers opt to oversee their banking affairs and handle their accounts via mobile applications or computer platforms (American Banking Association, 2023), while online transfers and electronic payments have become the prevailing methods of conducting transactions (Eurostat, 2023).
Although growth has recently emerged in research on artificial intelligence and automation in the banking industry and how it impacts consumer behavior (see Hentzen et al., 2022 for a comprehensive literature review), existing studies have not fully explored consumer needs, attitudes, and preferences regarding the transition from human-led to AI-informed financial services delivery and its implications (Mogaji et al., 2022). In the financial services industry, employees play a fundamental role in meeting consumer needs (Bahadur et al., 2020; Wieseke et al., 2012) and how consumers perceive employees compared to automation affects financial behavior (Raza et al., 2023; Northey et al., 2022; Lee and Wang, 2023; Chou et al., 2023; Riedel et al., 2022; Zhang et al., 2021). However, research on the variables that affect consumer performance expectancy is scant (Wang et al., 2017; Shaikh and Karjaluoto, 2015). In spite of the surge in banking and finance digital solutions, research to date has not yet determined the key investor-related characteristics that drive their adoption (Fan, 2022; Hentzen et al., 2022). Furthermore, the determinants of successfully providing financial services through automation remain an open question (Zhang et al., 2021). This study aims to fill this gap by investigating whether consumers vary in their cognitive schema toward automated systems—in other words, the perfect automation schema (PAS) (Merritt et al., 2015)—and if this individual characteristic is related to automated system performance expectancy in the banking sector.
Based on a gender and education stratified sample of Italian adults, a set of ordered probit regressions is used in this study to examine whether and how consumer PAS is related to their bank automation performance expectancy compared to that of employees.
Previous findings highlight that country-level cultural context influences an individual's attitudes toward algorithms, and individualistic countries are less likely to follow algorithms (Duan et al., 2019; Rau et al., 2009). Moreover, the literature shows that the performance expectancy construct is especially relevant in countries with cultures of high individualism (Zhang et al., 2018), and, according to Hofstede, Italy has a high individualism index. Finally, Italy lags behind other European countries in digital technology usage, as revealed by the Digital Economy and Society Index (2022) and shows a very low adoption rate in digital financial services (Dumicic et al., 2015; Filotto et al., 2021; Migliore et al., 2022; Statista, 2023a, b). Therefore, we conducted a single-country study focused on Italy. Given the influence of individual factors in shaping interactions with automated systems and financial behavior (Lusardi and Mitchell, 2011; Grable et al., 2014; Deloitte, 2019; Andreou and Anyfantaki, 2021; Mahmud et al., 2022) we also explore the roles played by variables related to financial well-being, financial literacy, demographics, and socioeconomic status. We further perform some robustness analyses to check our results, including running an instrumental variable (IV) two-stage least squares (2SLS) regression.
Our findings show that consumer cognitive schema affect their tendency to believe that, compared to human bank employees, automated banking systems are more prone to error. Subjects who display stronger PAS are more likely to believe that automated banking systems are efficient and less error prone than bank employees. This result is not obvious, since the perception of automation in general contexts cannot be directly transposed into the banking domain given consumers' tendency to have different perceptions of automation applied to specific risky contexts, such as medical or military ones (Longoni et al., 2019; Pearson et al., 2019). Moreover, generalizing the findings from other decision domains is not possible because the literature shows the influence of high-level factors on automation adoption (Lourenço et al., 2020; Mahmud et al., 2022); consequently, the banking sector deserves specific investigation.
The results also confirm the relevance of financial knowledge, anxiety, and security for financial behavior. Findings show that performance expectancy in banking is related to other individual differences and that higher levels of financial anxiety and knowledge are associated with more positive bank automation performance expectancies compared to those of employees. Conversely, the more secure a subject feels with their current and future financial situation, the lower their performance expectancy of automated banking systems.
Our study's contribution to the literature is threefold. First, to the best of our knowledge, this is the first study to explore the influence of cognitive schema on consumer bank performance expectancy; thus, it contributes to the literature on individual differences and financial decision-making. The literature on automation and artificial intelligence tends to explore the effects of AI and automation on consumers' psychological consequences and behaviors (Cui, 2022; van Esch and Cui, 2021; van Esch and Stewart Black, 2021; van Esch et al., 2021a, b). However, in this study, we step back to investigate what drives consumer performance expectancy of bank automation compared to that of employees; understanding such drivers is crucial in affecting intention to use and actual usage of digital solutions (Wang et al., 2017; Gan et al., 2021; Cheng-Xi Aw et al., 2023; Rühr et al., 2019; Nourallah, 2023). Second, previous studies have shown the importance of the industry in which automation is embedded in its effect on subject preferences and behavior (Dietvorst et al., 2015; Berger et al., 2021; Kawaguchi, 2021). Thus, we contribute to the literature that investigates the banking sector. This deserves special attention because it is a high-involvement service context characterized by high personal relevance and is therefore dominated by high-touch personal relationship service delivery (Vlaev et al., 2009; Zhang et al., 2021). Finally, we contribute to the literature on algorithmic decision-making by exploring the influence of individual, organizational, and cultural factors.
The remainder of this paper is organized as follows. Section 2 reviews the existing literature and states the main research hypothesis, while Section 3 describes the methods, questionnaire, data collection, variable measures, and econometric models. Section 4 presents the empirical results, Section 5 discusses the key findings, and Section 6 draws some conclusions.
2. Literature review and hypothesis development
Our study relates to two different streams of research in the financial services industry: the literature on performance expectancy and that on comparisons between human employees and automation.
In recent decades, automation has strengthened banking services, benefiting many users (Mogaji et al., 2021a, b). Nevertheless, marketing researchers emphasize that it is a challenge to understand the factors that drive its success (Sheth et al., 2022). Although automation in banking is associated with many advantages for consumers, empirical investigations reveal that consumers still prefer human interactions and tend to perceive AI performance as inferior to that of employees (Zhang et al., 2021). Consequently, consumer acceptance of automation is generally low (Hildebrand and Bergner, 2020; Wexler and Oberlander, 2021; Zhang et al., 2021).
Over time, numerous theories have been proposed to pinpoint the factors that drive technology acceptance. One of these, the unified theory of acceptance and use of technology (UTAUT), is considered the most comprehensive research model for predicting consumer behavior, including in banking (Alalwan et al., 2017; Martins et al., 2014), since it is able to explain about the 70% of the variance in behavioral intentions. This theory highlights the prominent role of performance expectancy as one of the primary determinants of technology adoption (Cheng-Xi Aw et al., 2023). Performance expectancy is defined as the degree to which individuals believe automation can help improve the performance of jobs or other activities (Venkatesh et al., 2003, 2012). It is considered the strongest predictor of behavioral intentions, which, in turn, have a significantly positive influence on technology usage (Venkatesh et al., 2003, 2012). Performance expectancy also has a strong effect on intention to use and usage of automation in the banking and finance sector (Wang et al., 2017; Shaikh and Karjaluoto, 2015). Conducting a weight and meta-analysis of 57 articles and 58 datasets, Baptista and Oliveira (2016) find that performance expectancy has a positive and statistically significant relationship with intention to use mobile banking services. This intention is directly and positively related to usage and has a direct positive and statistically significant relationship with mobile banking use itself. Akhlaq and Ahmed (2013) and Wang et al. (2017) report that performance expectancy significantly impacts acceptance of e-banking. Investigating the pandemic period, Gan et al. (2021) observe that performance expectancy drives consumer intention to subscribe to online financial robo-advisors. Focusing on a large consumer panel survey in China, Cheng-Xi Aw et al. (2023) observe that performance expectancy is crucial for robo-advisory service acceptance, while Rühr et al. (2019) find that performance expectancy has a significantly positive effect on intention to use an investment management system. Studying young retail investors in Malaysia and Sweden, Nourallah (2023) observes that trust in financial robo-advisors and behavioral intentions to use this technology are strictly related to performance expectancy.
Recent research on the UTAUT model has expanded to investigate how cultural values impact consumer intentions' adoption of digital financial services. Studies indicate that cultural values – measured using Hofstede's cultural dimensions - play a significant role in shaping the adoption rates of these services, providing insights into why they vary across countries (Blut et al., 2022). Examining one of the key variables in the UTAUT model, such as performance expectancy, a cross-country comparison study found that individualism is a significant culture-related factor that enhances the effect of performance expectancy on the intention to adopt digital financial services (Migliore et al., 2022). Italy, which ranks high in individualism (with a score of 76 compared to China's 20; Hofstede, 2001), also has a notably low adoption rate for digital financial services. Previous studies highlight a substantial adoption gap in mobile payment systems (Migliore et al., 2022), indicating that Italy shows resistance to direct banking (Filotto et al., 2021). Italy ranks among the lowest for digital financial service adoption among the 27 EU Member States (Dumicic et al., 2015). Given these factors, examining the performance expectations of Italian consumers with regard to bank automation could yield valuable insights into the low adoption rates of digital financial services in the country.
The present study also relates to the stream of research in the financial services industry that focus on comparisons between human employees and automation. In the retail financial industry, consumers have relevant bargaining power since they can compare the financial products and services offered by financial intermediaries with those offered by competitors (Raza et al., 2023). In this type of market, employee performance becomes highly relevant (Aburayya et al., 2020; Liao and Chuang, 2004); thus, the financial services industry is one where employees play an essential role in meeting consumer needs (Bahadur et al., 2020; Wieseke et al., 2012). The literature on customer-bank relationships suggests that for enduring relationships—which are important for bank profitability—employee conduct is crucial since it affects both perceptions of service performance and the subsequent behavioral outcomes (Lachance and Tang, 2012; Wasan, 2018). In fact, in service encounters between customers and employees, the latter are usually considered primarily responsible for favorable or unfavorable performance (Swanson and Davis, 2003).
Few studies have focused on consumer perceptions of employees compared to perceptions of automation and how these perceptions influence financial behavior. Raza et al. (2023) explore how consumer perceptions of frontline employees' empathy and customer orientation affect their opinions regarding employee performance; they observe a significant role of the latter, with trust playing a mediating role. Northey et al. (2022) investigate whether and how investment intention in a retail banking context is affected by advisor type, comparing a human advisor to a robo-advisor; their experimental approach shows that the customer level of involvement, belief in the information conveyed, and perception of the bank's customer focus play crucial roles in investment decisions. Lee and Wang (2023) examine the influence of push, pull, and mooring factors on customer intentions to switch from traditional wealth management services to mobile wealth management applications. They detect the influences of perceived inconvenience, transaction efficiency, perceived personalization, mobile wealth management scenarios, affective commitment, and product market expertise. Chou et al. (2023) further explore the relationship between robo-advisors and traditional banking, highlighting that financial consultant and bank institution trust are antecedents of banks' intangible value binding in robo-advisor services. Also focusing on the financial advisory context, Riedel et al. (2022) study artificial intelligence vs human delivery of financial advice and report that political ideology, emotions, trust, and investment amount impact marketing outcomes such as consumer word-of-mouth and brand attitudes. In the same research stream, Zhang et al. (2021) focus on the perceptions of robo-advisors compared to those of human advisors with high/low expertise, in terms of trust, performance expectancy, and intention to use. They observe that consumers prefer human expert financial advisors with high expertise to robo-advisors and expect better performance from human advisors.
Table 1 presents an overview of the existing literature in this topic area and the related findings.
Overview of the most relevant studies on consumer perceptions of human employees vs automation in the banking industry
| Authors | Focus/aim | Setting | Methodology | Sample | Results | Variables | Theoretical contributions | How our study extends previous findings |
|---|---|---|---|---|---|---|---|---|
| Raza et al. (2023) | The relationship between frontline employee empathy/client orientation, consumer trust, and frontline employee performance | Pakistan | Survey | 375 | Customer perceptions of frontline employee consumer orientation is positively related to the extent they perceived them as performant | Mediator: trust | They underscore the importance of applying social exchange theory, which indicates that employees' strategic personal resources encourage reciprocal interactions, ultimately enhancing their performance perception | Our study delves into the variables that are related to performance perception, comparing automation to employees Our study suggests that in investigating the link between employees' personal resources and clients' perception of their performance is important to take into account the clients' cognitive schema |
| Northey et al. (2022) | Influence of the advisor type (human vs robo) on investment intentions | US | Experiments (between subjects) | Study 1: 165 Study 2: 299 | When the level of involvement is high, consumers believe the financial advice provided by a human over that of a robo-advisor | Dependent variable (DV): intention to invest Independent variable (IV): advisor type and involvement Mediators: belief in the financial advice; firm's perceived customer orientation | Their research expands on the factors that lead to adoption by uncovering an inhibiting role of robo-advisors. They also identify the conditions under which this occurs and the underlying psychological processes that drive these effects | Our study investigates the antecedents of attitudes toward automation vs attitudes toward human employees in banking, extending studies that focus on advisor type. We also consider a different geographical setting. Finally, we expand the theory on the underlying psychological process which affect customers' performance expectancy |
| Riedel et al. (2022) | Influence of the advisor type (human vs AI) on marketing outcomes | US | Online experiment | Study 1: 174 Study 2: 440 Study 3: 187 | AI is associated with lower levels of word of mouth (WOM) and brand attitude compared to human advisors | DV: WOM, brand attitudes Mediators: emotion, trust Moderators: political ideology | Following the affect-as-information theory, their research demonstrates that in AI-based financial services, emotional responses serve as a source of information that shapes the evaluation of the service, impacting trust and subsequently marketing outcomes | |
| Lee and Wang (2023) | Users' intentions to switch from traditional wealth management services to mobile settings (apps) | China | Survey | 378 | Switching intention is affected by several push (i.e. perceived inconvenience), pull, or mooring factors | DV: switching intentions IV: perceived information asymmetry; perceived inconvenience; ubiquity; transaction; perceived personalization; mobile wealth management scenarios; affective commitment; wealth management product market expertise; switching costs (sunk costs and setup costs) | They apply the push-pull-mooring framework to explore the main factors that lead users to transition from traditional wealth management services to mobile wealth management apps | Our paper extends these findings on the evidence that perceived inconvenience affects individuals' behavioral willingness and consumer behavior focusing on an original antecedent of performance expectancy |
| Chou et al. (2023) | The importance of bank intangible value binding in customers' robo-advisory adoption and the influence of trust in the banking institution and the financial consultant | Taiwan | Survey | 228 | Intangible value bindings mediate the relationship between trust and consumer willingness to adopt robo-advisors. Consumers' investment amounts negatively impacts the positive relationship between intangible value binding and robo-advisor adoption intention | DV: robo-advisor adoption intentions IV: financial consultant trust, bank institution trust Mediator: intangible value binding Moderator: amount of customer investment in the bank per year | Their study presents a holistic approach, highlighting the value of bank intangible value bindings in driving customers' adoption of robo-advisors. They suggest a hybrid model that blends robo-advisors with traditional banking, promoting the acceptance of robo-advisors | Our study extends research on the driver of automation adoption by shedding light on an individual variable that affects automation performance expectancy compared to that of employees. Our study contributes to theory by examining how cognitive processes affect the factors leading to the acceptance of digital services |
| Zhang et al. (2021) | Individual differences in perceptions of trust, performance expectancy, and intention to hire human vs robo-advisors, with low/high levels of expertise | US | Online experiment | Study 1: 188 Study 2: 189 Study 3: 185 | Consumers trust expert humans more, expect better performance, and express greater intention to hire them compared to a robo-advisor | DV: performance expectancy, trust IV: advisor type, expertise | Building on research related to the adoption of self-service technology (SST), this study analyzed perceptions of robo vs human advisors, focusing also on performance expectancy | Our study extends research on individual differences in perceived performance expectancy considering the perfect automation schema as a new variable. Our study offers a theoretical contribution by recommending that researchers consider customers' cognitive schemas when examining the adoption of SST |
Source(s): Created by authors
How humans interact with automation, robots, and machines has been investigated by interdisciplinary and cross-disciplinary research in fields such as social cognition, psychology, robotics, and neuroscience; the findings show that individual reactions to automation are not straightforward (Logg et al., 2019; Longoni et al., 2019; Cui, 2022). Some studies reveal that, when interacting with automation, individuals use different cognitive schemas (Madhavan and Wiegmann, 2007; Lyons and Guznov, 2018; Merritt et al., 2015; Parasuraman and Riley, 1997; Lou et al., 2022). According to the psychology literature, a schema is a framework of cognitive knowledge that subjects use to organize information when dealing with a specific concept, topic, or stimulus (Fiske and Linville, 1980) to interpret and make sense of the world around them (Fiske and Taylor, 1991). In their seminal work, Dzindolet et al. (2002) observe that when provided with human and automated aids, subjects tended to underutilize both types and prefer to rely on themselves. To explain their behavior when using the automated aid rather than the human one, subjects indicated specific errors they believed the aid had committed, thus showing the crucial role of performance expectancy. Schemas are widely applied to consumer behavior, and marketing research has found that they are particularly useful in studying consumer preferences (Sjödin and Törn, 2006; Fournier, 1998; Boush and Loken, 1991; Rossiter et al., 1991; Lou et al., 2022). Consumers' cognitive schemas significantly influence their expectations (Stayman et al., 1992). Discrepancy theory suggests that these expectations, especially those related to performance, are closely tied to satisfaction (Wirtz and Mattila, 2001). A discrepancy arises when a consumer's actual experience does not align with their expectations. If reality falls short of expectations (negative discrepancy), it can result in unfavorable outcomes. On the other hand, a positive discrepancy—where reality exceeds expectations—often leads to favorable outcomes (Torres and Kline, 2013). By examining the relationship between performance expectations and actual experience, discrepancy theory provides a useful framework for understanding consumer behavior.
Given that individuals differ in their representations of automation performance expectancy and that these representations might be affected by different cognitive schemas (Lou et al., 2022), PAS appears to be a useful construct for analyzing bank automation performance expectancy compared to that of employees. PAS consists of two complementary dimensions relating to subjects' expectations of automation performance and errors. The high expectations dimension captures the degree to which people expect automation to perform with near-perfect reliability. The all-or-none dimension captures the degree to which people expect automation to work perfectly or not at all (Merritt et al., 2015). We posit that the general cognitive schema toward automation translates into bank automation performance expectancy compared to that of bank employees so that subjects with stronger PAS have more positive performance expectancy of automated banking systems than they do of bank employees. We thus formulate the following hypothesis:
Consumer PAS is positively related to consumer bank automation performance expectancy.
3. Methods
3.1 The questionnaire
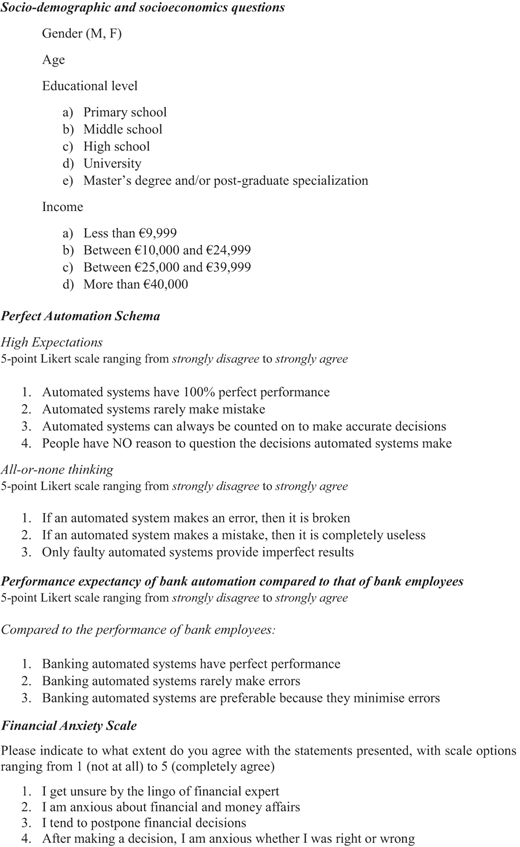
The questionnaire was organized into three sections. The first section included four items to collect certain sociodemographic and socioeconomic information from the subjects: gender, age, education, and income level. Previous research shows that these characteristics are related to financial behaviors and attitudes (Ambuehl et al., 2014; Finke et al., 2017) and algorithmic decision making (Mahmud et al., 2022). Therefore, we include them as control variables in our model estimation to gain more nuanced estimates of the partial effects of PAS on subjects' bank automation performance expectancy compared to that of employees.
In the second part of the survey, the subjects' feelings toward automation systems were evaluated. PAS was assessed using the 7-item scale created by Merritt et al. (2015). Four items assessed high expectations (PAS1); an example item was: “Automated systems rarely make mistakes.” Three items assessed all-or-none thinking (PAS2); an example item was, “If an automated system makes an error, then it is broken.” All items were evaluated using a 5-point Likert-type scale ranging from strongly disagree to strongly agree. We measured the performance expectancy of bank automation compared to performance expectancy of employees (Bank_automation_perf) with three items developed by the authors. These items asked subjects to evaluate (using a scale ranging from one (strongly disagree) to five (strongly agree) the extent to which they believed that, compared to bank employees, bank automation systems: (1) are perfect, (2) rarely make mistakes, and (3) are preferable because they have lower error rates. Instead of measuring performance as the likelihood that automation will lead to a positive outcome, we relied on a multi-item measure for performance expectancy adapted from Zhang et al. (2021) that compares automation to human employees (Northey et al., 2022; Riedel et al., 2022). The higher the index, the more positive the performance expectancy of automated banking systems compared to that of employees. To ensure the equivalence of the translated Italian version of the PAS questionnaire and the original version, translation and back-translation were performed into their mother tongues by two independent translators.
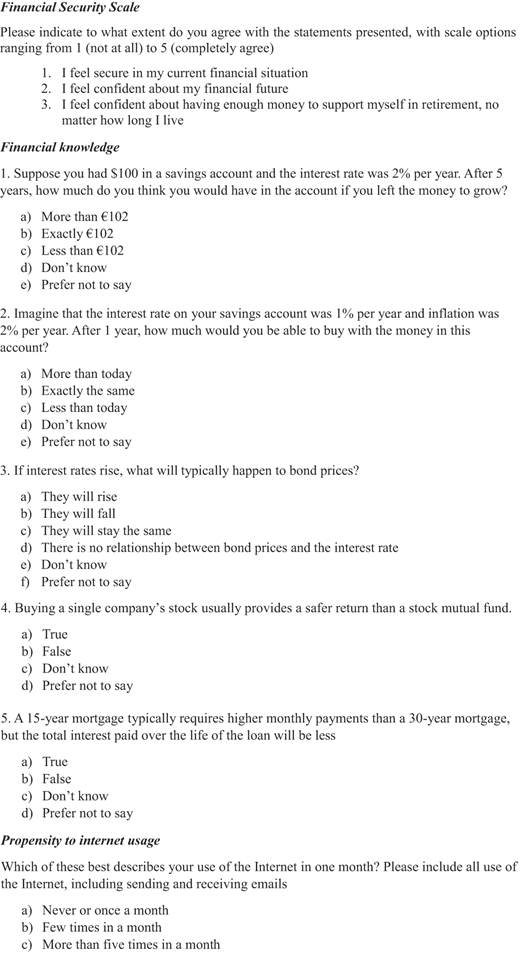
The previous literature underlines the importance of considering financial well-being and knowledge when studying financial behavior (Grable et al., 2014; Lusardi and Mitchell, 2011; Andreou and Anyfantaki, 2021; Deloitte, 2019). Therefore, in the survey's third section, we included the Financial Anxiety Scale (FAS) (four items) (Fünfgeld and Wang, 2009) and Financial Security Scale (FSS) (three items) (Strömbäck et al., 2017). The subjects were asked to indicate to what extent they agreed with the statements presented, with scale options ranging from 1 (not at all) to 5 (completely agree). An example item related to FAS is “I am anxious about my financial matters and those related to money in general,” while an example item of the FSS scale is “I feel safe in my current financial situation.” To obtain the final variables, we used the average score obtained from the four and three items, respectively. To measure financial knowledge (FK), we presented the so-called “big five” questions, that is, the Lusardi and Mitchel questions (Lusardi and Mitchell, 2011), which include questions about inflation, the time value of money, mortgage interest, risk diversification, and the relationship between interest rates and bond prices. We assigned 1 point for each question the respondent answered correctly and zero for each question answered incorrectly.
To obtain a general proxy for subjects' propensity to use automation solutions (the Internet), we asked how frequently they used the Internet in one month (including all use of the Internet, such as sending and receiving emails).
The variables used in the study and their definitions are presented in Table 2, while all questions are listed in the Appendix.
Variables and definitions
| Symbol | Definition |
|---|---|
| bank_automation_perf | Subjects' performance expectancy of bank automation compared to that of employees—three items (range 1–5) |
| PAS 1 (high expectations) | Expectation that automated systems will perform with near-perfect reliability—four items from Merrit et al. (2015) (range 1–5) |
| PAS2 (all-or-none thinking) | Expectation that automation systems either work perfectly or not at all— three items from Merrit et al. (2015) (range 1–5) |
| PAS_total | Self-reported measures of perfect automation schema computed as the average of the sum of PAS1 and PAS2 (Merrit et al., 2015) |
| strong_PAS | Strong tendency to have positive expectations of automated system performance measured as a dummy variable that equals 1 if respondent's PAS is at least equal to 3 |
| FAS | The Financial Anxiety Scale measures subjects' anxiety related to money matters using four items from Fünfgeld and Wang (2009) (range 1–5) |
| FSS | The Financial Security Scale measures subjects' perceived security related to money matters using three items from Strömbäck et al. (2017) (range 1–5) |
| FK | The Financial Knowledge Score is the sum of the number of correct responses to the Big5 financial literacy questions (Lusardi and Mitchell, 2011) (range 1–5) |
| GEND | A dummy variable that equals 1 if the respondent is a woman, and zero otherwise |
| AGE | Age of respondent. We consider different age groups and include a dummy variables for each age group |
| EDU | Educational level, distinguishing among students up to primary, middle, high school, university degree, and PhD/post degree master |
| INC | Income level is the natural logarithm of family income reported by the respondent |
| Internet | A proxy for propensity to use automation systems based on how frequently respondents use the Internet in one month (never/once a month, a few times in a month, more than five times in a month). Three different dummy variables are included, one for each category |
Source(s): Created by authors
3.2 Sample
This study utilized a web-based online survey. The survey link was shared through a call posted on a major Italian university bulletin board; students were asked to share the questionnaire with other adults. To determine the size required based on the desired power, we used G*Power software (Faul et al., 2007, 2009), which showed that we would need at least 533 respondents to detect a medium effect at 95% power. Following Lee et al. (2020) we set the following parameters to calculate the appropriate sample size: effect size—0.25, alpha—0.05, and power—0.95. Over a period of one week, the survey was accessed 709 times. Responses that were incomplete were removed, leaving 572 valid and complete responses; based on the power analysis, this size is adequate for this study. Our demographic analysis indicates that 49.65% of our subjects are women (n = 284) and about half of the sample (58.39%, n = 334) are subjects between 19 and 25 years old. In terms of education and income, 67.13% (n = 384) of them have at least a college degree, and 68.49% (n = 389) have income lower than 10,000 euros. The sample is stratified in terms of gender and educational level, representative of the composition of the distribution of Italian adults. In term of age, the sample is slightly slanted toward younger individuals, due in part to the initial use of university students as subjects. We initially distributed our questionnaire among university students; only in a second step it was distributed to other adults. However, although mainly based on university students, our sample is in line with other studies that investigate customer behaviors by collecting information from students (see, e.g. Bongini and Cucinelli, 2019; Aydin and Akben Selcuk, 2019). Table 3 reports the sample composition.
Sample description
| Variables | N | % |
|---|---|---|
| Gender | 288 | 50.35 |
| Male | 284 | 49.65 |
| Female | ||
| Age | 334 | 58.39 |
| 19–25 | 41 | 7.17 |
| 26–35 | 13 | 2.27 |
| 36–45 | 79 | 13.81 |
| 46–55 | 77 | 13.29 |
| 56–65 | 8 | 1.4 |
| >65 | ||
| Education | 152 | 26.22 |
| University or postgraduate | 384 | 67.13 |
| High school | 36 | 6.29 |
| Less than high school | ||
| Income (euros) | 389 | 68.49 |
| Less than 10K | 106 | 18.66 |
| 10–24K | 51 | 8.63 |
| 25–39K | 26 | 4.23 |
| More than 40K | 572 | 100 |
| Total |
Note(s): Table 3 reports the sample descriptive statistics with the number of observations and percentage of each category
Source(s): Created by authors
3.3 Regression analyses
Since our dependent variable can assume values ranging from 1 to 5, to detect the determinants of subjects' banking automation system performance expectations, we run an ordered probit regression as shown in Eq. (1) (Model 1):
where Y is the dependent variable bank_automation_perf measured for each individual i. As independent variables, we include all variables described in Section 3.1: PAS, FAS, FSS, FK, and the sociodemographic and socioeconomic characteristics. Research highlights that the probability that a person engages the service of a human financial adviser decreases when the level of financial anxiety is high (Grable et al., 2014), thus a positive relationship between financial anxiety (FAS) and bank_automation_perf can be expected. Industry report reveal that subjects with high financial security tend prefer human relationship (Deloitte, 2019), thus we expect a negative relationship between FSS and bank_automation_perf. Since literature suggests that low levels of financial literacy could be holding consumers back from the embracement of digital channels (Andreou and Anyfantaki, 2021), we expect a positive relationship between FK and bank automation performance expectancy. AGE, EDU, and INC refer to a vector composed of several dummy variables, one for each category identified. is the error term.
As specified in Section 3.1 and Table 2, following Merritt et al. (2015), we distinguish the two components of PAS—high expectation (PAS1) and all-or-non thinking (PAS2)—and include them in the same regression model (Model 2). In a third regression model, to detect the relationship between a high PAS score and subjects' bank automation system performance expectancy, we include strong_PAS as an independent variable (Model 3). Thus, PAS alternatively assumes the values of PAS_total when we consider the average of PAS1 and PAS2; PAS1 or PAS2, when we include both PAS components in the regression; and strong_PAS when we insert a dummy that equals 1 if respondents had an average PAS_total higher than 3.
4. Results
4.1 Summary statistics
Table 4 reports the descriptive statistics of all variables included in the empirical model. On average, individuals show positive performance expectancy of automated banking systems (M = 3.138, SD = 0.727) and high expectations of automated systems in general. The PAS2 variable, on average, equals 2.698 (SD = 0.609) out of a total of 5; that is, higher than the average (2.5) but lower than the PAS1 score. Individuals show a high level of anxiety about money matters (M = 3.021, SD = 0.633) but also demonstrate high perceived security in their current and future financial situations (M = 3.067, SD = 0.696). The subjects' financial knowledge is not very high (M = 2.469, SD = 1.577); this is consistent with country results that highlight Italians' low level of financial knowledge (see, e.g. di Salvatore et al., 2018). Cronbach's alphas are reported in the first column of Table 5. In all cases, the alphas are above or very close to 0.7, revealing that the constructs have good internal consistency (Hair et al., 2014; Zeinalizadeh et al., 2015; Vieira et al., 2021).
Descriptive statistics
| Variables | M | Median | SD | Min | Max |
|---|---|---|---|---|---|
| bank_automation_perf | 3.138 | 3.000 | 0.727 | 1.000 | 5.000 |
| PAS1 | 3.049 | 3.000 | 0.680 | 1.000 | 5.000 |
| PAS2 | 2.698 | 2.667 | 0.609 | 1.000 | 5.000 |
| PAS_total | 2.873 | 2.875 | 0.505 | 1.000 | 5.000 |
| FK | 2.469 | 3.000 | 1.577 | 0.000 | 5.000 |
| FAS | 3.021 | 3.000 | 0.663 | 1.250 | 5.000 |
| FSS | 3.067 | 3.000 | 0.696 | 1.000 | 5.000 |
| GEND: female | 0.497 | 0.000 | 0.500 | 0.000 | 1.000 |
| AGE__19–25 | 0.584 | 1.000 | 0.493 | 0.000 | 1.000 |
| AGE__26–35 | 0.072 | 0.000 | 0.258 | 0.000 | 1.000 |
| AGE__36–45 | 0.023 | 0.000 | 0.149 | 0.000 | 1.000 |
| AGE__46–55 | 0.138 | 0.000 | 0.345 | 0.000 | 1.000 |
| AGE__56–65 | 0.133 | 0.000 | 0.340 | 0.000 | 1.000 |
| EDU: univ | 0.262 | 0.000 | 0.440 | 0.000 | 1.000 |
| EDU: high sch | 0.671 | 1.000 | 0.470 | 0.000 | 1.000 |
| INC: <10K | 0.685 | 1.000 | 0.465 | 0.000 | 1.000 |
| INC: 10–24K | 0.187 | 0.000 | 0.390 | 0.000 | 1.000 |
| INC: 25–39K | 0.086 | 0.000 | 0.281 | 0.000 | 1.000 |
Note(s): Table 4 reports the descriptive statistics of the variables included in the empirical models. The Table shows the average score, median value, standard deviation, minimum, and maximum for each variable
Source(s): Created by authors
Correlation matrix
| Cronbach's alpha | 1 | 2 | 3 | 4 | 5 | 6 | 7 | 8 | 9 | 10 | 11 | 12 | 13 | 14 | 15 | 16 | 17 | 18 | ||
|---|---|---|---|---|---|---|---|---|---|---|---|---|---|---|---|---|---|---|---|---|
| 1 | PAS_total | 0.727 | 1.00 | |||||||||||||||||
| 2 | PAS1 | 0.841 | 0.81* | 1.00 | ||||||||||||||||
| 3 | PAS2 | 0.697 | 0.76* | 0.23* | 1.00 | |||||||||||||||
| 4 | FAS | 0.699 | 0.05 | −0.04 | 0.13* | 1.00 | ||||||||||||||
| 5 | FSS | 0.723 | −0.18* | −0.14* | −0.13* | 0.28* | 1.00 | |||||||||||||
| 6 | FK | 0.01 | 0.10* | −0.09* | −0.13* | 0.03 | 1.00 | |||||||||||||
| 7 | GEND: female | −0.11* | −0.10* | −0.07 | 0.14* | 0.12* | −0.20* | 1.00 | ||||||||||||
| 8 | AGE__19–25 | −0.16* | −0.02 | −0.24* | 0.03 | 0.13* | −0.13* | −0.02 | 1.00 | |||||||||||
| 9 | AGE__26–35 | −0.01 | −0.02 | 0.01 | −0.06 | 0.01 | −0.04 | 0.01 | −0.34* | 1.00 | ||||||||||
| 10 | AGE__36–45 | −0.01 | 0.03 | −0.06 | −0.05 | −0.04 | 0.08 | 0.05 | −0.18* | −0.04 | 1.00 | |||||||||
| 11 | AGE__46–55 | 0.11* | 0.03 | 0.14* | −0.04 | −0.01 | −0.01 | 0.08 | −0.47* | −0.11* | −0.06 | 1.00 | ||||||||
| 12 | AGE__56–65 | 0.15* | 0.04 | 0.20* | 0.03 | −0.11* | 0.21* | −0.06 | −0.47* | −0.11* | −0.06 | −0.16* | 1.00 | |||||||
| 13 | EDU: univ | −0.03 | −0.05 | 0.00 | −0.03 | −0.03 | 0.03 | 0.09* | −0.14* | 0.28* | 0.11* | −0.06 | 0.06 | 1.00 | ||||||
| 14 | EDU: high Sch | 0.03 | 0.08* | −0.04 | 0.00 | 0.05 | 0.01 | −0.07 | 0.29* | −0.26* | −0.11* | −0.01 | −0.07 | −0.86 | 1.00 | |||||
| 15 | INC: <10K | −0.12* | −0.05 | −0.14* | 0.06 | 0.15* | −0.15* | 0.06 | 0.50* | −0.08 | −0.09* | −0.25* | −0.39* | −0.16 | 0.16* | 1.00 | ||||
| 16 | INC: 10–24K | 0.07 | 0.02 | 0.09* | 0.00 | −0.03 | 0.07 | 0.02 | −0.27* | 0.10* | 0.03 | 0.20* | 0.11* | 0.05 | −0.08* | −0.71* | 1.00 | |||
| 17 | INC: 25–39K | 0.04 | 0.03 | 0.03 | −0.07 | −0.11* | 0.08 | −0.04 | −0.32* | −0.01 | 0.13* | 0.12* | 0.30* | 0.14 | −0.10* | −0.45* | −0.14* | 1.00 |
Note(s): *p < 0.05
Source(s): Created by authors
Table 5 reports the correlations among the independent and control variables included in the empirical analysis; these correlations have low values. Interestingly, in line with the previous literature (Merritt et al., 2015), the correlation between the variables PAS1 and PAS2 is low (r = 0.23), suggesting that while it is possible that high expectations and all-or-none thinking operate in conjunction, they also represent distinct constructs.
Table 6 presents the Variance Inflation Factors (VIF). VIF results indicate the absence of multicollinearity problems between the independent variables, with values well below 10 (Thompson et al., 2017) and the mean ranging from 3.21 to 3.33.
Variance inflation factors (VIF)
| Variable | Model 1 | Model 2 | Model 3 | |||
|---|---|---|---|---|---|---|
| VIF | 1/VIF | VIF | 1/VIF | VIF | 1/VIF | |
| AGE__19–25 | 7.32 | 0.137 | 7.36 | 0.136 | 7.27 | 0.138 |
| INC: <10K | 6.62 | 0.151 | 6.63 | 0.151 | 6.74 | 0.148 |
| EDU: univ | 5.15 | 0.194 | 5.15 | 0.194 | 5.05 | 0.198 |
| EDU: high sch | 5.12 | 0.195 | 5.12 | 0.195 | 5.03 | 0.199 |
| INC: 10–24K | 4.79 | 0.209 | 4.8 | 0.208 | 4.89 | 0.204 |
| AGE__56–65 | 4.07 | 0.246 | 4.08 | 0.245 | 4.01 | 0.250 |
| AGE__46–55 | 3.87 | 0.258 | 3.87 | 0.258 | 3.86 | 0.259 |
| AGE__26–35 | 2.88 | 0.347 | 2.88 | 0.347 | 2.9 | 0.345 |
| INC: 25–39K | 2.85 | 0.351 | 2.85 | 0.351 | 2.84 | 0.352 |
| AGE__36–45 | 1.56 | 0.640 | 1.57 | 0.637 | 1.61 | 0.622 |
| FSS | 1.2 | 0.835 | 1.2 | 0.835 | 1.18 | 0.850 |
| FAS | 1.16 | 0.861 | 1.18 | 0.851 | 1.16 | 0.864 |
| FK | 1.14 | 0.877 | 1.17 | 0.851 | 1.16 | 0.863 |
| GEND: female | 1.12 | 0.889 | 1.13 | 0.888 | 1.12 | 0.897 |
| PAS_total | 1.1 | 0.906 | ||||
| PAS1 | 1.11 | 0.898 | ||||
| PAS2 | 1.23 | 0.815 | ||||
| PAS_strong | 1.05 | 0.949 | ||||
| Mean VIF | 3.33 | 3.21 | 3.32 | |||
Source(s): Created by authors
4.2 Regression results
Table 7 shows the results from the ordered probit regression conducted to ascertain the effects of PAS and individual characteristics on the likelihood that subjects have positive performance expectancies of bank automation.
Results of ordered probit regression: dependent variable is performance expectancy of bank automation compared to that of employees
| Model 1 | Model 2 | Model 3 | |||||||||||||
|---|---|---|---|---|---|---|---|---|---|---|---|---|---|---|---|
| β | SE | 95% CI | p | β | SE | 95% CI | p | β | SE | 95% CI | p | ||||
| LL | UL | LL | UL | LL | UL | ||||||||||
| PAS_total | 1.328 | 0.102 | 1.128 | 1.529 | 0.000*** | – | – | – | – | – | – | – | – | – | – |
| PAS1 | – | – | – | – | – | 1.188 | 0.079 | 1.034 | 1.342 | 0.000*** | – | – | – | – | – |
| PAS2 | – | – | – | – | – | 0.111 | 0.081 | −0.048 | 0.269 | 0.171 | – | – | – | – | – |
| strong_PAS | – | – | – | – | – | – | – | – | – | – | 0.887 | 0.098 | 0.696 | 1.079 | 0.000*** |
| FK | 0.088 | 0.029 | 0.031 | 0.145 | 0.003** | 0.043 | 0.010 | −0.057 | 0.142 | 0.089† | 0.049 | 0.011 | −0.046 | 0.143 | 0.090† |
| FAS | 0.235 | 0.141 | −0.041 | 0.511 | 0.095† | 0.403 | 0.139 | 0.132 | 0.675 | 0.004** | 0.290 | 0.136 | 0.024 | 0.555 | 0.033* |
| FSS | −0.252 | 0.135 | −0.516 | 0.013 | 0.062† | −0.227 | 0.133 | −0.487 | 0.033 | 0.087† | −0.266 | 0.134 | −0.529 | −0.003 | 0.047* |
| GEND: female | −0.115 | 0.089 | −0.289 | 0.059 | 0.196 | −0.150 | 0.088 | −0.323 | 0.023 | 0.090† | −0.173 | 0.089 | −0.347 | 0.001 | 0.051† |
| AGE_19–25 | 0.897 | 0.262 | 0.384 | 1.410 | 0.001*** | 0.795 | 0.248 | 0.309 | 1.282 | 0.001*** | 0.605 | 0.243 | 0.129 | 1.081 | 0.013* |
| AGE _26–35 | 0.607 | 0.307 | 0.006 | 1.207 | 0.048* | 0.564 | 0.298 | −0.021 | 1.149 | 0.059† | 0.547 | 0.292 | −0.026 | 1.119 | 0.061† |
| AGE _36–45 | 0.809 | 0.426 | −0.026 | 1.644 | 0.058† | 0.621 | 0.429 | −0.220 | 1.462 | 0.148 | 0.292 | 0.466 | −0.621 | 1.205 | 0.530 |
| AGE _46–55 | 0.353 | 0.268 | −0.173 | 0.879 | 0.188 | 0.398 | 0.250 | −0.092 | 0.889 | 0.112 | 0.310 | 0.267 | −0.212 | 0.833 | 0.245 |
| AGE _56–65 | 0.369 | 0.289 | −0.197 | 0.934 | 0.202 | 0.501 | 0.273 | −0.034 | 1.036 | 0.067† | 0.373 | 0.290 | −0.195 | 0.942 | 0.198 |
| EDU: univ | −0.519 | 0.257 | −1.022 | −0.016 | 0.043* | −0.557 | 0.260 | −1.067 | −0.048 | 0.032* | −0.432 | 0.241 | −0.905 | 0.041 | 0.074† |
| EDU: high sch | −0.326 | 0.242 | −0.800 | 0.148 | 0.178 | −0.405 | 0.244 | −0.883 | 0.073 | 0.097† | −0.190 | 0.227 | −0.635 | 0.255 | 0.403 |
| INC: <10K | −0.408 | 0.270 | −0.937 | 0.121 | 0.130 | −0.403 | 0.258 | −0.909 | 0.103 | 0.118 | −0.389 | 0.253 | −0.884 | 0.107 | 0.124 |
| INC: 10–24K | −0.286 | 0.282 | −0.839 | 0.266 | 0.309 | −0.269 | 0.269 | −0.797 | 0.258 | 0.316 | −0.271 | 0.265 | −0.789 | 0.248 | 0.306 |
| INC: 25–39K | −0.099 | 0.295 | −0.678 | 0.480 | 0.738 | −0.164 | 0.286 | −0.723 | 0.396 | 0.566 | −0.260 | 0.280 | −0.808 | 0.289 | 0.354 |
Note(s): The Table reports the results of the ordered probit regression that has subjects' expectations of bank automated system performance as the dependent variable. PAS_total is the average value of PAS1 plus PAS2, which represents the perfect automation schema. PAS1 measures expectations of automated systems; PAS2 is a measure of “all-or-non thinking”; strong_PAS is a dummy variable that equals 1 if respondent has a PAS_total score that at least equals 3. β = beta coefficient; CI = confidence interval; LL = lower limit; UL = upper limit; p = p-value; ***p < 0.001, **p < 0.01, *p < 0.05, †<p < 0.1
Source(s): Created by authors
Model 1, where the independent variable is PAS_total, computed as the average value of the sum of PAS1 and PAS2, is statistically significant (W (15, N = 559) = 221.73, p < 0.001). The results reveal a positive and statistically significant relationship with bank_automation_perf (p < 0.001), confirming our main hypothesis. Moreover, the variable FK has a statistically significant influence on bank_automation_perf (p = 0.003). With respect to sociodemographic and socioeconomic characteristics, the results reveal positive and statistically significant impacts on bank_automation_perf of AGE_19–25 (p < 0.001) and AGE_26–35 (p = 0.048), and the negative influence of EDU_Univ (p = 0.043).
Model 2, where PAS1 and PAS2 are included separately, is statistically significant (W (16, N = 559) = 297.29, p < 0.001), and the results reveal a significantly positive relationship between bank_automation_perf and PAS1 (p < 0.001). The relationship between bank_automation_perf and PAS2 is not statistically significant. The results show that AGE_19–25 has a statistically significant influence on bank_automation_perf (p < 0.001), while EDU_Univ (p = 0.032) has a negative one.
Model 3, where the independent variable is strong_PAS, is also statistically significant (W (15, N = 559) = 132.2, p < 0.001); the results reveal a positive and statistically significant relationship with bank_automation_perf (p < 0.001). The analysis detects that the variable FSS has a statistically significant influence on bank_automation_perf (p = 0.047). With respect to sociodemographic and socioeconomic characteristics, only AGE_19–25 has a positive and statistically significant impact on bank_automation_perf (p = 0.013).
4.3 Robustness check
PAS, our main variable of interest, for which we aim to detect a relationship with consumer expectations of automated banking systems, may depend on certain other variables that are included in our analyses. This may lead to an endogeneity problem. Therefore, to control for this possible issue, we run additional robustness checks; in particular, we use an IV 2SLS regression where the IV is the respondent's frequency of internet access (Model 4, Table 8). The idea is that if individuals usually use the internet frequently, they may be more likely to use system automation and have positive expectations. Thus, PAS_total has been instrumented using the number of times that respondents declare to have accessed the internet per month as the IV. The results of the second stage of the IV regression (W (15, N = 559) = 62.37, p < 0.001) confirm our main findings; PAS positively affects individual performance expectancy of automated banking systems.
Instrumental variable two-stage least squares regression where the IV is the respondent's frequency of internet access
| Model 4 | β | SE | 95% CI | p | |
|---|---|---|---|---|---|
| LL | UL | ||||
| PAS_total | 1.502 | 0.566 | 0.391 | 2.612 | 0.008** |
| FK | 0.060 | 0.020 | 0.021 | 0.099 | 0.002** |
| FAS | −0.040 | 0.070 | −0.177 | 0.097 | 0.564 |
| FSS | 0.030 | 0.092 | −0.151 | 0.211 | 0.745 |
| GEND: female | 0.022 | 0.090 | −0.155 | 0.198 | 0.810 |
| AGE_19–25 | 0.529 | 0.198 | 0.140 | 0.918 | 0.008** |
| AGE _26–35 | 0.278 | 0.206 | −0.126 | 0.682 | 0.178 |
| AGE _36–45 | 0.368 | 0.311 | −0.241 | 0.978 | 0.236 |
| AGE _46–55 | 0.048 | 0.218 | −0.380 | 0.476 | 0.826 |
| AGE _56–65 | 0.012 | 0.224 | −0.427 | 0.452 | 0.957 |
| EDU: univ | −0.391 | 0.186 | −0.755 | −0.027 | 0.035* |
| EDU: high sch | −0.305 | 0.190 | −0.678 | 0.068 | 0.109 |
| INC: <10K | −0.232 | 0.183 | −0.591 | 0.127 | 0.206 |
| INC: 10–24K | −0.167 | 0.187 | −0.533 | 0.199 | 0.372 |
| INC: 25–39K | 0.012 | 0.204 | −0.387 | 0.411 | 0.953 |
| _cons | −1.156 | −0.670 | −4.522 | 2.210 | 0.501 |
Note(s): The table reports the results of the instrumental variable two-stage least squares regression where the dependent variable is the subjects' frequency of internet access. PAS_total is the average value of PAS1 plus PAS2, which represents the perfect automation schema. β = beta coefficient; CI = confidence interval; LL = lower limit; UL = upper limit; p = p-value; ***p < 0.001, **p < 0.01, *p < 0.05
Source(s): Created by authors
As further robustness checks, we run different OLS regressions; their results confirm the findings of the previous econometric models (Table 9). In Model 5 (F(15, 543) = 21.79, p < 0.001, R2 = 0.34), PAS_total significantly predicted bank_automation_perf, β = 0.77, t(543) = 15.04, p < 0.001. In Model 6 (F(16, 542) = 31.81, p < 0.001, R2 = 0.43), PAS1 significantly predicted bank_automation_perf, β = 0.64, t(542) = 18.23, p < 0.001, but PAS2 did not, in line with Model 2. In Model 7 (F(15, 550) = 11.25, p < 0.001, R2 = 0.22), strong_PAS significantly predicted bank_automation_perf, β = 0.57, t(550) = 1.10, p < 0.001. The control variables are the same across all four models. The robustness tests confirm that the impact of the control variables on our dependent variable is the same as that found in the main models.
Robustness tests. OLS regressions: dependent variable is performance expectancy of bank automated systems
| Model 5 | Model 6 | Model 7 | |||||||||||||
|---|---|---|---|---|---|---|---|---|---|---|---|---|---|---|---|
| B | SE | 95% CI | p | B | SE | 95% CI | p | B | SE | 95% CI | p | ||||
| LL | UL | LL | UL | LL | UL | ||||||||||
| PAS_total | 0.771 | 0.051 | 0.670 | 0.872 | 0.000*** | – | – | – | – | – | – | – | – | – | – |
| PAS1 | – | – | – | – | – | 0.639 | 0.035 | 0.570 | 0.708 | 0.000*** | – | – | – | – | – |
| PAS2 | – | – | – | – | – | 0.059 | 0.044 | −0.027 | 0.144 | 0.177 | – | – | – | – | – |
| strong_PAS | – | – | – | – | – | – | – | – | – | – | 0.572 | 0.057 | 0.461 | 0.683 | 0.000*** |
| FK | 0.053 | 0.017 | 0.020 | 0.086 | 0.002** | 0.027 | 0.016 | −0.005 | 0.059 | 0.095† | 0.026 | 0.008 | −0.010 | 0.062 | 0.090† |
| FAS | 0.027 | 0.044 | −0.059 | 0.113 | 0.535 | 0.067 | 0.011 | −0.014 | 0.148 | 0.090 | 0.061 | 0.049 | −0.035 | 0.157 | 0.210* |
| FSS | −0.129 | 0.066 | −0.260 | 0.002 | 0.053† | −0.065 | 0.038 | −0.139 | 0.008 | 0.082† | −0.115 | 0.047 | −0.208 | −0.023 | 0.014 |
| GEND: female | −0.061 | 0.052 | −0.163 | 0.040 | 0.237 | −0.076 | 0.018 | −0.169 | 0.017 | 0.090† | −0.105 | 0.056 | −0.216 | 0.005 | 0.062† |
| AGE_19–25 | 0.512 | 0.154 | 0.210 | 0.814 | 0.001*** | 0.415 | 0.133 | 0.154 | 0.677 | 0.002*** | 0.382 | 0.159 | 0.070 | 0.694 | 0.016* |
| AGE _26–35 | 0.328 | 0.180 | −0.026 | 0.682 | 0.069† | 0.278 | 0.160 | −0.037 | 0.592 | 0.084† | 0.328 | 0.190 | −0.045 | 0.702 | 0.085† |
| AGE _36–45 | 0.450 | 0.254 | −0.048 | 0.949 | 0.077† | 0.314 | 0.236 | −0.149 | 0.776 | 0.184 | 0.173 | 0.297 | −0.411 | 0.757 | 0.561 |
| AGE _46–55 | 0.199 | 0.160 | −0.115 | 0.512 | 0.214 | 0.204 | 0.136 | −0.062 | 0.471 | 0.132 | 0.192 | 0.175 | −0.152 | 0.535 | 0.273 |
| AGE _56–65 | 0.199 | 0.169 | −0.132 | 0.531 | 0.237 | 0.253 | 0.146 | −0.034 | 0.540 | 0.084* | 0.227 | 0.187 | −0.140 | 0.595 | 0.224 |
| EDU: univ | −0.309 | 0.145 | −0.594 | −0.025 | 0.033* | −0.310 | 0.136 | −0.577 | −0.042 | 0.023* | −0.282 | 0.151 | −0.579 | 0.015 | 0.063† |
| EDU: high sch | −0.190 | 0.137 | −0.459 | 0.078 | 0.165 | −0.220 | 0.128 | −0.471 | 0.030 | 0.085† | −0.119 | 0.142 | −0.399 | 0.160 | 0.402 |
| INC: <10K | −0.224 | 0.154 | −0.527 | 0.078 | 0.146 | −0.204 | 0.138 | −0.476 | 0.067 | 0.140 | −0.237 | 0.159 | −0.549 | 0.075 | 0.136 |
| INC: 10–24K | −0.155 | 0.162 | −0.472 | 0.162 | 0.338 | −0.131 | 0.144 | −0.414 | 0.152 | 0.364 | −0.162 | 0.167 | −0.490 | 0.166 | 0.332 |
| INC: 25–39K | −0.046 | 0.169 | −0.379 | 0.286 | 0.784 | −0.077 | 0.153 | −0.378 | 0.224 | 0.615 | −0.157 | 0.176 | −0.503 | 0.188 | 0.372 |
| _cons | 0.947 | 2.880 | 0.302 | 1.593 | 0.004 | 1.071 | 0.290 | 0.503 | 1.640 | 0.000 | 3.063 | 0.324 | 2.426 | 3.699 | 0.000 |
Note(s): The Table reports the results of the ordered probit regression where the dependent variable is subjects' expectations of automated banking systems performance. PAS_total is the average value of PAS1 plus PAS2, which represents the perfect automation schema. PAS1 measures expectations of automated systems; PAS2 is a measure of “all-or-non thinking”; strong_PAS is a dummy variable that equals 1 if the respondent has a PAS_total score that equals at least 3. B = non standardized beta coefficient; CI = confidence interval; LL = lower limit; UL = upper limit; p = p-value; ***p < 0.001, **p < 0.01, *p < 0.05, †< p < 0.1
Source(s): Created by authors
5. Discussion
This study's main objective was to observe the drivers of consumer bank automation performance expectancy compared to their performance expectancy of bank employees in the Italian context. In the study, we considered for the first time, as an individual characteristic, the general cognitive schema of automated systems (PAS), besides the role played by financial security, anxiety, and knowledge. The relationship between PAS and bank automation performance expectancy is not straightforward; as demonstrated by previous studies, high-level factors, such as the organization that exploits the automation and decision domain largely affect this relationship (Longoni et al., 2019; Pearson et al., 2019). We posited that the general positive tendency toward automation applies to the banking sector, translating in a tendency to have positive performance expectancy of bank automation compared to that of bank employees.
The analysis revealed that PAS affects consumer tendency to believe that automated banking systems are prone to errors. Consequently, consumers that display strong PAS, as revealed by the variables PAS_total and strong_PAS, were more likely to believe that automated banking systems are efficient and less likely to commit errors than bank employees. The results show that the high expectations component of PAS is associated with a more positive view of bank automation performance expectancy compared to employee performance expectancy. The determinants of successfully providing financial services through automation are still not fully explored; this finding thus contributes to the literature on performance expectancy and the comparison between human employees and automation highlighting that in the Italian context consumer cognitive schemas are a crucial key consumer-related characteristic that drive performance expectancy in the banking sector.
Since expectations regarding bank error rates could be related to individual characteristics other than general PAS, we controlled for the potential role played by financial anxiety, security, and knowledge. In particular, we observed that higher consumer financial anxiety was associated with more positive expectations of automated banking systems. Previous studies suggest that insecurity can be alleviated by a clear decision-making process (Fünfgeld and Wang, 2009). Therefore, by eliminating conversation, interactions, reasoning, and discussions, automated banking systems can be perceived as an aid to making clear financial decisions, increasing the comfort of this category of subjects. In this sense, the literature on nudge theory (Thaler, 1994) suggests that automated measures can be one way to improve financial decisions. For instance, with respect to retirement plans, automated regular annual payments in the three-pillar system allows these individuals to reduce their financial anxiety and improve their long-term financial decisions. Finally, one of the items that measures this consumer trait is related to a negative feeling associated with the lingo used by financial experts; thus, it is not surprising that subjects who score high in this trait tend to have positive expectations of automated banking systems, likely preferring digital interactions to human ones.
We also observed that the less secure a subject feels about their current and future financial situation, the higher their expectations about automated banking system performance. A possible explanation is that subjects who believe their financial situation is insecure are likely to be more vigilant about their resources. They tend to be up-to-date on the different tools available to manage their money; thus, they recognize the potential offered by automation and artificial intelligence. Another possible interpretation of this finding is related to the subjects' financial experience. If they perceive that they can easily meet all their current commitments and have the financial resilience to maintain that situation in the future, they might be likely to attribute this positive status to the interactions they have had so far with their banking institution's employees and their financial advisor. In fact, the widespread use of digital solutions in banking services is a recent phenomenon, making it highly probable that consumers have had more fruitful interactions with employees than with algorithms, making them more averse to digital interfaces.
With the increasing complexity of available financial products and services, consumers are also offered a wide array of tools for accessing them and better managing their financial resources. Automation in banking allows consumers to easily manage their personal finances, including savings, payments, borrowing, investing, and risk management (Lyons and Kass-Hanna, 2021). Congruently, our findings reveal that subjects with greater financial knowledge might be more prone to take advantage of the opportunities offered by banking automation and thus have positive expectations about its performance.
The literature review shows that the degree of automation acceptance varies depending on sociodemographic and socioeconomic characteristics (Mahmud et al., 2022). Our findings underline that female consumers are less likely to accept banking automation than men, in line with the results obtained in the different domains of health, justice, and media, where women have been found to perceive algorithms as less useful (Araujo et al., 2020). Our study is also consistent with the previous literature that suggests younger consumers are more likely to adopt technology and automation (Flavián et al., 2022). Although some studies report that higher educational levels are associated with greater appreciation of automation (Thurman et al., 2019; Logg et al., 2019), numerous studies reveal that professionals display the opposite tendency (Kaufmann, 2021). Our findings are consistent with this second cluster of studies, since we observe that individuals with higher education are less likely to have positive expectations of automated banking systems.
5.1 Theoretical contributions
This study offers different theoretical contributions. On one hand, previous studies have extensively investigated the importance for the UTAUT model of performance expectancy in the banking and finance sector, revealing that it is the primary determinant of technology adoption (Cheng-Xi Aw et al., 2023; Wang et al., 2017; Shaikh and Karjaluoto, 2015). On the other hand, another stream of research highlights the importance of employee performance in the banking and finance industry (Aburayya et al., 2020; Liao and Chuang, 2004), investigating the factors that affect perceptions of employees compared to those of automation and their influence on financial behavior (Northey et al., 2022; Lee and Wang, 2022; Chou et al., 2023; Riedel et al., 2022; Zhang et al., 2021). This study contributes to these two streams of research by investigating the influence of cognitive schema. Recently, UTAUT research has expanded to consider the relevance of the cultural dimension in affecting performance expectancy and technology adoption, revealing the importance of the cultural individualism dimensions (Blut et al., 2022; Migliore et al., 2022). Our study concentrates on Italy, a country known for its high levels of individualism but comparatively low adoption rates of digital financial services (Dumicic et al., 2015; Filotto et al., 2021; Migliore et al., 2022). The paper contributes shedding new light on the drivers of customer expectations regarding bank automation performance compared to those of bank employees, clarifying the role played by PAS. This result is interesting, because we empirically observe that individuals with high automation performance expectancy in general, who believe that automated services offer better outcomes than human employees, also display higher bank automation performance expectancy, likely considering automated financial services as more efficient than bank employees' services. In doing so, this study begins to address calls for exploring AI vs human employee service delivery, especially in financial services (Mogaji et al., 2022).
Moreover, this study reinforces previous findings on the relationship between emotions and behavior in the financial domain, focusing in particular on financial feelings. Prior literature has examined emotional responses to AI (Castillo et al., 2021; Riedel et al., 2022; Cui, 2022); this study contributes confirming the relevance of the financial feelings in the financial decisions domain. Besides its utility in terms of accuracy and efficiency, the development of automation is defying a complex picture, which reveals intricate psychological consequences with downstream effects on consumers (van Esch and Cui, 2021; van Esch et al., 2021a, b). Our findings confirm that financial security and anxiety affect bank customers' decision making. Our results are congruent with reports from industry (Deloitte, 2019) showing that high net worth individuals (i.e. those with high financial security) prefer human relationships, probably because they have lower expectations of bank automation performance (Northey et al., 2022). At the same time, individuals with higher financial anxiety tend to prefer automated banking systems to reduce the probability of human errors. The results therefore add to the growing body of research across different service contexts that identify preferences for human interactions over automated systems.
5.2 Practical implications
Our findings also have relevant practical implications for banks, marketers, and policymakers. In countries like Italy, where the culture leans toward individualism, the idea of performance expectancy becomes crucial to understanding why people choose to adopt technology. Industry reports highlight that only 48% of people in Italy use online banking, compared to 98% in the United Kingdom (Statista, 2023a). Similarly, just 21% of smartphone users in Italy make use of proximity mobile payments, a stark contrast to the 81% in China (Statista, 2023b). These figures point to Italy's low adoption rates for digital financial services, making it intriguing to explore what influences consumers' expectations of automated banking services. Our research indicates that a person's general view of automation significantly impacts their expectations for digital banking services. The Italian data suggest that improving people's overall perception of automation and digital infrastructure could lead to higher adoption of digital financial services. Financial literacy has been identified as a key factor in encouraging positive financial behaviors (Lusardi and Mitchell, 2011; Andreou and Anyfantaki, 2021), and our findings suggest that increasing digital financial services adoption might be achieved by altering the public's mindset about the effectiveness of digital solutions. A practical approach to this could be enhancing digital literacy and skills.
Different individual expectations suggest that consumer attitudes and decisions in the financial context can be modulated by the means through which the service is provided, that is, whether by employees or an automated interface. In consumers with high PAS, risk perception can be enhanced when financial services are provided through automated systems rather than bank employees or financial advisors. Therefore, in the Italian context, financial industry practitioners might benefit from knowing that consumers differ in how they expect automation to perform, thus reducing technological interactions for those consumers with high PAS or, conversely, enhancing it for consumers who display the opposite trait.
This research sheds light on a new focal point for bank marketing strategies that has been largely disregarded by both theory and practice, that is, the cognitive schema consumers activate when interacting with automation. Traditionally, marketers have focused on gender, age, and education as the heart of their segmentation strategies. However, these variables do not enable businesses to identify all sub-market characteristics or improve their understanding of their target audience because consumers in the same demographic group may have heterogeneous psychographic makeups (Kotler and Armstrong, 2007). This study suggests that in the Italian context, consumers' cognitive schema should be considered when evaluating their performance expectations, which are strictly related to consumer intentions and behaviors. Collecting psychographic data is challenging; however, banks might exploit their close relationships with customers by administering short surveys to acquire information about their propensity toward automation and digital solutions. Banks that detect low PAS in their customers may want to consider a hybrid approach, mixing automated systems with human support, instead of completely replacing customer human interactions with automation.
Finally, from a consumer protection perspective, it is relevant to know that subjects differ in how they perceive automation in banking, and that this trait is likely to alter preferences and decisions. That is, financial consumers might avoid buying insurance, savings, or investment products depending on a manipulated factor as the means of interaction (i.e. a chatbot rather than a financial advisor). Overall, these practical implications point out the need to theoretically study and empirically investigate how subjects' cognitive schema toward automation influence their financial decisions.
5.3 Limitations and further development
This study has limitations that offer opportunities for further exploration. Firstly, although performance expectancy is a crucial variable in the UTAUT model, other factors also play a role, suggesting that future research could investigate whether cognitive schemas influence other consumer expectations, such as effort expectancy. Secondly, we did not assess consumer satisfaction with bank automation. Future studies could add value by examining how cognitive schemas' impact on performance expectancy might translate into consumer satisfaction or dissatisfaction, thus enriching the discrepancy theory framework.
Finally, our analysis was limited to Italy. Although this context is relevant due to its low adoption rates for digital financial services and its high individualism score, which underscores the importance of the performance expectancy construct, it restricts the generalizability of our findings. Future research could broaden the analysis to include other countries to gain a more comprehensive understanding of the influence of cognitive schema and cultural values on digital financial services adoption.
Funding: The study was funded by Beyond Borders 2019 - Tor Vergata University of Rome.
References
Further reading
Appendix Questionnaire