Skip to article sections
Purpose

Reliable climate projections are required for effective climate change adaptation and management. However, raw general circulation model (GCM) outputs are usually beset by systematic bias that can be harmful to decision-making. This study aims to evaluate the performance of five bias correction methods (BCMs) in correcting precipitation data from six CMIP6 models over southern Ethiopia’s Wolaita Zone drylands.

Design/methodology/approach

The BCMs evaluated were distribution mapping (DM), multiplicative linear scaling (MLS), local intensity scaling (LIS), multiplicative delta change (MDC) and power transformation (PT). Their performance was evaluated using the Nash–Sutcliffe efficiency (NSE), mean absolute error (MAE) and coefficient of determination (R²).

Findings

The BCM performance varied across the models and metrics. The MDC was consistently the best, recording decreases in MAEs to 9.61–96.82 mm, R² to 0.99 and NSE of 0.71–0.99. Model-specific reductions in error ranged from 49.5% (ACCESS-CM2) to 89.3% (MPI-ESM1 – 2-HR), whereas the ensemble recorded 93.7% improvement. MLS and LIS improved mean rainfall and low-end extremes, respectively, but both failed to predict high rainfall quantiles. DM and PT exhibited fragile and unstable improvement. In general, the ensemble mean provided a more reliable improvement over the individual models.

Research limitations/implications

The study recommends using the MDC method for bias correction of precipitation data from six CMIP6 GCMs in the Wolaita Zone’s drylands. However, it is important to acknowledge that biases arising from imperfect modeling remain and cannot be fully eliminated by BCMs.

Practical implications

Using the suggested bias correction methods in the study area, it would be easy to protect future rainfall variability and change, as well as impacts on crop and livestock production in Ethiopia.

Social implications

The proactive adaptation measures suggested based on better accuracy data improve the farmers’ resilience to climate variability and change, especially the rainfall. This, in turn, maintains the stability of societies in the area by minimizing the level of migration.

Originality/value

This study provides the first comparative evaluation of several BCMs for CMIP6 precipitation data over Ethiopia’s drylands. The MDC and ensemble approaches were determined to be particularly robust for regional climate applications, with significant implications for climate adjustment, water resource management and policy planning.

The Coupled Model Intercomparison Project Phase 6 (CMIP6) provides advanced general circulation models (GCMs) to model interactions among climate systems under mathematical formulations (Johnson and Sharma, 2011; Lanzante et al., 2018). These models are used to model future climate conditions and assess their impacts on ecosystems, water resources, agriculture and human health (Alizadeh-Choobari, 2019; Trzaska and Schnarr, 2023). For instance, recent studies have used CMIP6 outputs to contrast future ecosystem productivity under various shared socioeconomic pathway (SSP) scenarios (Qiu et al., 2023).

Nonetheless, GCMs are characterized by their coarse spatial resolution, typically 80–250 km (Cannistra, 2023). This limitation restricts their depiction of regional processes, such as orography, land–sea contrast and convective cloud systems, which are of the utmost priority for regional applications, such as hydrology and agriculture planning (Alizadeh, 2022; Gutmann et al., 2014). To ease this, high-resolution setups, such as the HadGEM3 GC31 HM with a resolution of approximately 50 km, have been developed, and downscaling via machine-learning techniques has been applied to achieve finer spatial resolutions of approximately 0.1° (Wang et al., 2025).

However, GCM projections are often marked by random and systematic biases that, if not corrected, can lead to misleading assessments and ineffective adaptation strategies (Loikith et al., 2023; Aznar-Siguan et al., 2024). Therefore, downscaling and bias correction methods (BCMs) are required to increase the credibility of climate projections. Examples of ordinary approaches include statistical approaches such as scaling approaches, quantile mapping and dynamical downscaling (Chen et al., 2025). The method of choice relies on the intended application, data availability, computer ability and target climate variable (Tapiador et al., 2020).

Although CMIP6 represents a remarkable improvement over the older CMIP3 and CMIP5 models (Gusain et al., 2020; Wang et al., 2024), there are still uncertainties in the tropical and subtropical regions (Kharin et al., 2013). Recent evaluations indicate that uncorrected CMIP6 precipitation data should not be employed directly without bias correction (Nguyen-Duy et al., 2023). Some BCMs have been tested globally, including local intensity scaling (LIS), multiplicative linear scaling (MLS), distribution mapping (DM), multiplicative delta change (MDC) and power transformation (PT) (Luo et al., 2018; Tefera et al., 2023). They behave differently depending on the place, data set and method (Lafferty et al., 2021; Takhellambam et al., 2023), implying that there is no single approach.

Various BCMs have been used to regional and global climate model outputs in Ethiopia, but with mixed outcomes (Daniel, 2023; Enyew et al., 2024). For example, Daniel (2023) conducted an experiment with MLS, PT and DM for southern watersheds, whereas Enyew et al. (2024) applied PT to CMIP6 data for the Upper Blue Nile. However, few studies have compared different BCMs in Ethiopia’s drylands, where livelihoods largely depend on climate variability. This study aims to fill this gap by comparing five BCMs, namely, MLS, MDC, LIS, PT and DM, applied to CMIP6 precipitation data for the Wolaita Zone Drylands. By observing what improves or worsens model performance, this study can be used to support better regional climate studies and sustainable development objectives, particularly climate action.

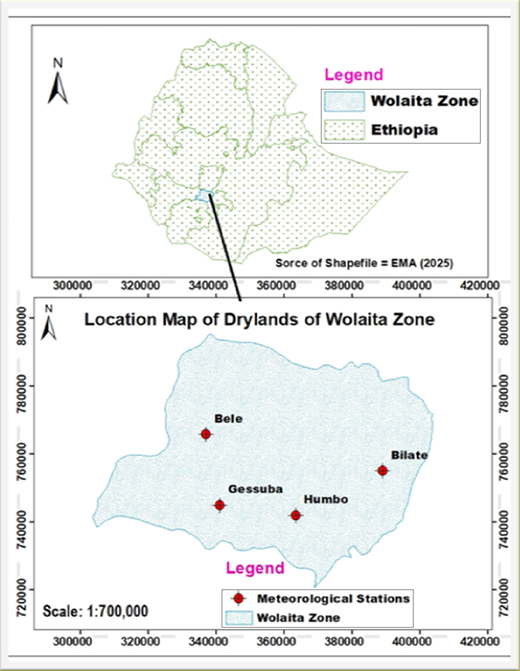
This study was conducted in the drylands of the Wolaita Zone, southern Ethiopia, focusing on four districts: Duguna Fango, Kindo Koysha, Humbo and Ofa (Figure 1). The analysis was based on data from four meteorological stations located within these districts.

The Duguna Fango district is situated on the eastern side of Wolaita, facing the Bilate River and the Central Rift Valley, which strongly influences its hydroclimate and land-use dynamics. The district seat, Bitena, is located approximately 42 km east of Wolaita Sodo and 300 km south of Addis Ababa by road. The Bilate meteorological station (6.822° N, 38.088° E; 1,361 m a.s.l.) is located within the Duguna Fango district, approximately 251 km south-southwest of Addis Ababa and 36 km east of Wolaita Sodo. The Kindo Koysha district borders the Dawro and Koysha districts to the north and east, respectively, and spans elevations around 1,500 m a.s.l. The district’s administrative seat is Bele (Bale Hawassa). The Bele meteorological station (6.918° N, 37.526° E; 1,240 m a.s.l.) is located within the Kindo Koysha district, approximately 266 km south-southwest of Addis Ababa and 27 km west-northwest of the district’s administrative seat, Bele (Bale Hawassa).

The Humbo district stretches across Rift Valley lowlands and mid-altitude uplands, offering diverse ecological conditions. The district seat, Tebela, is located approximately 17 km south of Wolaita Sodo and hosts the Humbo station (6.703° N, 37.766° E; 1,618 m a.s.l.), which is situated within the Humbo district and approximately 276 km south-southwest of Addis Ababa. The Ofa district, located on the southwestern flank of Wolaita, shares borders with the Kindo Koysha and Kindo Didaye districts. Its administrative seat is Gessuba, which is also home to the Gessuba station. The coordinates of the Gessuba station are 6.729° N, 37.563° E, with an elevation of 1,552 meters above sea level. It is situated 26 kilometers west-southwest of Wolaita Sodo and 283 kilometers south-southwest of Addis Ababa.

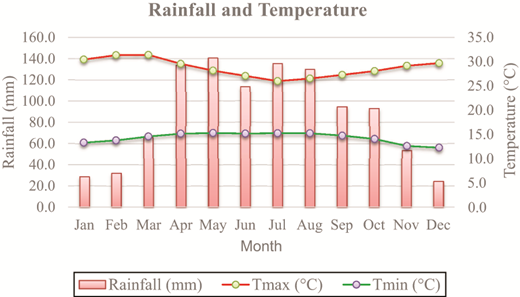
The Wolaita Zone drylands experience three climatic seasons: winter – Bega (October–January); spring – Belg (February–May); and summer – Kiremt (June–September) (NMI, 2023). The zone has extensive sections of spring and summer rainfall – 82% of the annual total. Winter is a relatively dry season with the lowest contribution to the rainfall for the year – 18%. Interannual and seasonal rainfall over the 1990–2021 interval suggests moderate rainfall variability (CV 10%–20%), whereas relatively greater variability in the winter season (CV > 30%) is felt. Low interannual and seasonal variability in study area temperature has been felt over the same interval. A daily maximum (day) temperature ranges from 24.3°C in July to 30.1°C in February, and a minimum (night) temperature ranges from 12.6°C in December to 15.1°C in April (Figure 2).

Daily precipitation data from four meteorological stations spanning the years 1990–2021 were obtained from the Ethiopian Meteorological Institute. To ensure the accuracy and reliability of the data, a rigorous quality control process was implemented. Missing values were filled using multiple linear regression, a commonly used method in Ethiopian climate research to maintain consistency across both space and time (Chinasho et al., 2021). Outliers were identified using the interquartile range method, which effectively distinguishes erroneous entries without excluding genuine extreme values. The homogeneity of the data sets was then verified using the Pettitt test (Pettitt, 1979) and Buishand’s range test (Buishand, 1982). These non-parametric tests are well-established for detecting shifts that may be caused by station relocation, equipment changes, or other non-climatic factors. By using both tests, the author was able to reliably detect any inconsistencies in the data. This multistep procedure resulted in a consistent and high-quality data set suitable for long-term variability analysis.

Daily precipitation data from six CMIP6 GCMs (EC Earth3 Veg, ACCESS CM2, ACCESS ESM1-5, HadGEM3 GC31-LL, MIROC ES2L and MPI ESM1-2 HR) were utilized for both historical (1990–2014) and future (2025–2100) periods, under two scenarios: SSP2-4.5 (medium stabilization) and SSP5-8.5 (high emission). These models were specifically chosen due to their proven ability to accurately simulate rainfall patterns in Ethiopia and East Africa, as demonstrated in previous evaluations (Rettie et al., 2023; Lebeza et al., 2024; Gashaw et al., 2024). Their inclusion in this study enhances representativeness and reduces uncertainty related to model selection.

The climate model data was processed using CMhyd software, which combines station observations with GCM outputs to downscale and correct for biases. CMhyd has become a popular tool in Ethiopian hydrological and climate studies due to its effectiveness in preserving local climate patterns (Tullu and Tumsa, 2024; Lukas et al., 2025). For this study, data was extracted from six models, two scenarios and five bias correction methods, resulting in a total of 60 corrected data sets.

Five commonly used BCMs were evaluated: MLS, MDC, LIS, PT and DM. These methods were chosen because they represent a range of correction approaches, from simple mean-based methods (MLS, MDC) to techniques that focus on the distribution of data (DM, PT). LIS is particularly useful for adjusting daily precipitation intensity and frequency, which is crucial for analyzing extreme events. The performance of each method was assessed using three metrics: coefficient of determination (R2), Nash–Sutcliffe efficiency (NSE) and mean absolute error (MAE). These metrics collectively measure the strength of correlation, predictive accuracy and average deviation, providing a comprehensive evaluation of the model’s skill. The use of both variance-sensitive and error-sensitive indicators enhances the reliability of the bias correction assessment.

To analyze extreme rainfall, the 10th and 90th percentiles of daily rainfall were calculated using a non-parametric thresholding approach. This method is commonly used in climate research, as it does not rely on assumptions about the underlying distribution, making it well-suited for regions with high variability in rainfall (Dinku et al., 2024; Mengistu et al., 2024). By aggregating these values on a monthly basis, a meaningful comparison between observed and bias-corrected data sets was possible.

3.1.1 Performance of MLS on mean precipitation.

The accuracy of CMIP6 precipitation outputs varied considerably across the selected models, as shown in Table 1. The application of the MLS method significantly improved rainfall simulation performance for several individual models, as well as for the ensemble mean. Specifically, there were notable improvements in key evaluation metrics, including the NSE and the coefficient of determination (R2). For example, MLS improved ACCESS ESM1 5 by 55.92%, EC Earth3 Veg by 10.39%, MIROC ES2L by 76.98%, MPI ESM1 2 HR by 1.38%, and the ensemble mean by 41.07%. These results demonstrate the effectiveness of MLS in reducing systematic biases in CMIP6 precipitation outputs while maintaining the temporal structure of rainfall.

These findings are consistent with previous studies. For instance, Amognehegn et al. (2023) assessed the impact of MLS bias correction on daily precipitation from twelve CMIP6 models and reported significant accuracy gains in three models, including ACCESS ESM1 5. Similarly, Chae and Chung (2024) evaluated twenty CMIP6 models across the Mokgam River watershed and found that MLS substantially improved the fidelity of simulated precipitation for models such as ACCESS CM2, ACCESS ESM1 5, EC Earth3 Veg and MPI ESM1 2 HR. The alignment between the present results and existing literature reinforces the robustness of MLS as a bias correction method, particularly in regions with highly variable rainfall.

3.1.2 Performance of MLS on percentiles of precipitation.

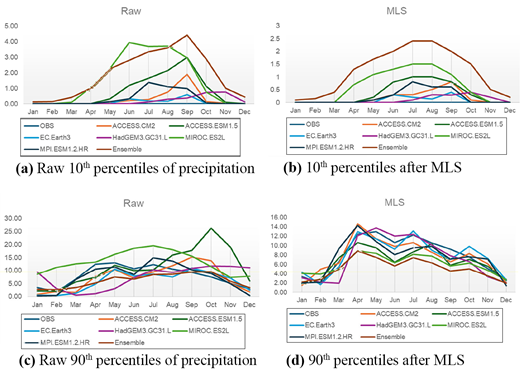
While the mean precipitation values improved with the use of MLS, it was not as effective in correcting extreme precipitation indices. This can be seen in Figure 3, where MLS had limited capability in improving the accuracy of the 10th and 90th percentiles. This is due to the linear, mean-based nature of MLS, which does not account for higher-order distributional properties such as variance or skewness. This is supported by a study by Azad and Ahmadi (2024), which found that MLS performed poorly in simulating precipitation extremes across 13 global climate models in Iran, including ACCESS-ESM1-5 and EC-Earth3-Veg. In their research, MLS increased the MAE by 3.75% for ACCESS-CM2 and by a significant 35.78% for HadGEM3-GC31-LL, highlighting the limitations of the method for extreme events. Despite these limitations in individual models, the ensemble mean showed more robust results.

After bias correction, the ensemble outputs showed notable reductions in MAE compared to the six individual models: −24.7% (ACCESS-CM2), −22.5% (ACCESS-ESM1-5),−15.1% (EC-Earth3-Veg), −49.2% (HadGEM3-GC31-LL), −9.9% (MIROC-ES2L) and −7.8% (MPI-ESM1–2-HR). This is consistent with previous research that has shown that ensembles better capture both central tendencies and variability (Lafferty et al., 2021; Takhellambam et al., 2023). Overall, these results demonstrate both the strengths and limitations of MLS. While it significantly improves mean precipitation simulation, its linear approach limits its performance for extreme rainfall events. These limitations highlight the importance of considering more advanced or non-linear bias correction techniques when modeling precipitation percentiles, which are crucial for drought and flood risk assessment. Furthermore, the superior performance of the ensemble mean suggests that combining multiple models enhances reliability and reduces model-specific biases, emphasizing the value of ensemble approaches in climate impact assessments and water resource planning in regions like southern Ethiopia.

3.2.1 Performance of MDC on mean precipitation.

The MDC method significantly improved the accuracy of CMIP6 precipitation outputs for daily rainfall in southern Ethiopia, as shown in Table 2. Prior to bias correction, CMIP6 models performed poorly, with MAE ranging from 169.55 to 1321.66 mm, coefficients of determination (R2) between 0.005 and 0.17, and NSE values spanning from −72.88 to −0.626. However, after applying MDC, these metrics improved significantly: MAE decreased to 9.61–96.82 mm, R2 increased to 0.99 and NSE rose to 0.71–0.99, indicating a strong alignment with observed data. The error reductions varied among models, with the ensemble mean showing the highest improvement of 93.7%, followed by ACCESS-CM2 with 49.5%. The ensemble generally outperformed individual models, except for MPI-ESM1-2-HR. These findings are consistent with previous regional studies. For example, Babiker et al. (2024) reported error reductions of 0–18% after applying MDC in Sudan, demonstrating the method’s applicability in the region.

Similarly, Tsegaye et al. (2023) found that more than 70% of CMIP6 models showed NSE values above 0.80 and R2 above 0.90 after MDC was applied in Ethiopia’s Upper Awash Basin. Ali et al. (2025) further confirmed MDC’s consistent ability to reduce seasonal rainfall biases in East Africa, particularly during the Belg and Kiremt seasons. Rauf and Desta (2023) highlighted MDC’s suitability for arid and semi-arid zones like southern Ethiopia, where rainfall variability and nonlinearity limit the effectiveness of simpler correction methods. These studies collectively support the statistical robustness and adaptability of MDC for regional climate modeling applications.

3.2.2 Performance of MDC on percentiles of precipitation.

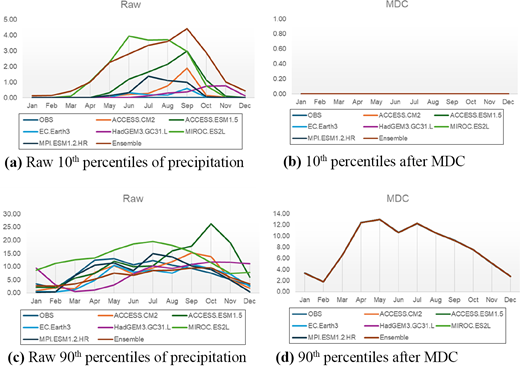
Although the MDC effectively corrected the mean precipitation, its performance varied across precipitation extremes. This method had a limited impact on the simulation of the 10th percentile, representing dry conditions, across the six CMIP6 models (Figure 4). This limitation is likely due to the linear approach of the method, which does not fully account for skewness or variability at the lower end of the precipitation distribution. Conversely, the MDC performed exceptionally well for the 90th percentile, representing extreme wet conditions, achieving an MAE of 0.02 mm, an R2 of 0.9 and an NSE of 0.9. This demonstrates the MDC’s strength in adjusting high-end precipitation estimates, which is consistent with the findings of Oruc (2022), who reported the superior performance of the MDC over quantile mapping (QM) and empirical quantile mapping (EQM) in Turkey.

Teklemariam et al. (2023) found that MDC outperformed other models in bias-correcting high precipitation quantiles over the Rift Valley Basin, including southern Ethiopia. Desta et al. (2024) reported that MDC preserved interannual variability while minimizing overcorrections under high-emission scenarios. Similarly, Feyissa and Lemma (2025) demonstrated enhanced performance in percentile-based skill scores when applying MDC to CMIP6 data sets in semi-arid Ethiopian zones. Together, these studies highlight MDC’s growing recognition of the MDC as a dependable method for improving high-intensity rainfall simulations in regional climate applications.

In summary, this method provides substantial improvements in mean precipitation simulation and effectively corrects high-end extremes, although it has limited success in correcting low-percentile rainfall. The ensemble mean further enhances reliability by combining multiple models, mitigating individual model biases, and providing a more robust representation of rainfall variability.

3.3.1 Performance of LIS on mean precipitation.

The LIS bias correction technique produced mixed outcomes when applied to CMIP6 precipitation data sets for daily rainfall forecasting in southern Ethiopia. Specifically, LIS substantially reduced error rates by 50.7%, 7.1%, 77.1% and 39.4% for the ACCESS-ESM1-5, EC-Earth3-Veg, MIROC-ES2L models and the Ensemble, respectively (Table 3). However, LIS increased the error rates by 5.9% for ACCESS-CM2, 38.6% for HadGEM3-GC31-LL and 1.6% for MPI-ESM1-2-HR, highlighting the model-specific performance limitations. These findings are consistent with those of earlier studies by Addor et al. (2014), Lafferty et al. (2021) and Takhellambam et al. (2023), who demonstrated that bias correction techniques can sometimes inadvertently amplify uncertainties or introduce new biases.

Further evidence from regional studies supports these results. Belay et al. (2023) reported that LIS effectively reduced biases in high-flow rainfall but worsened errors in dry-day frequency simulations in the Abaya-Chamo Basin. Similarly, Tesfaye and Endeshaw (2024) found that LIS improved the correction of high-intensity rainfall events in some CMIP6 models but performed poorly for lower quantiles, leading to overestimated dry spells. Mohammed et al. (2025) also concluded that while LIS enhanced precipitation accuracy in unimodal rainfall regions, it could overcorrect and distort rainfall variability in bimodal systems such as those in southern Ethiopia. Collectively, these studies underscore the importance of region-specific calibration and model-dependent application of bias correction methods such as LIS.

3.3.2 Performance of LIS on percentiles of precipitation.

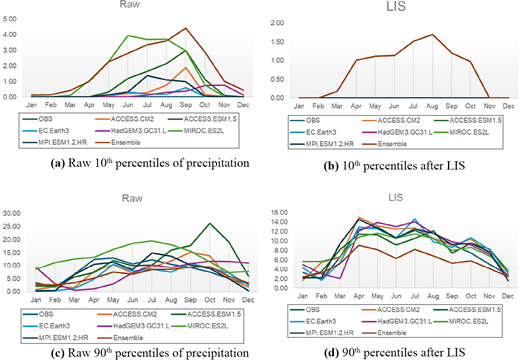
When examining precipitation extremes, the LIS technique enabled the CMIP6 GCMs to effectively simulate the 10th percentile of observed rainfall in southern Ethiopia (Figure 5), demonstrating improved performance in capturing low-end precipitation extremes. The LIS consistently performed well across individual GCMs and the ensemble mean, highlighting its robustness in correcting light rainfall and reducing dry-day overestimations common in uncorrected CMIP6 outputs for arid and semi-arid regions.

In contrast, LIS failed to improve the accuracy of the 90th percentile of monthly rainfall, particularly in the dry areas of the Wolaita Zone. This limitation reflects the difficulty in adjusting upper-end extremes, consistent with Takhellambam et al. (2023), who reported that LIS struggles with nonlinear biases in heavy rainfall regimes. Supporting evidence from recent studies shows a similar: Hailemariam et al. (2023) noted that while LIS accurately corrected the 10th percentile rainfall in the southwestern Ethiopian Highlands, it underestimated extreme events.

Demelash and Hassen (2024) found that LIS was effective for low to moderate rainfall but inadequate for high quantiles in southern Ethiopia’s bimodal systems. Likewise, Gizachew et al. (2025) emphasized the LIS’s limited adaptability to non-stationary biases during high-rainfall months, restricting its usefulness in flood-risk modeling and extreme weather forecasting in dryland areas such as Wolaita.

Overall, these results indicate that LIS is most suitable for correcting lower precipitation quantiles, particularly in arid and semi-arid climates, whereas alternative or hybrid bias correction methods may be necessary to address high-end precipitation extremes under changing climate conditions.

3.4.1 Performance of PT on mean precipitation.

The PT technique exhibited varied impacts on the performance of CMIP6 models in bias-correcting precipitation data across southern Ethiopia. While PT enhanced the performance of certain models, it led to increased error rates in others (Table 4). Specifically, the error rates increased by 5.6%, 35.1% and 3.8% for ACCESS-CM2, HadGEM3-GC31-LL and MPI-ESM1-2-HR, respectively. In contrast, PT significantly reduced errors by 46.5%, 0.3%, 73.6% and 35.8% for ACCESS-ESM1-5, MIROC-ES2L and the ensemble average, demonstrating a model-dependent efficacy. Supporting this, Enyew et al. (2024) highlighted that PT improved the statistical properties of daily precipitation series, particularly for the MPI-ESM1-2-HR model in the Upper Blue Nile Region. The study demonstrated that PT effectively adjusted skewed rainfall distributions, making it useful for improving projections in both wet and transitional climates in the region.

Similarly, Kebede and Asfaw (2023) reported that PT improved the normality and variance structure of CMIP6 model outputs in central and southern Ethiopia, although they noted that PT tended to over-smooth extreme precipitation events in some models, particularly HadGEM3-GC31-LL. Similarly, Tsegaye et al. (2025) observed that PT enhanced monthly rainfall predictability for models such as MIROC-ES2L but did not fully correct the biases during seasonal transition periods, particularly in bimodal rainfall systems. Moreover, Hailu and Mersha (2025) emphasized that PT performance improves when combined with quantile mapping, suggesting that hybrid correction approaches may be more suitable for handling precipitation extremes in climatically complex regions.

Collectively, these findings indicate that while PT can improve the performance of some GCMs, its application requires careful calibration and validation, particularly in regions with high rainfall variability and nonlinear precipitation distributions.

3.4.2 Performance of PT on percentiles of precipitation.

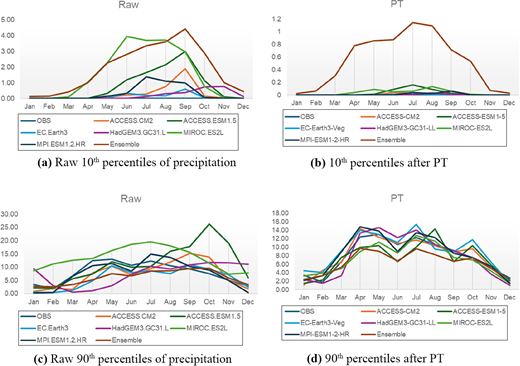
Despite these improvements in certain metrics, the low R2 values and negative NSE scores indicate that PT did not substantially enhance the overall accuracy of any of the six CMIP6 models used in this study. This underscores its limited effectiveness in correcting precipitation data in areas with complex rainfall patterns. PT performed particularly poorly in reproducing the 10th and 90th percentiles of rainfall (Figure 6), suggesting that its assumptions about data distribution transformations are not well suited to the nonlinear, skewed, and seasonally bimodal rainfall typical of southern Ethiopia.

While Chae and Chung (2024) reported substantial improvements using PT for 20 CMIP6 models in South Korea’s Mokgam River watershed, this success appears region-specific, likely due to the more stable, unimodal rainfall regime in that area. Similarly, Beyene et al. (2023) found PT ineffective at correcting both high and low rainfall quantiles in the semi-arid Rift Valley, and Getahun and Wolde (2025) observed minimal improvements in lowland southern Ethiopia. Dinku et al. (2025) further emphasized that PT alone is insufficient and performs better when paired with nonlinear correction methods. Collectively, these results suggest that PT is not recommended for bias correction of CMIP6 models in the drylands of the Wolaita Zone.

3.5.1 Performance of DM on mean precipitation.

Based on the R2 and NSE metrics, the DM bias correction method did not substantially improve the accuracy of the CMIP6 outputs for precipitation estimation in the drylands of the Wolaita Zone (Table 5). DM increased the MAE errors for ACCESS-CM2, HadGEM3-GC31-LL and MPI-ESM1 - 2-HR by 7.0%, 37.1% and 9.7%, respectively, indicating that DM is poorly suited for southern Ethiopia’s semi-arid, bimodal climate with high seasonal variability. However, DM improved the performance of ACCESS-ESM1-5 (44.9%), EC-Earth3-Veg (1.4%), MIROC-ES2L (73.8%) and the ensemble mean (30.5%), suggesting that its effectiveness is model-dependent. These findings align with Acharki et al. (2023), who reported that DM enhanced CMIP6 simulations in semi-arid northwestern Morocco, and Li and Li (2025), who observed improved correlation in fourteen GCMs across Canadian climate zones.

Nonetheless, Mekuria and Tadesse (2024) noted that DM performed better in Ethiopia’s unimodal highlands but poorly in lowland drylands because it could not preserve skewed rainfall distributions and seasonal asymmetries. Similarly, Abate and Workineh (2025) reported that the DM failed to correct rainfall extremes in southern and southeastern Ethiopia, whereas Negash et al. (2023) found that unscaled DM led to dry-season overcorrections, distorting drought simulations in pastoral zones. Overall, these results indicate that while DM can be effective in specific contexts, its inconsistent performance – underscores the need for region-specific or hybrid bias correction methods in the drylands.

3.5.2 Performance of DM on percentiles of precipitation.

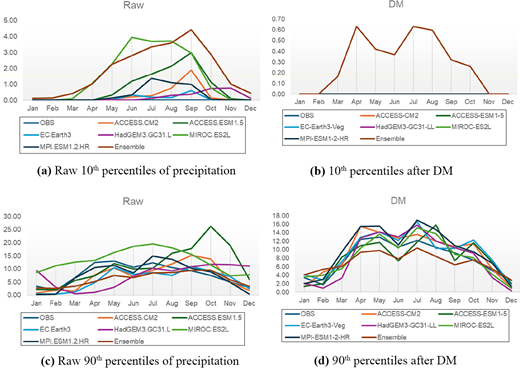
A key issue arises from the monthly 10th percentiles of observed rainfall being zero, which caused the DM to reproduce zero values across all six CMIP6 outputs (Figure 7, panels B and D). This outcome reflects the method’s inability to differentiate between true dry conditions and model bias, particularly in semi-arid regions with frequent zero-rainfall observations. The poor performance of DM is further evidenced by the performance metrics, where R2 was 0, and NSE could not be calculated because of zero denominators in the variance component. In addition, DM increased error levels in the ensemble mean when estimating the 10th percentile of observed rainfall, directly limiting its utility in modeling low-end extremes critical for drought risk assessment and water resource management in arid zones.

As shown in Figure 7, DM also failed to improve the accuracy when replicating the 90th percentile of the observed rainfall across the models. This limitation suggests that DM’s fixed-scaling approach is not sufficiently flexible to adjust for nonlinear biases in precipitation extremes, particularly under variable climatic conditions. Recent research supports these concerns: Tekle and Dagne (2024) found that DM failed to preserve interannual rainfall variability in the southern Rift Valley, leading to distorted seasonal transitions. Similarly, Alemu et al. (2023) reported that DM could overfit historical dry periods, causing under-predictions during emerging wet years in lowland Ethiopia. Woldemariam and Gebeyehu (2025) also demonstrated that DM introduced statistical artifacts in both lower and upper rainfall quantiles when applied to CMIP6 bias correction in the Horn of Africa.

Overall, these findings reinforce that DM is not well suited for use with the selected CMIP6 models in Southern Ethiopia. Its inconsistent performance for both low-end and high-end precipitation highlights the importance of considering alternative or hybrid bias-correction approaches for accurate climate impact assessments in the drylands of Wolaita Zone.

In this study, the performance of five schemes of BCMs of precipitation data was analyzed in detail. The BCMs used were MLS, DM, MDC, LIS and PT. BCMs were applied to the precipitation data of six models from the set CMIP6: MIROC-ES2L, ACCESS-CM2, ACCESS-ESM1-5, EC-Earth3, HadGEM3-GC31-LL and MPI-ESM1-2-HR. The impacts varied by the respective CMIP6 model and evaluation measure used. Of particular interest, several BCMs oddly escalated errors in some models, reinforcing the relevance of method choice for regional climate modeling. Among the five BCMs tested, the MDC method consistently provided superior corrections across all evaluation criteria, followed closely by the ensemble mean approach. MLS and LIS demonstrated specific strengths but were less effective for extreme events. PT and DM were the least reliable for the Wolaita drylands. These findings highlight MDC and ensemble approaches as reliable tools for enhancing the credibility of CMIP6 precipitation projections in southern Ethiopia. However, it must be remembered that biases arising from insufficient modeling still prevail and cannot be entirely eliminated by BCMs.

The adoption of MDC-corrected ensemble projections offers significant benefits for Ethiopia’s climate strategies. Improved rainfall simulations can strengthen the National Adaptation Plan and Climate-Resilient Green Economy strategy by supporting early warning systems, drought preparedness and integrated water resource management. Agricultural planning, irrigation and hydropower development will benefit from reduced uncertainty in rainfall–runoff modeling. Moreover, reliable projections can inform climate-smart investments, insurance schemes and financial instruments. Residual uncertainties in GCMs and emission scenarios remain, but these should be viewed as a call for adaptive policy frameworks rather than a limitation. MDC-corrected ensembles provide a practical decision-support tool that enhances resilience planning and resource management in Ethiopia’s climate-sensitive.

This research received no specific grant from funding agencies in the public, commercial, or not-for-profit sectors.
Abate
,
H.
and
Workineh
,
B.
(
2025
), “
Evaluation of distribution mapping and other bias correction techniques in reproducing seasonal rainfall variability in southeastern Ethiopia
”,
Climate Services
, Vol.
41
, p.
100590
, doi: .
Acharki
,
F.
,
El Hamouz
,
R.
and
Boukdir
,
A.
(
2023
), “
Improving CMIP6 precipitation projections using distribution mapping in semi-arid Morocco
”,
Environmental Monitoring and Assessment
, Vol.
195
No.
11
, p.
1234
, doi: .
Acharki
,
S.
,
Taia
,
S.
,
Arjdal
,
Y.
and
Hack
,
J.
(
2023
), “
Hydrological modeling of spatial and temporal variations in streamflow due to multiple climate change scenarios in northwestern Morocco
”,
Climate Services
, Vol.
30
, p.
100388
, doi: .
Addor
,
N.
,
Rößler
,
O.
,
Köplin
,
N.
,
Huss
,
M.
,
Weingartner
,
R.
and
Seibert
,
J.
(
2014
), “
Robust changes and sources of uncertainty in the projected hydrological regimes of Swiss catchments
”,
Water Resources Research
, Vol.
50
No.
10
, pp.
5375
-
5377
, doi: .
Alemu
,
A.
,
Hailu
,
G.
and
Tessema
,
M.
(
2023
), “
Bias correction limitations of distribution mapping for CMIP6 precipitation in lowland Ethiopia
”,
Environmental Systems Research
, Vol.
12
No.
1
, p.
13
, doi: .
Ali
,
M.A.
,
Nega
,
M.
and
Wondimagegn
,
M.
(
2025
), “
Performance of bias correction methods for CMIP6 rainfall projections over East Africa
”,
Climate Services and Adaptation
, Vol.
7
No.
2
, pp.
115
-
132
, doi: .
Alizadeh
,
O.
(
2022
), “
Advances and challenges in climate modeling
”,
Climatic Change
, Vol.
170
Nos
1-2
, pp.
1
-
26
, doi: .
Alizadeh-Choobari
,
O.
(
2019
), “
Dynamical downscaling of CSIRO-Mk3.6 seasonal forecasts over Iran with the regional climate model version 4
”,
International Journal of Climatology
, Vol.
39
, pp.
3313
-
3322
, doi: .
Amognehegn
,
A.E.
,
Nigussie
,
A.B.
,
Ayalew
,
D.W.
and
Getnet
,
M.M.
(
2023
), “
Evaluating climate change impact on the hydrology of Kessie Watershed, UpperK Blue Nile Basin, Ethiopia
”,
Applied Water Science
, Vol.
13
No.
7
, doi: .
Azad
,
N.
and
Ahmadi
,
A.
(
2024
), “
Assessment of CMIP6 models and multi-model averaging for temperature and precipitation over Iran
”,
Scientific Reports
, Vol.
14
No.
1
, p.
24165
, doi: .
Aznar-Siguan
,
G.
,
de Souza
,
D.M.
and
Bresch
,
D.N.
(
2024
), “
Advances in machine learning-based statistical downscaling of climate data: applications and limitations
”,
Climatic Change
, Vol.
176
No.
3
, pp.
1
-
20
, doi: .
Babiker
,
W.
,
Tan
,
G.
,
Alriah
,
M.A.A.
and
Elameen
,
A.M.
(
2024
), “
Evaluation and correction analysis of the regional rainfall simulation by CMIP6 over Sudan
”,
Geographica Pannonica
, Vol.
28
No.
1
, pp.
53
-
70
, doi: .
Belay
,
A.M.
,
Zewdu
,
D.T.
and
Ademe
,
D.
(
2023
), “
Evaluation of bias correction techniques for CMIP6 precipitation data in the Abaya-Chamo Basin, Southern Ethiopia
”,
Environmental Monitoring and Assessment
, Vol.
195
No.
10
, p.
1145
, doi: .
Beyene
,
H.M.
,
Tulu
,
L.
and
Fekadu
,
A.
(
2023
), “
Evaluation of bias correction techniques for CMIP6 rainfall data in semi-arid regions of the Rift Valley
”,
Ethiopia. Theoretical and Applied Climatology
, Vol.
151
Nos
1-2
, pp.
299
-
315
, doi: .
Buishand
,
T.A.
(
1982
), “
Some methods for testing the homogeneity of precipitation records
”,
Journal of Hydrology
, Vol.
58
Nos
1-2
, p.
17
.
Cannistra
,
T.
(
2023
), “
Challenges, solutions, and future directions for statistical and dynamical downscaling of global climate models
” [online],
available at:
Link to Challenges, solutions, and future directions for statistical and dynamical downscaling of global climate modelsLink to a PDF of the cited article. (
accessed
29 July 2025).
Chae
,
J.
and
Chung
,
E.
(
2024
), “
Performance comparison of bias correction techniques in replicating CMIP6 rainfall for hydrological modeling in the Mokgam river basin
”,
Hydrology and Earth System Sciences
, Vol.
28
No.
1
, pp.
401
-
417
, doi: .
Chae
,
S.T.
and
Chung
,
E.S.
(
2024
), “
Significant contribution of bias correction methods to uncertainty in future runoff projections under CMIP6 climate change
”,
Journal of Hydrology: Regional Studies
, Vol.
56
, p.
101973
, doi: .
Chen
,
L.
,
Zhang
,
T.
and
Yao
,
X.
(
2025
), “
Incorporating observational uncertainties into bias correction methods for improved climate projections
”,
Environmental Modelling and Software
, Vol.
173
, p.
105732
, doi: .
Chinasho
,
A.
,
Bedadi
,
B.
,
Lemma
,
T.
,
Tana
,
T.
,
Hordofa
,
T.
and
Elias
,
B.
(
2021
), “
Evaluation of seven gap-filling techniques for daily station-based rainfall datasets in South Ethiopia
”,
Advances in Meteorology
, Vol.
2021
, doi: .
Daniel
,
H.
(
2023
), “
Performance assessment of bias correction methods using observed and regional climate model data in different watersheds, Ethiopia
”,
Journal of Water and Climate Change
, Vol.
14
No.
6
, pp.
2007
-
2028
, doi: .
Demelash
,
A.
and
Hassen
,
A.
(
2024
), “
Assessment of bias correction techniques for CMIP6 rainfall simulations in southern Ethiopia: implications for agricultural planning
”,
Weather and Climate Extremes
, Vol.
41
, p.
100604
, doi: .
Desta
,
A.
,
Tadesse
,
M.
and
Abebe
,
T.
(
2024
), “
Comparative evaluation of bias correction methods for extreme rainfall indices under CMIP6 scenarios in Ethiopia
”,
Climate Dynamics
, Vol.
62
No.
3
, pp.
1237
-
1256
, doi: .
Dinku
,
T.
,
Abera
,
T.
and
Mesfin
,
D.
(
2025
), “
Combining transformation and quantile-based methods for improved CMIP6 rainfall bias correction in East Africa
”,
Climate Services
, Vol.
39
, p.
100580
, doi: .
Dinku
,
T.
,
Kassa
,
B.
and
Lemma
,
G.
(
2024
), “
Enhancing drought monitoring in East Africa using percentile-based indicators
”,
Climate Risk Management
, Vol.
45
, p.
100512
, doi: .
Enyew
,
F.B.
,
Sahlu
,
D.
,
Tarekegn
,
G.B.
,
Hama
,
S.
and
Debele
,
S.E.
(
2024
), “
Performance evaluation of CMIP6 climate model projections for precipitation and temperature in the Upper Blue Nile
”,
Climate
, Vol.
12
No.
11
, pp.
1
-
22
, doi: .
Enyew
,
M.B.
,
Taye
,
M.T.
and
Mekonnen
,
D.T.
(
2024
), “
Evaluation of power transformation in bias correction of CMIP6 precipitation datasets in the Upper Blue Nile basin
”,
Ethiopia. Hydrological Sciences Journal
, Vol.
69
No.
2
, pp.
213
-
227
, doi: .
Feyissa
,
G.
and
Lemma
,
H.
(
2025
), “
Improving percentile-based precipitation projections using multiplicative delta change in semi-arid regions of Ethiopia
”,
Theoretical and Applied Climatology
, Vol.
153
No.
2
, pp.
441
-
457
, doi: .
Gashaw
,
T.
,
Abeyou
,
A.
,
Taye
,
M.T.
,
Lakew
,
H.B.
,
Seid
,
A.
and
Haileslassie
,
A.
(
2024
), “
Performance evaluations of CMIP6 model simulations and future projections of rainfall and temperature in the Bale Eco-Region, Southern Ethiopia
”,
Theoretical and Applied Climatology
, Vol.
155
No.
6
, pp.
5069
-
5092
.
Getahun
,
Y.S.
and
Wolde
,
M.S.
(
2025
), “
Assessment of bias correction methods on extreme rainfall events under CMIP6 models in southern Ethiopia
”,
Journal of Climate Research and Applications
, Vol.
17
No.
2
, pp.
114
-
128
, doi: .
Gizachew
,
Y.
,
Getachew
,
M.
and
Mulu
,
A.
(
2025
), “
Evaluation of LIS and other bias correction methods for high-quantile precipitation modeling in arid and semi-arid zones of Ethiopia
”,
Climatic Change
, Vol.
174
No.
2
, p.
23
, doi: .
Gusain
,
A.
,
Ghosh
,
S.
and
Karmakar
,
S.
(
2020
), “
Added value of CMIP6 over CMIP5 models in simulating Indian summer monsoon rainfall
”,
Atmospheric Research
, Vol.
232
, p.
104680
, doi: .
Gutmann
,
E.
,
Pruitt
,
T.
,
Clark
,
M.P.
,
Brekke
,
L.
,
Arnold
,
J.R.
,
Raff
,
D.A.
and
Rasmussen
,
R.M.
(
2014
), “
An intercomparison of statistical downscaling methods used for water resource assessments in the United States
”,
Water Resources Research
, Vol.
50
No.
9
, pp.
7167
-
7186
, doi: .
Hailemariam
,
B.T.
,
Tesfahunegn
,
G.B.
and
Mekonnen
,
L.
(
2023
), “
Performance of bias correction methods on low and high precipitation quantiles using CMIP6 models in the Ethiopian highlands
”,
Atmospheric Research
, Vol.
293
, p.
106000
, doi: .
Hailu
,
D.
and
Mersha
,
H.
(
2025
), “
Hybrid bias correction of precipitation using power transformation and quantile mapping under CMIP6 models in Ethiopia
”,
Climatic Change
, Vol.
175
No.
3
, p.
35
, doi: .
Johnson
,
F.
and
Sharma
,
A.
(
2011
), “
Accounting for interannual variability: a comparison of options for water resources climate change impact assessments
”,
Water Resources Research
, Vol.
47
No.
4
, pp.
1
-
20
, doi: .
Kebede
,
Y.
and
Asfaw
,
M.
(
2023
), “
Effectiveness of bias correction methods in CMIP6 rainfall data: a case study from central and southern Ethiopia
”,
Climate Research
, Vol.
91
No.
1
, pp.
85
-
102
, doi: .
Kharin
,
V.V.
,
Zwiers
,
F.W.
,
Zhang
,
X.
and
Wehner
,
M.
(
2013
), “
Changes in temperature and precipitation extremes in the CMIP5 ensemble
”,
Climatic Change
, Vol.
119
No.
2
, pp.
345
-
357
, doi: .
Lafferty
,
D.C.
,
Sriver
,
R.L.
,
Haqiqi
,
I.
,
Hertel
,
T.W.
,
Keller
,
K.
and
Nicholas
,
R.E.
(
2021
), “
Statistically bias-corrected and downscaled climate models underestimate the adverse effects of extreme heat on U.S. maize yields
”,
Communications Earth and Environment
, Vol.
2
No.
1
, p.
10
, doi: .
Lanzante
,
J.R.
,
Dixon
,
K.W.
,
Nath
,
M.J.
,
Whitlock
,
C.E.
and
Adams-Smith
,
D.
(
2018
), “
Some pitfalls in statistical downscaling of future climate
”,
Bulletin of the American Meteorological Society
, Vol.
99
No.
4
, pp.
791
-
803
, doi: .
Lebeza
,
T.M.
,
Gashaw
,
T.
,
Bayabil
,
H.K.
,
van Oel
,
P.R.
,
Worqlul
,
A.W.
,
Dile
,
Y.T.
and
Chukalla
,
A.D.
(
2024
), “
Performance of specific CMIP6 GCMs for simulating the historical rainfall and temperature climatology of Lake Tana sub-basin, Ethiopia
”,
Scientific African
, Vol.
26
, p.
e02387
, doi: .
Li
,
M.
and
Li
,
Z.
(
2025
), “
Scaling distribution mapping techniques for bias correction of CMIP6 precipitation in diverse climatic zones of Canada
”,
Theoretical and Applied Climatology
, Vol.
154
No.
2
, pp.
657
-
673
, doi: .
Li
,
X.
and
Li
,
Z.
(
2025
), “
Assessment of bias correction methods for high resolution daily precipitation projections with CMIP6 models: a Canadian case study
”,
Journal of Hydrology: Regional Studies
, Vol.
58
, p.
102223
, doi: .
Loikith
,
P.C.
,
Waliser
,
D.E.
and
Goodman
,
A.
(
2023
), “
Systematic evaluation of CMIP6 models across climate regimes: implications for regional climate studies
”,
Journal of Climate
, Vol.
36
No.
5
, pp.
1901
-
1920
, doi: .
Lukas
,
P.
,
Melesse
,
A.M.
and
Kenea
,
T.T.
(
2025
), “
Integrating land use/land cover and climate change projections to assess future hydrological responses: a CMIP6-based multi-scenario approach in the Omo–Gibe River Basin, Ethiopia
”,
Climate
, Vol.
13
No.
3
, p.
51
, doi: .
Luo
,
M.
,
Liu
,
T.
,
Meng
,
F.
,
Duan
,
Y.
,
Frankl
,
A.
,
Bao
,
A.
and
De Maeyer
,
P.
(
2018
), “
Comparing bias correction methods used in downscaling precipitation and temperature from regional climate models: a case study from the Kaidu River Basin in Western China
”,
Water
, Vol.
10
No.
8
, p.
1046
, doi: .
Mekuria
,
D.
and
Tadesse
,
M.
(
2024
), “
Performance of bias correction techniques in contrasting Ethiopian agroecologies: a case of distribution mapping
”,
Weather and Climate Extremes
, Vol.
38
, p.
100567
, doi: .
Mengistu
,
D.
,
Alemu
,
Z.
and
Girma
,
A.
(
2024
), “
Rainfall variability and its impact on agricultural productivity in the Wolaita zone
”,
Journal of Arid Environments
, Vol.
210
, p.
104947
.
Mohammed
,
H.
,
Asfaw
,
A.
and
Girma
,
T.
(
2025
), “
Uncertainty and overcorrection in bias-adjusted CMIP6 precipitation simulations in southern Ethiopia
”,
Theoretical and Applied Climatology
, Vol.
153
No.
4
, pp.
783
-
800
, doi: .
National Meteorological Institute of Ethiopia (NMI)
(
2023
), “
Addis Ababa, Ethiopia
”,
available at:
Link to Addis Ababa, EthiopiaLink to the cited article. (
accessed
29 July 2025).
Negash
,
M.
,
Dinku
,
T.
and
Woldeamlak
,
B.
(
2023
), “
Bias correction challenges in CMIP6 rainfall simulations for drought-prone regions of Ethiopia
”,
Climate Dynamics
, Vol.
62
No.
6
, pp.
1991
-
2010
, doi: .
Nguyen-Duy
,
T.
,
Ngo-Duc
,
T.
and
Desmet
,
Q.
(
2023
), “
Performance evaluation and ranking of CMIP6 global climate models over Vietnam
”,
Journal of Water and Climate Change
, Vol.
14
No.
6
, pp.
1831
-
1846
, doi: .
Oruc
,
S.
(
2022
), “
Performance of bias-corrected monthly CMIP6 climate projections with different reference period data in Turkey
”,
Acta Geophysica
, Vol.
70
No.
2
, pp.
777
-
789
.
Pettitt
,
A.N.
(
1979
), “
A non-parametric approach to the change-point problem
”,
Applied Statistics
, Vol.
28
No.
2
.
Qiu
,
H.
,
Hao
,
D.
,
Zeng
,
Y.
,
Zhang
,
X.
and
Chen
,
M.
(
2023
), “
Global and northern-high-latitude net ecosystem production in the 21st century from CMIP6 experiments
”,
Earth System Dynamics
, Vol.
14
No.
1
, pp.
1
-
16
, doi: .
Rauf
,
A.A.
and
Desta
,
G.T.
(
2023
), “
Applicability of multiplicative delta change for bias correcting CMIP6 data in semi-arid Ethiopia
”,
Environmental Research Letters
, Vol.
18
No.
11
, p.
114021
, doi: .
Rettie
,
F.M.
,
Gayler
,
S.
,
Weber
,
T.K.D.
,
Tesfaye
,
K.
and
Streck
,
T.
(
2023
), “
High-resolution CMIP6 climate projections for Ethiopia using the gridded statistical downscaling method
”,
Scientific Data
, Vol.
10
No.
1
, p.
18
, doi: .
Takhellambam
,
B.S.
,
Srivastava
,
P.
,
Lamba
,
J.
,
McGehee
,
R.P.
,
Kumar
,
H.
and
Tian
,
D.
(
2023
), “
Projected mid-century precipitation erosivity under climate change over the southeastern United States
”,
Science of The Total Environment
, Vol.
865
, p.
161119
, doi: .
Tapiador
,
F.J.
,
Navarro
,
A.
,
Moreno
,
R.
,
Sánchez
,
J.L.
and
García-Ortega
,
E.
(
2020
), “
Regional climate models: 30 years of dynamical downscaling
”,
Atmospheric Research
, Vol.
235
.
Tefera
,
G.W.
,
Dile
,
Y.T.
and
Ray
,
R.L.
(
2023
), “
Evaluating the impact of statistical bias correction on climate change signal and extreme indices in the Jemma Sub-Basin of Blue Nile Basin
”,
Sustainability
, Vol.
15
No.
13
, p.
10513
, doi: .
Tekle
,
G.
and
Dagne
,
K.
(
2024
), “
Evaluating bias correction methods for rainfall simulation in the Rift Valley of Ethiopia: the case of distribution mapping
”,
Weather and Climate Extremes
, Vol.
39
, p.
100577
, doi: .
Teklemariam
,
Y.
,
Gebremariam
,
D.
and
Worku
,
M.
(
2023
), “
Bias correction of CMIP6 precipitation extremes using the delta change method over the Ethiopian Rift Valley
”,
Journal of Hydrology: Regional Studies
, Vol.
48
, p.
101375
, doi: .
Tesfaye
,
S.
and
Endeshaw
,
A.
(
2024
), “
Performance of bias correction methods in reproducing daily rainfall extremes under changing climate conditions in Ethiopia
”,
Climate Services
, Vol.
38
, p.
100541
, doi: .
Trzaska
,
S.
and
Schnarr
,
E.A.
(
2023
), “
Review of downscaling methods for climate change projections: African and Latin American resilience to climate change (ARCC)
”,
available at:
Link to Review of downscaling methods for climate change projections: African and Latin American resilience to climate change (ARCC)Link to a PDF of the cited article. (
accessed
29 July 2025).
Tsegaye
,
B.
,
Kebede
,
A.
and
Yilma
,
S.
(
2023
), “
Bias correction of CMIP6 climate model outputs using multiplicative delta change in Upper Awash River Basin
”,
Ethiopia. Hydrology Research
, Vol.
54
No.
8
, pp.
873
-
889
, doi: .
Tsegaye
,
G.
,
Haile
,
A.T.
and
Demissie
,
Y.
(
2025
), “
Power transformation and quantile mapping for bias correction of CMIP6 rainfall in southern Ethiopia
”,
Journal of Hydrology: Regional Studies
, Vol.
50
, p.
101445
, doi: .
Tullu
,
K.T.
and
Tumsa
,
B.C.
(
2024
), “
Evaluating the impacts of climate change on soil loss using the CMIP6 model and RUSLE in the Muger watershed, Ethiopia
”,
Earth Science Informatics
, Vol.
18
No.
1
, p.
99
, doi: .
Wang
,
L.
,
Zhu
,
J.
and
Wang
,
D.
(
2025
), “
Comparative analysis of high-resolution CMIP6 GCM and CMIP5 RCM: unveiling biases and advancements in simulating compound extreme events in China
”,
Climate Dynamics
, Vol.
63
No.
2
, p.
91
, doi: .
Wang
,
Y.
,
Gao
,
X.
and
Zhang
,
H.
(
2024
), “
Progress and challenges in CMIP6 model improvements over CMIP5: a regional perspective
”,
Climate Dynamics
, Vol.
62
Nos
1-2
, pp.
345
-
362
, doi: .
Woldemariam
,
K.
and
Gebeyehu
,
D.
(
2025
), “
Quantile distortions from distribution mapping in CMIP6 rainfall bias correction over the Horn of Africa
”,
Climatic Change
, Vol.
175
No.
1
, p.
17
, doi: .
Addisuu
,
A.A.
,
Tsidu
,
G.M.
and
Basupi
,
L.V.
(
2023
), “
Improving daily CMIP6 precipitation in Southern Africa through bias correction—part 1: spatiotemporal characteristics
”,
Climate
, Vol.
13
No.
5
, p.
95
, doi: .
Brent
,
R.P.
(
1971
), “
An algorithm with guaranteed convergence for finding a zero of a function
”,
The Computer Journal
, Vol.
14
No.
4
, pp.
422
-
425
.
Chen
,
J.
,
Brissette
,
F.P.
and
Caya
,
D.
(
2020
), “
Remaining error sources in bias-corrected climate model outputs
”,
Climatic Change
, Vol.
162
No.
2
, pp.
563
-
582
, doi: .
Dinh
,
T.L.A.
and
Aires
,
F.
(
2022
), “
Revisiting the bias correction of climate models for impact studies
”,
Climatic Change
, Vol.
176
No.
10
, p.
140
, doi: .
Dinku
,
M.B.
and
Gibre
,
A.M.
(
2024
), “
Comparison of bias correction methods to regional climate model simulations for climate change projection in Muger Subbasin, Upper Blue Nile Basin, Ethiopia
”,
Journal of Water and Climate Change
, Vol.
15
No.
6
, pp.
2612
-
2627
, doi: .
Ersado
,
D.L.
and
Awoke
,
A.G.
(
2024
), “
A multi-criteria decision analysis approach for ranking the performance of CMIP6 models in reproducing precipitation patterns over Abaya-Chamo sub-basin, Ethiopia
”,
Heliyon
, Vol.
10
No.
12
, p.
e32442
, doi: .
Ezéchiel
,
O.
,
Eric
,
A.A.
,
Josué
,
Z.E.
, et al., (
2016
), “
Comparative study of seven bias correction methods applied to three regional climate models in Mekrou catchment (Benin, West Africa)
”,
International Journal of Current Engineering and Technology
, Vol.
6
, pp.
1831
-
1840
, available at:Link to Comparative study of seven bias correction methods applied to three regional climate models in Mekrou catchment (Benin, West Africa)Link to the cited article. (
accessed
29 July 2025).
Gebisa
,
B.T.
,
Dibaba
,
W.T.
and
Kabeta
,
A.
(
2023
), “
Evaluation of historical CMIP6 model simulations and future climate change projections in the Baro River Basin
”,
Journal of Water and Climate Change
, Vol.
14
No.
8
, pp.
2680
-
2705
, doi: .
Gidden
,
M.J.
,
Riahi
,
K.
,
Smith
,
S.J.
, et al., (
2019
), “
Global emissions pathways under different socioeconomic scenarios for use in CMIP6: a dataset of harmonized emissions trajectories through the end of the century
”,
Geoscientific Model Development
, Vol.
12
No.
4
, pp.
1443
-
1475
, doi: .
Gomes
,
F.P.
(
1985
),
Curso de Estatística Experimental
,
Nobel
,
São Paulo
.
Iizumi
,
T.
,
Takikawa
,
H.
,
Hirabayashi
,
Y.
et al. (
2017
), “
Contributions of different bias-correction methods and reference meteorological forcing data sets to uncertainty in projected temperature and precipitation extremes
”,
Journal of Geophysical Research: Atmospheres
, Vol.
122
No.
15
, pp.
7800
-
7819
, doi: .
Lee
,
J.-Y.
,
Marotzke
,
J.
,
Bala
,
G.
,
Cao
,
L.
,
Corti
,
S.
,
Dunne
,
J.P.
,
Engelbrecht
,
F.
,
Fischer
,
E.
,
Fyfe
,
J.C.
,
Jones
,
C.
,
Maycock
,
A.
,
Mutemi
,
J.
,
Ndiaye
,
O.
,
Panickal
,
S.
,
Zhou
,
T
(
2021
), “
Future global climate: scenario-based projections and near-term information
”, in:
V.
Masson-Delmotte
,
P.
Zhai
,
A.
Pirani
et al. (Eds)
, Climate Change 2021: The Physical Science Basis. Contribution of Working Group I to the Sixth Assessment Report of the Intergovernmental Panel on Climate Change.
Cambridge University Press
,
Cambridge, UK and New York, NY, USA
, pp.
553
-
672
, doi: .
Lehner
,
F.
,
Nadeem
,
I.
and
Formayer
,
H.
(
2023
), “
Evaluating skills and issues of quantile-based bias adjustment for climate change scenarios
”,
Advances in Statistical Climatology, Meteorology and Oceanography
, Vol.
9
No.
1
, pp.
29
-
44
, doi: .
Lei
,
Y.
,
Peng
,
P.
and
Jiang
,
W.
(
2023
), “
Evaluation of global climate models for the simulation of precipitation and maximum and minimum temperatures at coarser and finer resolutions based on temporal and spatial assessment metrics in mainland China
”,
Journal of Water and Climate Change
, Vol.
14
No.
5
, pp.
1585
-
1599
, doi: .
Mahato
,
S.
,
Behera
,
M.D.
and
Panda
,
S.N.
(
2023
), “
Review of downscaling approaches for climate impact assessment in agriculture and water resources
”,
Theoretical and Applied Climatology
, Vol.
151
Nos
3-4
, pp.
1395
-
1412
, doi: .
Makula
,
E.K.
and
Zhou
,
B.
(
2022
), “
Coupled model intercomparison project phase 6 evaluation and projection of East African precipitation
”,
International Journal of Climatology
, Vol.
42
No.
4
, pp.
2398
-
2412
, doi: .
McGibbon
,
J.
,
Clark
,
S.K.
,
Henn
,
B.
,
Kwa
,
A.
,
Watt‐Meyer
,
O.
,
Perkins
,
W.A.
and
Bretherton
,
C.S.
(
2024
), “
Global precipitation correction across a range of climates using CycleGAN
”,
Geophysical Research Letters
, Vol.
51
No.
4
, p.
e2023GL105131
, doi: .
Mengistu
,
A.G.
,
Tesfuhuney
,
W.A.
,
Woyessa
,
Y.E.
, et al., (
2025
), “
Contrasting hydro-climatic trends and drought dynamics in Ethiopia and South Africa under climate change
”,
Climate Dynamics
, Vol.
63
No.
2
, p.
105
, doi: .
Mmame
,
B.
and
Ngongondo
,
C.
(
2024
), “
Evaluation of CMIP6 model skills in simulating tropical climate extremes over Malawi, Southern Africa
”,
Modeling Earth Systems and Environment
, Vol.
10
No.
2
, pp.
1695
-
1709
, doi: .
Moore
,
K.
,
Pierson
,
D.
,
Pettersson
,
K.
,
Schneiderman
,
E.
and
Samuelsson
,
P.
(
2008
), “
Effects of warmer world scenarios on hydrologic inputs to Lake Mälaren, Sweden and implications for nutrient loads
”,
Hydrobiologia
, Vol.
599
No.
1
, pp.
191
-
199
, doi: .
O’Neill
,
B.C.
,
Kriegler
,
E.
and
Ebi
,
K.L.
(
2017
), “
The roads ahead: narratives for shared socioeconomic pathways describing world futures in the 21st century
”,
Global Environmental Change
, Vol.
42
, pp.
169
-
180
, doi: .
Panjwani
,
S.
,
Naresh
,
K.S.
and
Ahuja
,
L.
(
2020
), “
Simulation performance of selected global and regional climate models for temperature and precipitation in some locations in India
”,
Journal of Agrometeorology
, Vol.
22
, pp.
407
-
418
.
R-Instat
(
2023
), “
Download R-Instat
”,
available at:
Link to Download R-Instathttps://r-instat.org/Download.html. (
accessed
29 July 2025).
Sennikovs
,
J.
and
Bethers
,
U.
(
2023
), “
Statistical downscaling method of regional climate model results for hydrological modelling
”,
available at:
Link to Statistical downscaling method of regional climate model results for hydrological modellingLink to the cited article. (
accessed
29 July 2025).
Singh
,
V.
,
Kumar
,
R.
and
Ojha
,
C.S.P.
(
2023
), “
Hybrid bias correction methods for improving CMIP6 precipitation projections for hydrological modeling
”,
Hydrological Sciences Journal
, Vol.
68
No.
2
, pp.
223
-
239
, doi: .
SWAT Team
(
2022
), “
Bias correction manual for CMhyd
”,
Texas A&M University
,
available at:
Link to Bias correction manual for CMhydLink to a PDF of the cited article. (
accessed
29 July 2025).
Teutschbein
,
C.
and
Seibert
,
J.
(
2012
), “
Bias correction of regional climate model simulations for hydrological climate-change impact studies: review and evaluation of different methods
”,
Journal of Hydrology
, Vols
456-457
, pp.
12
-
29
, doi: .
Tiku
,
T.W.
,
Tarekegn
,
G.B.
,
Sahlu
,
D.
,
Teshebo
,
G.B.
,
Enyew
,
F.B.
,
Umer
,
Y.
and
Debele
,
S.E.
(
2025
), “
Evaluating CMIP6 precipitation simulations across different rainfall regimes in the Amhara Region, Ethiopia
”,
Natural Hazards Research, 2025
, Vol.
5
No.
3
, doi: .
Tong
,
Y.
,
Gao
,
X.
,
Han
,
Z.
, et al., (
2021
), “
Bias correction of temperature and precipitation over China for RCM simulations using the QM and QDM methods
”,
Climate Dynamics
, Vol.
57
Nos
5-6
, pp.
1425
-
1443
, doi: .
Tschöke
,
G.V.
,
Kruk
,
N.S.
,
de Queiroz
,
P.I.B.
, et al., (
2017
), “
Comparison of two bias correction methods for precipitation simulated with a regional climate model
”,
Theoretical and Applied Climatology
, Vol.
127
Nos
3-4
, pp.
841
-
852
, doi: .
Yang
,
W.
,
Seager
,
R.
,
Cane
,
M.A.
, et al., (
2015
), “
The rainfall annual cycle bias over East Africa in CMIP5 coupled climate models
”,
Journal of Climate
, Vol.
28
No.
24
, pp.
9789
-
9802
.
Zebaze
,
S.
,
Jain
,
S.
,
Salunke
,
P.
, et al., (
2019
), “
Assessment of CMIP5 multi-model mean for the historical climate of Africa
”,
Atmospheric Science Letters
, Vol.
20
No.
8
, p.
e926
.
Published by Emerald Publishing Limited. This article is published under the Creative Commons Attribution (CC BY 4.0) licence. Anyone may reproduce, distribute, translate and create derivative works of this article (for both commercial and non-commercial purposes), subject to full attribution to the original publication and authors. The full terms of this licence maybe seen at Link to the terms of the CC BY 4.0 licenceLink to the terms of the CC BY 4.0 licence.

Data & Figures

Figure 1.
A map highlighting the Wolaita Zone in Ethiopia with meteorological stations marked across its drylands.The upper section outlines Ethiopia, showing the location of the Wolaita Zone within the national boundary. The lower section focuses on the Wolaita Zone itself, displaying meteorological stations at Bele, Gessuba, Humbo, and Bilate using red diamond markers. The map includes latitude and longitude coordinates, a north arrow for orientation, and a scale of one to seven hundred thousand. It visually represents the spatial distribution of dryland monitoring sites within the region.

Map of selected drylands in Wolaita Zone, southern Ethiopia

Source: Figure by author

Figure 1.
A map highlighting the Wolaita Zone in Ethiopia with meteorological stations marked across its drylands.The upper section outlines Ethiopia, showing the location of the Wolaita Zone within the national boundary. The lower section focuses on the Wolaita Zone itself, displaying meteorological stations at Bele, Gessuba, Humbo, and Bilate using red diamond markers. The map includes latitude and longitude coordinates, a north arrow for orientation, and a scale of one to seven hundred thousand. It visually represents the spatial distribution of dryland monitoring sites within the region.

Map of selected drylands in Wolaita Zone, southern Ethiopia

Source: Figure by author

Close modal
Figure 2.
A combined bar and line chart displaying monthly rainfall and temperature trends.The chart compares rainfall in millimetres and temperature in degrees Celsius across twelve months. Rainfall peaks between April and August, reaching around 140 millimetres, while minimum levels occur in January and December. The maximum temperature line remains steady near 30 degrees Celsius throughout the year, while the minimum temperature stays around 15 degrees Celsius. The x-axis represents months, and the y-axes display rainfall and temperature respectively, showing the regions warm climate with distinct wet and dry seasons.

Monthly distribution of maximum temperature (°C, red line), minimum temperature (°C, green line) and rainfall (mm, bar) across southern Ethiopia and for the period 1990–2021

Source: Figure by author

Figure 2.
A combined bar and line chart displaying monthly rainfall and temperature trends.The chart compares rainfall in millimetres and temperature in degrees Celsius across twelve months. Rainfall peaks between April and August, reaching around 140 millimetres, while minimum levels occur in January and December. The maximum temperature line remains steady near 30 degrees Celsius throughout the year, while the minimum temperature stays around 15 degrees Celsius. The x-axis represents months, and the y-axes display rainfall and temperature respectively, showing the regions warm climate with distinct wet and dry seasons.

Monthly distribution of maximum temperature (°C, red line), minimum temperature (°C, green line) and rainfall (mm, bar) across southern Ethiopia and for the period 1990–2021

Source: Figure by author

Close modal
Figure 3.
Four line charts show raw and Multi model Linear Scaling adjusted tenth and ninetieth percentiles of precipitation from multiple climate models.The first row presents raw and adjusted tenth percentiles of precipitation across months using data from A C C E S S C M 2, E C Earth 3, H a d G E M 3 G C 3 1 L, M I R O C E S 2 L, and M P I E S M 1.2 H R models. After Multi model Linear Scaling adjustment, model variations reduce and align more closely with observed data. The second row compares raw and adjusted ninetieth percentiles of precipitation, showing improved consistency and reduced extremes after adjustment. The horizontal axis represents months, and the vertical axis indicates precipitation in millimetres per day.

Performance of multiplicative linear scaling (MLS) bias correction method applied on 10th and 90th percentiles of precipitation datasets CMIP6 in southern Ethiopia

Source: Figure by author

Figure 3.
Four line charts show raw and Multi model Linear Scaling adjusted tenth and ninetieth percentiles of precipitation from multiple climate models.The first row presents raw and adjusted tenth percentiles of precipitation across months using data from A C C E S S C M 2, E C Earth 3, H a d G E M 3 G C 3 1 L, M I R O C E S 2 L, and M P I E S M 1.2 H R models. After Multi model Linear Scaling adjustment, model variations reduce and align more closely with observed data. The second row compares raw and adjusted ninetieth percentiles of precipitation, showing improved consistency and reduced extremes after adjustment. The horizontal axis represents months, and the vertical axis indicates precipitation in millimetres per day.

Performance of multiplicative linear scaling (MLS) bias correction method applied on 10th and 90th percentiles of precipitation datasets CMIP6 in southern Ethiopia

Source: Figure by author

Close modal
Figure 4.
Four line charts compare raw and Mean Deviation Correction adjusted tenth and ninetieth percentiles of precipitation.The top charts display raw and Mean Deviation Correction adjusted tenth percentiles, where the correction smooths the monthly variations and aligns model data more closely. The bottom charts show raw and adjusted ninetieth percentiles, with clear reduction in extreme precipitation differences between models. Observations and outputs from A C C E S S C M 2, E C Earth 3, H a d G E M 3 G C 3 1 L, M I R O C E S 2 L, and M P I E S M 1.2 H R models are compared. The adjustment improves agreement across models throughout the months, as shown on the horizontal axis, while the vertical axis indicates precipitation in millimetres per day.

Performance of multiplicative delta change (MDC) bias correction technique on 10th and 90th percentiles of CMIP6 precipitation datasets over southern Ethiopia

Source: Figure by author

Figure 4.
Four line charts compare raw and Mean Deviation Correction adjusted tenth and ninetieth percentiles of precipitation.The top charts display raw and Mean Deviation Correction adjusted tenth percentiles, where the correction smooths the monthly variations and aligns model data more closely. The bottom charts show raw and adjusted ninetieth percentiles, with clear reduction in extreme precipitation differences between models. Observations and outputs from A C C E S S C M 2, E C Earth 3, H a d G E M 3 G C 3 1 L, M I R O C E S 2 L, and M P I E S M 1.2 H R models are compared. The adjustment improves agreement across models throughout the months, as shown on the horizontal axis, while the vertical axis indicates precipitation in millimetres per day.

Performance of multiplicative delta change (MDC) bias correction technique on 10th and 90th percentiles of CMIP6 precipitation datasets over southern Ethiopia

Source: Figure by author

Close modal
Figure 5.
Four line charts compare raw and Linear Scaling adjusted tenth and ninetieth precipitation percentiles using multiple climate models.The first row compares raw and adjusted tenth percentiles of precipitation from observed data and climate models including A C C E S S C M 2, A C C E S S E S M 1.5, E C Earth 3, H a d G E M 3 G C 3 1 L, M I R O C E S 2 L, and M P I E S M 1.2 H R. The Linear Scaling adjustment smooths the data and aligns models closer to observations. The second row presents raw and adjusted ninetieth percentiles, showing improved consistency among models and reduced extreme precipitation variations after correction. The horizontal axis represents months from January to December, and the vertical axis represents precipitation in millimetres per day.

Performance of local intensity scaling (LIS) bias correction method applied on 10th and 90th percentiles of CMIP6 precipitation datasets in southern Ethiopia

Source: Figure by author

Figure 5.
Four line charts compare raw and Linear Scaling adjusted tenth and ninetieth precipitation percentiles using multiple climate models.The first row compares raw and adjusted tenth percentiles of precipitation from observed data and climate models including A C C E S S C M 2, A C C E S S E S M 1.5, E C Earth 3, H a d G E M 3 G C 3 1 L, M I R O C E S 2 L, and M P I E S M 1.2 H R. The Linear Scaling adjustment smooths the data and aligns models closer to observations. The second row presents raw and adjusted ninetieth percentiles, showing improved consistency among models and reduced extreme precipitation variations after correction. The horizontal axis represents months from January to December, and the vertical axis represents precipitation in millimetres per day.

Performance of local intensity scaling (LIS) bias correction method applied on 10th and 90th percentiles of CMIP6 precipitation datasets in southern Ethiopia

Source: Figure by author

Close modal
Figure 6.
Four line charts display raw and Power Transformation adjusted tenth and ninetieth precipitation percentiles from various models.The upper charts show the tenth percentile precipitation data before and after Power Transformation adjustment, highlighting smoother seasonal variation and better model agreement. The lower charts display raw and adjusted ninetieth percentiles, showing improved model alignment and less variability after correction. Observations and model data from A C C E S S C M 2, A C C E S S E S M 1.5, E C Earth 3, H a d G E M 3 G C 3 1 L, M I R O C E S 2 L, and M P I E S M 1.2 H R are compared across months. The horizontal axis shows the months, and the vertical axis indicates precipitation in millimetres per day.

Performance of power transformation (PT) bias correction method applied on 10th and 90th percentiles of CMIP6 precipitation data sets in southern Ethiopia

Source: Figure by author

Figure 6.
Four line charts display raw and Power Transformation adjusted tenth and ninetieth precipitation percentiles from various models.The upper charts show the tenth percentile precipitation data before and after Power Transformation adjustment, highlighting smoother seasonal variation and better model agreement. The lower charts display raw and adjusted ninetieth percentiles, showing improved model alignment and less variability after correction. Observations and model data from A C C E S S C M 2, A C C E S S E S M 1.5, E C Earth 3, H a d G E M 3 G C 3 1 L, M I R O C E S 2 L, and M P I E S M 1.2 H R are compared across months. The horizontal axis shows the months, and the vertical axis indicates precipitation in millimetres per day.

Performance of power transformation (PT) bias correction method applied on 10th and 90th percentiles of CMIP6 precipitation data sets in southern Ethiopia

Source: Figure by author

Close modal
Figure 7.
Four line charts compare raw and Detrended Mean adjusted tenth and ninetieth percentiles of precipitation using multiple climate models.The top charts show raw and Detrended Mean adjusted tenth percentiles of precipitation for observed data and models such as A C C E S S C M 2, A C C E S S E S M 1.5, E C Earth 3, H a d G E M 3 G C 3 1 L, M I R O C E S 2 L, and M P I E S M 1.2 H R. The adjustment smooths fluctuations and aligns model results more closely with observed precipitation. The bottom charts display raw and adjusted ninetieth percentiles, showing reduced variability and improved agreement among models after Detrended Mean correction. The horizontal axis represents months from January to December, and the vertical axis indicates precipitation in millimetres per day.

Performance of distribution mapping (DM) bias correction method applied on 10th and 90th percentiles of precipitation data sets of CMIP6 in southern Ethiopia

Source: Figure by author

Figure 7.
Four line charts compare raw and Detrended Mean adjusted tenth and ninetieth percentiles of precipitation using multiple climate models.The top charts show raw and Detrended Mean adjusted tenth percentiles of precipitation for observed data and models such as A C C E S S C M 2, A C C E S S E S M 1.5, E C Earth 3, H a d G E M 3 G C 3 1 L, M I R O C E S 2 L, and M P I E S M 1.2 H R. The adjustment smooths fluctuations and aligns model results more closely with observed precipitation. The bottom charts display raw and adjusted ninetieth percentiles, showing reduced variability and improved agreement among models after Detrended Mean correction. The horizontal axis represents months from January to December, and the vertical axis indicates precipitation in millimetres per day.

Performance of distribution mapping (DM) bias correction method applied on 10th and 90th percentiles of precipitation data sets of CMIP6 in southern Ethiopia

Source: Figure by author

Close modal
Table 1.

Performance of multiplicative linear scaling (MLS) on selected precipitation data sets from CMIP6 GCMs in Southern Ethiopia

RawAfter MLS
CMIP6MAER2NSEMAER2NSE
ACCESS-CM2216.650.06−1.06233.510.07−1.33
ACCESS-ESM1-5788.170.02−25.32222.810.04−1.31
EC-Earth3-Veg235.590.17−1.83191.230.19−0.91
HadGEM3-GC31-LL196.140.02−0.89414.660.11−13.53
MIROC-ES2L1321.550.00−58.71171.930.00−0.19
MPI-ESM1-2-HR169.390.16−0.23164.790.10−0.42
Ensemble337.660.01−3.98141.050.200.15
Note(s):

MAE (given in mm) = mean absolute error; NSE = Nash–Sutcliffe measure of efficiency; R2 = coefficient of determination

Source(s): Table by author
Table 2.

Similar to Table 1, for the multiplicative delta change (MDC) bias correction method

RawAfter MDC
CMIP6 MAER2NSEMAER2NSE
ACCESS-CM2216.730.06−2.2173.180.990.82
ACCESS-ESM1-5788.210.017−5.2273.180.990.82
EC-Earth3-Veg235.520.17−2.4953.180.990.9
HadGEM3-GC31-LL195.740.02−0.62646.820.990.93
MIROC-ES2L1321.660.005−72.8896.820.990.71
MPI-ESM1-2-HR169.550.16−1.799.610.990.99
Ensemble337.810.006−15.9510.920.990.99
Source(s): Table by author
Table 3.

Similar to Table 1, for the local intensity scaling (LIS) bias correction method

RawAfter LIS
CMIP6 MAER2NSEMAER2NSE
ACCESS-CM2216.800.06−1.05243.890.07−1.54
ACCESS-ESM1-5788.240.02−25.32258.030.04−2.31
EC-Earth3-Veg235.520.17−1.83204.420.18−1.25
HadGEM3-GC31-LL195.740.02−0.88442.280.10−15.00
MIROC-ES2L1321.660.00−58.72170.560.01−0.21
MPI-ESM1-2-HR169.550.16−0.23175.200.07−0.64
Ensemble337.480.01−3.98146.570.170.07
Source(s): Table by author
Table 4.

Like in Table 1, power transformation (PT) as the bias correction method

RawAfter PT
CMIP6 MAER2NSEMAER2NSE
ACCESS-CM2216.800.06−1.05242.690.09−1.57
ACCESS-ESM1-5788.240.02−25.32287.960.05−3.26
EC-Earth3-Veg235.520.17−1.83234.220.14−1.84
HadGEM3-GC31-LL195.740.02−0.88407.420.09−11.19
MIROC-ES2L1321.660.00−58.72201.320.05−0.68
MPI-ESM1-2-HR169.550.16−0.23182.840.03−0.84
Ensemble337.480.01−3.98159.500.12−0.04
Source(s): Table by author
Table 5.

Similar to Table 1, for the distribution mapping (DM) bias correction method

RawAfter DM
CMIP6 MAER2NSEMAER2NSE
ACCESS-CM2216.800.06−1.05249.620.11−1.82
ACCESS-ESM1-5788.240.02−25.32299.810.05−3.85
EC-Earth3-Veg235.520.17−1.83228.920.16−1.72
HadGEM3-GC31-LL195.740.02−0.88426.550.09−12.14
MIROC-ES2L1321.660.00−58.72199.370.08−0.71
MPI-ESM1-2-HR169.550.16−0.23206.030.01−1.17
Ensemble337.480.01−3.98179.600.03−0.39
Source(s): Table by author

Supplements

References

Abate
,
H.
and
Workineh
,
B.
(
2025
), “
Evaluation of distribution mapping and other bias correction techniques in reproducing seasonal rainfall variability in southeastern Ethiopia
”,
Climate Services
, Vol.
41
, p.
100590
, doi: .
Acharki
,
F.
,
El Hamouz
,
R.
and
Boukdir
,
A.
(
2023
), “
Improving CMIP6 precipitation projections using distribution mapping in semi-arid Morocco
”,
Environmental Monitoring and Assessment
, Vol.
195
No.
11
, p.
1234
, doi: .
Acharki
,
S.
,
Taia
,
S.
,
Arjdal
,
Y.
and
Hack
,
J.
(
2023
), “
Hydrological modeling of spatial and temporal variations in streamflow due to multiple climate change scenarios in northwestern Morocco
”,
Climate Services
, Vol.
30
, p.
100388
, doi: .
Addor
,
N.
,
Rößler
,
O.
,
Köplin
,
N.
,
Huss
,
M.
,
Weingartner
,
R.
and
Seibert
,
J.
(
2014
), “
Robust changes and sources of uncertainty in the projected hydrological regimes of Swiss catchments
”,
Water Resources Research
, Vol.
50
No.
10
, pp.
5375
-
5377
, doi: .
Alemu
,
A.
,
Hailu
,
G.
and
Tessema
,
M.
(
2023
), “
Bias correction limitations of distribution mapping for CMIP6 precipitation in lowland Ethiopia
”,
Environmental Systems Research
, Vol.
12
No.
1
, p.
13
, doi: .
Ali
,
M.A.
,
Nega
,
M.
and
Wondimagegn
,
M.
(
2025
), “
Performance of bias correction methods for CMIP6 rainfall projections over East Africa
”,
Climate Services and Adaptation
, Vol.
7
No.
2
, pp.
115
-
132
, doi: .
Alizadeh
,
O.
(
2022
), “
Advances and challenges in climate modeling
”,
Climatic Change
, Vol.
170
Nos
1-2
, pp.
1
-
26
, doi: .
Alizadeh-Choobari
,
O.
(
2019
), “
Dynamical downscaling of CSIRO-Mk3.6 seasonal forecasts over Iran with the regional climate model version 4
”,
International Journal of Climatology
, Vol.
39
, pp.
3313
-
3322
, doi: .
Amognehegn
,
A.E.
,
Nigussie
,
A.B.
,
Ayalew
,
D.W.
and
Getnet
,
M.M.
(
2023
), “
Evaluating climate change impact on the hydrology of Kessie Watershed, UpperK Blue Nile Basin, Ethiopia
”,
Applied Water Science
, Vol.
13
No.
7
, doi: .
Azad
,
N.
and
Ahmadi
,
A.
(
2024
), “
Assessment of CMIP6 models and multi-model averaging for temperature and precipitation over Iran
”,
Scientific Reports
, Vol.
14
No.
1
, p.
24165
, doi: .
Aznar-Siguan
,
G.
,
de Souza
,
D.M.
and
Bresch
,
D.N.
(
2024
), “
Advances in machine learning-based statistical downscaling of climate data: applications and limitations
”,
Climatic Change
, Vol.
176
No.
3
, pp.
1
-
20
, doi: .
Babiker
,
W.
,
Tan
,
G.
,
Alriah
,
M.A.A.
and
Elameen
,
A.M.
(
2024
), “
Evaluation and correction analysis of the regional rainfall simulation by CMIP6 over Sudan
”,
Geographica Pannonica
, Vol.
28
No.
1
, pp.
53
-
70
, doi: .
Belay
,
A.M.
,
Zewdu
,
D.T.
and
Ademe
,
D.
(
2023
), “
Evaluation of bias correction techniques for CMIP6 precipitation data in the Abaya-Chamo Basin, Southern Ethiopia
”,
Environmental Monitoring and Assessment
, Vol.
195
No.
10
, p.
1145
, doi: .
Beyene
,
H.M.
,
Tulu
,
L.
and
Fekadu
,
A.
(
2023
), “
Evaluation of bias correction techniques for CMIP6 rainfall data in semi-arid regions of the Rift Valley
”,
Ethiopia. Theoretical and Applied Climatology
, Vol.
151
Nos
1-2
, pp.
299
-
315
, doi: .
Buishand
,
T.A.
(
1982
), “
Some methods for testing the homogeneity of precipitation records
”,
Journal of Hydrology
, Vol.
58
Nos
1-2
, p.
17
.
Cannistra
,
T.
(
2023
), “
Challenges, solutions, and future directions for statistical and dynamical downscaling of global climate models
” [online],
available at:
Link to Challenges, solutions, and future directions for statistical and dynamical downscaling of global climate modelsLink to a PDF of the cited article. (
accessed
29 July 2025).
Chae
,
J.
and
Chung
,
E.
(
2024
), “
Performance comparison of bias correction techniques in replicating CMIP6 rainfall for hydrological modeling in the Mokgam river basin
”,
Hydrology and Earth System Sciences
, Vol.
28
No.
1
, pp.
401
-
417
, doi: .
Chae
,
S.T.
and
Chung
,
E.S.
(
2024
), “
Significant contribution of bias correction methods to uncertainty in future runoff projections under CMIP6 climate change
”,
Journal of Hydrology: Regional Studies
, Vol.
56
, p.
101973
, doi: .
Chen
,
L.
,
Zhang
,
T.
and
Yao
,
X.
(
2025
), “
Incorporating observational uncertainties into bias correction methods for improved climate projections
”,
Environmental Modelling and Software
, Vol.
173
, p.
105732
, doi: .
Chinasho
,
A.
,
Bedadi
,
B.
,
Lemma
,
T.
,
Tana
,
T.
,
Hordofa
,
T.
and
Elias
,
B.
(
2021
), “
Evaluation of seven gap-filling techniques for daily station-based rainfall datasets in South Ethiopia
”,
Advances in Meteorology
, Vol.
2021
, doi: .
Daniel
,
H.
(
2023
), “
Performance assessment of bias correction methods using observed and regional climate model data in different watersheds, Ethiopia
”,
Journal of Water and Climate Change
, Vol.
14
No.
6
, pp.
2007
-
2028
, doi: .
Demelash
,
A.
and
Hassen
,
A.
(
2024
), “
Assessment of bias correction techniques for CMIP6 rainfall simulations in southern Ethiopia: implications for agricultural planning
”,
Weather and Climate Extremes
, Vol.
41
, p.
100604
, doi: .
Desta
,
A.
,
Tadesse
,
M.
and
Abebe
,
T.
(
2024
), “
Comparative evaluation of bias correction methods for extreme rainfall indices under CMIP6 scenarios in Ethiopia
”,
Climate Dynamics
, Vol.
62
No.
3
, pp.
1237
-
1256
, doi: .
Dinku
,
T.
,
Abera
,
T.
and
Mesfin
,
D.
(
2025
), “
Combining transformation and quantile-based methods for improved CMIP6 rainfall bias correction in East Africa
”,
Climate Services
, Vol.
39
, p.
100580
, doi: .
Dinku
,
T.
,
Kassa
,
B.
and
Lemma
,
G.
(
2024
), “
Enhancing drought monitoring in East Africa using percentile-based indicators
”,
Climate Risk Management
, Vol.
45
, p.
100512
, doi: .
Enyew
,
F.B.
,
Sahlu
,
D.
,
Tarekegn
,
G.B.
,
Hama
,
S.
and
Debele
,
S.E.
(
2024
), “
Performance evaluation of CMIP6 climate model projections for precipitation and temperature in the Upper Blue Nile
”,
Climate
, Vol.
12
No.
11
, pp.
1
-
22
, doi: .
Enyew
,
M.B.
,
Taye
,
M.T.
and
Mekonnen
,
D.T.
(
2024
), “
Evaluation of power transformation in bias correction of CMIP6 precipitation datasets in the Upper Blue Nile basin
”,
Ethiopia. Hydrological Sciences Journal
, Vol.
69
No.
2
, pp.
213
-
227
, doi: .
Feyissa
,
G.
and
Lemma
,
H.
(
2025
), “
Improving percentile-based precipitation projections using multiplicative delta change in semi-arid regions of Ethiopia
”,
Theoretical and Applied Climatology
, Vol.
153
No.
2
, pp.
441
-
457
, doi: .
Gashaw
,
T.
,
Abeyou
,
A.
,
Taye
,
M.T.
,
Lakew
,
H.B.
,
Seid
,
A.
and
Haileslassie
,
A.
(
2024
), “
Performance evaluations of CMIP6 model simulations and future projections of rainfall and temperature in the Bale Eco-Region, Southern Ethiopia
”,
Theoretical and Applied Climatology
, Vol.
155
No.
6
, pp.
5069
-
5092
.
Getahun
,
Y.S.
and
Wolde
,
M.S.
(
2025
), “
Assessment of bias correction methods on extreme rainfall events under CMIP6 models in southern Ethiopia
”,
Journal of Climate Research and Applications
, Vol.
17
No.
2
, pp.
114
-
128
, doi: .
Gizachew
,
Y.
,
Getachew
,
M.
and
Mulu
,
A.
(
2025
), “
Evaluation of LIS and other bias correction methods for high-quantile precipitation modeling in arid and semi-arid zones of Ethiopia
”,
Climatic Change
, Vol.
174
No.
2
, p.
23
, doi: .
Gusain
,
A.
,
Ghosh
,
S.
and
Karmakar
,
S.
(
2020
), “
Added value of CMIP6 over CMIP5 models in simulating Indian summer monsoon rainfall
”,
Atmospheric Research
, Vol.
232
, p.
104680
, doi: .
Gutmann
,
E.
,
Pruitt
,
T.
,
Clark
,
M.P.
,
Brekke
,
L.
,
Arnold
,
J.R.
,
Raff
,
D.A.
and
Rasmussen
,
R.M.
(
2014
), “
An intercomparison of statistical downscaling methods used for water resource assessments in the United States
”,
Water Resources Research
, Vol.
50
No.
9
, pp.
7167
-
7186
, doi: .
Hailemariam
,
B.T.
,
Tesfahunegn
,
G.B.
and
Mekonnen
,
L.
(
2023
), “
Performance of bias correction methods on low and high precipitation quantiles using CMIP6 models in the Ethiopian highlands
”,
Atmospheric Research
, Vol.
293
, p.
106000
, doi: .
Hailu
,
D.
and
Mersha
,
H.
(
2025
), “
Hybrid bias correction of precipitation using power transformation and quantile mapping under CMIP6 models in Ethiopia
”,
Climatic Change
, Vol.
175
No.
3
, p.
35
, doi: .
Johnson
,
F.
and
Sharma
,
A.
(
2011
), “
Accounting for interannual variability: a comparison of options for water resources climate change impact assessments
”,
Water Resources Research
, Vol.
47
No.
4
, pp.
1
-
20
, doi: .
Kebede
,
Y.
and
Asfaw
,
M.
(
2023
), “
Effectiveness of bias correction methods in CMIP6 rainfall data: a case study from central and southern Ethiopia
”,
Climate Research
, Vol.
91
No.
1
, pp.
85
-
102
, doi: .
Kharin
,
V.V.
,
Zwiers
,
F.W.
,
Zhang
,
X.
and
Wehner
,
M.
(
2013
), “
Changes in temperature and precipitation extremes in the CMIP5 ensemble
”,
Climatic Change
, Vol.
119
No.
2
, pp.
345
-
357
, doi: .
Lafferty
,
D.C.
,
Sriver
,
R.L.
,
Haqiqi
,
I.
,
Hertel
,
T.W.
,
Keller
,
K.
and
Nicholas
,
R.E.
(
2021
), “
Statistically bias-corrected and downscaled climate models underestimate the adverse effects of extreme heat on U.S. maize yields
”,
Communications Earth and Environment
, Vol.
2
No.
1
, p.
10
, doi: .
Lanzante
,
J.R.
,
Dixon
,
K.W.
,
Nath
,
M.J.
,
Whitlock
,
C.E.
and
Adams-Smith
,
D.
(
2018
), “
Some pitfalls in statistical downscaling of future climate
”,
Bulletin of the American Meteorological Society
, Vol.
99
No.
4
, pp.
791
-
803
, doi: .
Lebeza
,
T.M.
,
Gashaw
,
T.
,
Bayabil
,
H.K.
,
van Oel
,
P.R.
,
Worqlul
,
A.W.
,
Dile
,
Y.T.
and
Chukalla
,
A.D.
(
2024
), “
Performance of specific CMIP6 GCMs for simulating the historical rainfall and temperature climatology of Lake Tana sub-basin, Ethiopia
”,
Scientific African
, Vol.
26
, p.
e02387
, doi: .
Li
,
M.
and
Li
,
Z.
(
2025
), “
Scaling distribution mapping techniques for bias correction of CMIP6 precipitation in diverse climatic zones of Canada
”,
Theoretical and Applied Climatology
, Vol.
154
No.
2
, pp.
657
-
673
, doi: .
Li
,
X.
and
Li
,
Z.
(
2025
), “
Assessment of bias correction methods for high resolution daily precipitation projections with CMIP6 models: a Canadian case study
”,
Journal of Hydrology: Regional Studies
, Vol.
58
, p.
102223
, doi: .
Loikith
,
P.C.
,
Waliser
,
D.E.
and
Goodman
,
A.
(
2023
), “
Systematic evaluation of CMIP6 models across climate regimes: implications for regional climate studies
”,
Journal of Climate
, Vol.
36
No.
5
, pp.
1901
-
1920
, doi: .
Lukas
,
P.
,
Melesse
,
A.M.
and
Kenea
,
T.T.
(
2025
), “
Integrating land use/land cover and climate change projections to assess future hydrological responses: a CMIP6-based multi-scenario approach in the Omo–Gibe River Basin, Ethiopia
”,
Climate
, Vol.
13
No.
3
, p.
51
, doi: .
Luo
,
M.
,
Liu
,
T.
,
Meng
,
F.
,
Duan
,
Y.
,
Frankl
,
A.
,
Bao
,
A.
and
De Maeyer
,
P.
(
2018
), “
Comparing bias correction methods used in downscaling precipitation and temperature from regional climate models: a case study from the Kaidu River Basin in Western China
”,
Water
, Vol.
10
No.
8
, p.
1046
, doi: .
Mekuria
,
D.
and
Tadesse
,
M.
(
2024
), “
Performance of bias correction techniques in contrasting Ethiopian agroecologies: a case of distribution mapping
”,
Weather and Climate Extremes
, Vol.
38
, p.
100567
, doi: .
Mengistu
,
D.
,
Alemu
,
Z.
and
Girma
,
A.
(
2024
), “
Rainfall variability and its impact on agricultural productivity in the Wolaita zone
”,
Journal of Arid Environments
, Vol.
210
, p.
104947
.
Mohammed
,
H.
,
Asfaw
,
A.
and
Girma
,
T.
(
2025
), “
Uncertainty and overcorrection in bias-adjusted CMIP6 precipitation simulations in southern Ethiopia
”,
Theoretical and Applied Climatology
, Vol.
153
No.
4
, pp.
783
-
800
, doi: .
National Meteorological Institute of Ethiopia (NMI)
(
2023
), “
Addis Ababa, Ethiopia
”,
available at:
Link to Addis Ababa, EthiopiaLink to the cited article. (
accessed
29 July 2025).
Negash
,
M.
,
Dinku
,
T.
and
Woldeamlak
,
B.
(
2023
), “
Bias correction challenges in CMIP6 rainfall simulations for drought-prone regions of Ethiopia
”,
Climate Dynamics
, Vol.
62
No.
6
, pp.
1991
-
2010
, doi: .
Nguyen-Duy
,
T.
,
Ngo-Duc
,
T.
and
Desmet
,
Q.
(
2023
), “
Performance evaluation and ranking of CMIP6 global climate models over Vietnam
”,
Journal of Water and Climate Change
, Vol.
14
No.
6
, pp.
1831
-
1846
, doi: .
Oruc
,
S.
(
2022
), “
Performance of bias-corrected monthly CMIP6 climate projections with different reference period data in Turkey
”,
Acta Geophysica
, Vol.
70
No.
2
, pp.
777
-
789
.
Pettitt
,
A.N.
(
1979
), “
A non-parametric approach to the change-point problem
”,
Applied Statistics
, Vol.
28
No.
2
.
Qiu
,
H.
,
Hao
,
D.
,
Zeng
,
Y.
,
Zhang
,
X.
and
Chen
,
M.
(
2023
), “
Global and northern-high-latitude net ecosystem production in the 21st century from CMIP6 experiments
”,
Earth System Dynamics
, Vol.
14
No.
1
, pp.
1
-
16
, doi: .
Rauf
,
A.A.
and
Desta
,
G.T.
(
2023
), “
Applicability of multiplicative delta change for bias correcting CMIP6 data in semi-arid Ethiopia
”,
Environmental Research Letters
, Vol.
18
No.
11
, p.
114021
, doi: .
Rettie
,
F.M.
,
Gayler
,
S.
,
Weber
,
T.K.D.
,
Tesfaye
,
K.
and
Streck
,
T.
(
2023
), “
High-resolution CMIP6 climate projections for Ethiopia using the gridded statistical downscaling method
”,
Scientific Data
, Vol.
10
No.
1
, p.
18
, doi: .
Takhellambam
,
B.S.
,
Srivastava
,
P.
,
Lamba
,
J.
,
McGehee
,
R.P.
,
Kumar
,
H.
and
Tian
,
D.
(
2023
), “
Projected mid-century precipitation erosivity under climate change over the southeastern United States
”,
Science of The Total Environment
, Vol.
865
, p.
161119
, doi: .
Tapiador
,
F.J.
,
Navarro
,
A.
,
Moreno
,
R.
,
Sánchez
,
J.L.
and
García-Ortega
,
E.
(
2020
), “
Regional climate models: 30 years of dynamical downscaling
”,
Atmospheric Research
, Vol.
235
.
Tefera
,
G.W.
,
Dile
,
Y.T.
and
Ray
,
R.L.
(
2023
), “
Evaluating the impact of statistical bias correction on climate change signal and extreme indices in the Jemma Sub-Basin of Blue Nile Basin
”,
Sustainability
, Vol.
15
No.
13
, p.
10513
, doi: .
Tekle
,
G.
and
Dagne
,
K.
(
2024
), “
Evaluating bias correction methods for rainfall simulation in the Rift Valley of Ethiopia: the case of distribution mapping
”,
Weather and Climate Extremes
, Vol.
39
, p.
100577
, doi: .
Teklemariam
,
Y.
,
Gebremariam
,
D.
and
Worku
,
M.
(
2023
), “
Bias correction of CMIP6 precipitation extremes using the delta change method over the Ethiopian Rift Valley
”,
Journal of Hydrology: Regional Studies
, Vol.
48
, p.
101375
, doi: .
Tesfaye
,
S.
and
Endeshaw
,
A.
(
2024
), “
Performance of bias correction methods in reproducing daily rainfall extremes under changing climate conditions in Ethiopia
”,
Climate Services
, Vol.
38
, p.
100541
, doi: .
Trzaska
,
S.
and
Schnarr
,
E.A.
(
2023
), “
Review of downscaling methods for climate change projections: African and Latin American resilience to climate change (ARCC)
”,
available at:
Link to Review of downscaling methods for climate change projections: African and Latin American resilience to climate change (ARCC)Link to a PDF of the cited article. (
accessed
29 July 2025).
Tsegaye
,
B.
,
Kebede
,
A.
and
Yilma
,
S.
(
2023
), “
Bias correction of CMIP6 climate model outputs using multiplicative delta change in Upper Awash River Basin
”,
Ethiopia. Hydrology Research
, Vol.
54
No.
8
, pp.
873
-
889
, doi: .
Tsegaye
,
G.
,
Haile
,
A.T.
and
Demissie
,
Y.
(
2025
), “
Power transformation and quantile mapping for bias correction of CMIP6 rainfall in southern Ethiopia
”,
Journal of Hydrology: Regional Studies
, Vol.
50
, p.
101445
, doi: .
Tullu
,
K.T.
and
Tumsa
,
B.C.
(
2024
), “
Evaluating the impacts of climate change on soil loss using the CMIP6 model and RUSLE in the Muger watershed, Ethiopia
”,
Earth Science Informatics
, Vol.
18
No.
1
, p.
99
, doi: .
Wang
,
L.
,
Zhu
,
J.
and
Wang
,
D.
(
2025
), “
Comparative analysis of high-resolution CMIP6 GCM and CMIP5 RCM: unveiling biases and advancements in simulating compound extreme events in China
”,
Climate Dynamics
, Vol.
63
No.
2
, p.
91
, doi: .
Wang
,
Y.
,
Gao
,
X.
and
Zhang
,
H.
(
2024
), “
Progress and challenges in CMIP6 model improvements over CMIP5: a regional perspective
”,
Climate Dynamics
, Vol.
62
Nos
1-2
, pp.
345
-
362
, doi: .
Woldemariam
,
K.
and
Gebeyehu
,
D.
(
2025
), “
Quantile distortions from distribution mapping in CMIP6 rainfall bias correction over the Horn of Africa
”,
Climatic Change
, Vol.
175
No.
1
, p.
17
, doi: .
Addisuu
,
A.A.
,
Tsidu
,
G.M.
and
Basupi
,
L.V.
(
2023
), “
Improving daily CMIP6 precipitation in Southern Africa through bias correction—part 1: spatiotemporal characteristics
”,
Climate
, Vol.
13
No.
5
, p.
95
, doi: .
Brent
,
R.P.
(
1971
), “
An algorithm with guaranteed convergence for finding a zero of a function
”,
The Computer Journal
, Vol.
14
No.
4
, pp.
422
-
425
.
Chen
,
J.
,
Brissette
,
F.P.
and
Caya
,
D.
(
2020
), “
Remaining error sources in bias-corrected climate model outputs
”,
Climatic Change
, Vol.
162
No.
2
, pp.
563
-
582
, doi: .
Dinh
,
T.L.A.
and
Aires
,
F.
(
2022
), “
Revisiting the bias correction of climate models for impact studies
”,
Climatic Change
, Vol.
176
No.
10
, p.
140
, doi: .
Dinku
,
M.B.
and
Gibre
,
A.M.
(
2024
), “
Comparison of bias correction methods to regional climate model simulations for climate change projection in Muger Subbasin, Upper Blue Nile Basin, Ethiopia
”,
Journal of Water and Climate Change
, Vol.
15
No.
6
, pp.
2612
-
2627
, doi: .
Ersado
,
D.L.
and
Awoke
,
A.G.
(
2024
), “
A multi-criteria decision analysis approach for ranking the performance of CMIP6 models in reproducing precipitation patterns over Abaya-Chamo sub-basin, Ethiopia
”,
Heliyon
, Vol.
10
No.
12
, p.
e32442
, doi: .
Ezéchiel
,
O.
,
Eric
,
A.A.
,
Josué
,
Z.E.
, et al., (
2016
), “
Comparative study of seven bias correction methods applied to three regional climate models in Mekrou catchment (Benin, West Africa)
”,
International Journal of Current Engineering and Technology
, Vol.
6
, pp.
1831
-
1840
, available at:Link to Comparative study of seven bias correction methods applied to three regional climate models in Mekrou catchment (Benin, West Africa)Link to the cited article. (
accessed
29 July 2025).
Gebisa
,
B.T.
,
Dibaba
,
W.T.
and
Kabeta
,
A.
(
2023
), “
Evaluation of historical CMIP6 model simulations and future climate change projections in the Baro River Basin
”,
Journal of Water and Climate Change
, Vol.
14
No.
8
, pp.
2680
-
2705
, doi: .
Gidden
,
M.J.
,
Riahi
,
K.
,
Smith
,
S.J.
, et al., (
2019
), “
Global emissions pathways under different socioeconomic scenarios for use in CMIP6: a dataset of harmonized emissions trajectories through the end of the century
”,
Geoscientific Model Development
, Vol.
12
No.
4
, pp.
1443
-
1475
, doi: .
Gomes
,
F.P.
(
1985
),
Curso de Estatística Experimental
,
Nobel
,
São Paulo
.
Iizumi
,
T.
,
Takikawa
,
H.
,
Hirabayashi
,
Y.
et al. (
2017
), “
Contributions of different bias-correction methods and reference meteorological forcing data sets to uncertainty in projected temperature and precipitation extremes
”,
Journal of Geophysical Research: Atmospheres
, Vol.
122
No.
15
, pp.
7800
-
7819
, doi: .
Lee
,
J.-Y.
,
Marotzke
,
J.
,
Bala
,
G.
,
Cao
,
L.
,
Corti
,
S.
,
Dunne
,
J.P.
,
Engelbrecht
,
F.
,
Fischer
,
E.
,
Fyfe
,
J.C.
,
Jones
,
C.
,
Maycock
,
A.
,
Mutemi
,
J.
,
Ndiaye
,
O.
,
Panickal
,
S.
,
Zhou
,
T
(
2021
), “
Future global climate: scenario-based projections and near-term information
”, in:
V.
Masson-Delmotte
,
P.
Zhai
,
A.
Pirani
et al. (Eds)
, Climate Change 2021: The Physical Science Basis. Contribution of Working Group I to the Sixth Assessment Report of the Intergovernmental Panel on Climate Change.
Cambridge University Press
,
Cambridge, UK and New York, NY, USA
, pp.
553
-
672
, doi: .
Lehner
,
F.
,
Nadeem
,
I.
and
Formayer
,
H.
(
2023
), “
Evaluating skills and issues of quantile-based bias adjustment for climate change scenarios
”,
Advances in Statistical Climatology, Meteorology and Oceanography
, Vol.
9
No.
1
, pp.
29
-
44
, doi: .
Lei
,
Y.
,
Peng
,
P.
and
Jiang
,
W.
(
2023
), “
Evaluation of global climate models for the simulation of precipitation and maximum and minimum temperatures at coarser and finer resolutions based on temporal and spatial assessment metrics in mainland China
”,
Journal of Water and Climate Change
, Vol.
14
No.
5
, pp.
1585
-
1599
, doi: .
Mahato
,
S.
,
Behera
,
M.D.
and
Panda
,
S.N.
(
2023
), “
Review of downscaling approaches for climate impact assessment in agriculture and water resources
”,
Theoretical and Applied Climatology
, Vol.
151
Nos
3-4
, pp.
1395
-
1412
, doi: .
Makula
,
E.K.
and
Zhou
,
B.
(
2022
), “
Coupled model intercomparison project phase 6 evaluation and projection of East African precipitation
”,
International Journal of Climatology
, Vol.
42
No.
4
, pp.
2398
-
2412
, doi: .
McGibbon
,
J.
,
Clark
,
S.K.
,
Henn
,
B.
,
Kwa
,
A.
,
Watt‐Meyer
,
O.
,
Perkins
,
W.A.
and
Bretherton
,
C.S.
(
2024
), “
Global precipitation correction across a range of climates using CycleGAN
”,
Geophysical Research Letters
, Vol.
51
No.
4
, p.
e2023GL105131
, doi: .
Mengistu
,
A.G.
,
Tesfuhuney
,
W.A.
,
Woyessa
,
Y.E.
, et al., (
2025
), “
Contrasting hydro-climatic trends and drought dynamics in Ethiopia and South Africa under climate change
”,
Climate Dynamics
, Vol.
63
No.
2
, p.
105
, doi: .
Mmame
,
B.
and
Ngongondo
,
C.
(
2024
), “
Evaluation of CMIP6 model skills in simulating tropical climate extremes over Malawi, Southern Africa
”,
Modeling Earth Systems and Environment
, Vol.
10
No.
2
, pp.
1695
-
1709
, doi: .
Moore
,
K.
,
Pierson
,
D.
,
Pettersson
,
K.
,
Schneiderman
,
E.
and
Samuelsson
,
P.
(
2008
), “
Effects of warmer world scenarios on hydrologic inputs to Lake Mälaren, Sweden and implications for nutrient loads
”,
Hydrobiologia
, Vol.
599
No.
1
, pp.
191
-
199
, doi: .
O’Neill
,
B.C.
,
Kriegler
,
E.
and
Ebi
,
K.L.
(
2017
), “
The roads ahead: narratives for shared socioeconomic pathways describing world futures in the 21st century
”,
Global Environmental Change
, Vol.
42
, pp.
169
-
180
, doi: .
Panjwani
,
S.
,
Naresh
,
K.S.
and
Ahuja
,
L.
(
2020
), “
Simulation performance of selected global and regional climate models for temperature and precipitation in some locations in India
”,
Journal of Agrometeorology
, Vol.
22
, pp.
407
-
418
.
R-Instat
(
2023
), “
Download R-Instat
”,
available at:
Link to Download R-Instathttps://r-instat.org/Download.html. (
accessed
29 July 2025).
Sennikovs
,
J.
and
Bethers
,
U.
(
2023
), “
Statistical downscaling method of regional climate model results for hydrological modelling
”,
available at:
Link to Statistical downscaling method of regional climate model results for hydrological modellingLink to the cited article. (
accessed
29 July 2025).
Singh
,
V.
,
Kumar
,
R.
and
Ojha
,
C.S.P.
(
2023
), “
Hybrid bias correction methods for improving CMIP6 precipitation projections for hydrological modeling
”,
Hydrological Sciences Journal
, Vol.
68
No.
2
, pp.
223
-
239
, doi: .
SWAT Team
(
2022
), “
Bias correction manual for CMhyd
”,
Texas A&M University
,
available at:
Link to Bias correction manual for CMhydLink to a PDF of the cited article. (
accessed
29 July 2025).
Teutschbein
,
C.
and
Seibert
,
J.
(
2012
), “
Bias correction of regional climate model simulations for hydrological climate-change impact studies: review and evaluation of different methods
”,
Journal of Hydrology
, Vols
456-457
, pp.
12
-
29
, doi: .
Tiku
,
T.W.
,
Tarekegn
,
G.B.
,
Sahlu
,
D.
,
Teshebo
,
G.B.
,
Enyew
,
F.B.
,
Umer
,
Y.
and
Debele
,
S.E.
(
2025
), “
Evaluating CMIP6 precipitation simulations across different rainfall regimes in the Amhara Region, Ethiopia
”,
Natural Hazards Research, 2025
, Vol.
5
No.
3
, doi: .
Tong
,
Y.
,
Gao
,
X.
,
Han
,
Z.
, et al., (
2021
), “
Bias correction of temperature and precipitation over China for RCM simulations using the QM and QDM methods
”,
Climate Dynamics
, Vol.
57
Nos
5-6
, pp.
1425
-
1443
, doi: .
Tschöke
,
G.V.
,
Kruk
,
N.S.
,
de Queiroz
,
P.I.B.
, et al., (
2017
), “
Comparison of two bias correction methods for precipitation simulated with a regional climate model
”,
Theoretical and Applied Climatology
, Vol.
127
Nos
3-4
, pp.
841
-
852
, doi: .
Yang
,
W.
,
Seager
,
R.
,
Cane
,
M.A.
, et al., (
2015
), “
The rainfall annual cycle bias over East Africa in CMIP5 coupled climate models
”,
Journal of Climate
, Vol.
28
No.
24
, pp.
9789
-
9802
.
Zebaze
,
S.
,
Jain
,
S.
,
Salunke
,
P.
, et al., (
2019
), “
Assessment of CMIP5 multi-model mean for the historical climate of Africa
”,
Atmospheric Science Letters
, Vol.
20
No.
8
, p.
e926
.

Languages

or Create an Account

Close Modal
Close Modal