


Although the importance of climate change is generally acknowledged, its impacts are often not taken into account explicitly when planning development projects. This being due to limited resources, among others, this paper aims to propose a simple and low-cost approach to assess the viability of human activities under climate change.
Many human activities are feasible only within a narrow range of climatic conditions. Comparing such “climate corridors” with future climate projections provides an intuitive yet quantitative means for assessing needs for, and the viability of, adaptation activities under climate change.
The approach was tested within development projects in Pakistan, Peru and Tajikistan. The approach was shown to work well for forestry and agriculture, indicating positive/negative prospects for wheat in two districts in Pakistan, temperature constraints for maize in Peru and widening elevation ranges for walnut trees in Tajikistan.
Climate corridor analyses feed into the preparation of Local Adaptation Plans of Action in Pakistan.
The simplicity and robustness of climate corridor analysis allow for efficient analysis and communication of climate change impacts. It works when data availability is limited, but it can as well accommodate a wide range of complexities. It has proven to be an effective vehicle for mainstreaming climate change into adaptation planning.
1. Introduction
Climate change is an essential dimension of many development projects in most low-income countries. This holds for projects not only targeting climate change directly but also when addressing issues with a strong link to climate, such as water resource management, migration and conflicts. Especially for development projects aiming at improving rural livelihoods, climate change can be an important factor for mid- or long-term planning. Unfortunately, addressing the dimension of climate change appropriately in development projects is challenging.
The reasons are various, including a mismatch between the time scale of human perception and the one of climate change, or the need to tackle targets such as health, poverty, violent conflicts and environmental degradation with higher priority (Goklany, 2012), although many of these targets are often exacerbated by climate change (Leichenko and Silva, 2014). Scientific studies investigated appropriate ways for informing climate change adaptation (Wilby et al., 2009), but a common understanding between scientists and stakeholders remains difficult to create (Wilby and Dessai, 2010; Salzmann et al., 2013). For example, the frequent top-down avenue from global climate models (GCMs) to regional projections to impact models often fails to produce usable guidance, as uncertainty potentially increases with each step of the modelling chain (Flato et al., 2013).
Furthermore, resources of development projects are often not enough to perform such climate change impact simulations or even to analyse data that are publicly available (e.g. from the AgMIP and ISI-MIP projects, Rosenzweig et al., 2014; Warszawski et al., 2014). As a rule, assessments have to be produced quickly and results communicated in an intuitive way.
With this in mind, we propose a simple approach which shifts the perspective from comprehensive impact modelling to the specific climate conditions that many human activities require. A typical example is crop cultivation, which needs temperature, radiation and precipitation being within crop-specific ranges. These ranges, termed here for short as “climate corridors”, are compared with present-day climate conditions and future climate projections to assess the activities’ viability under climate change. Climate corridor analysis is thus the simple-most form of “climate suitability analysis”.
In ecology, climate suitability has been addressed with different methods, including species distribution models (SDMs) such as maximum entropy approaches (Phillips et al., 2006), generalised additive models (Hastie and Tibshirani, 1990) and different machine learning methods (Ranjitkar et al., 2016). Mechanistic crop models (Ewert et al., 2015) have also been used (Estes et al., 2013), although their purpose often exceeds the needs and possibilities of development projects.
Several Web portals provide suitability and other agronomic information with a strong orientation towards users and stakeholders; however, the information is often limited to few standard crops. An example is the Global Agro-Ecological Zones (GAEZ; FAO/IIASA, 2012) portal hosted by the UN Food and Agricultural Organisation (FAO).
Providing a much simpler assessment of climate suitability, the Ecocrop model (Ramirez-Villegas et al., 2013) condenses a crop’s climate corridors regarding temperature and precipitation together with average local temperature and precipitation conditions into a single indicator of climate suitability. The practical advantage of this approach is that the user can work with a single indicator; however, she has no immediate access to the underlying assumptions.
Climate corridor analysis presents a “poor man’s approach” to climate suitability analysis, which deliberately makes use of strong simplifications to allow for applications with little data availability. Conceptually simple, climate corridor analysis specifically targets the cross-sectoral stakeholder dialogue. Note that the term “climate corridor” here refers to climatic conditions rather than to a landscape corridor, an ecological concept at the basis of species migration studies (Nun˜ez et al., 2013).
The purpose of this work is to demonstrate the potential of climate corridor analysis for discussing risks and opportunities from climate change in development projects, with the help of three case studies (Figure 1). These studies rely on very different sources of information regarding climate corridors, present-day climate and future climate projections (Section 2).
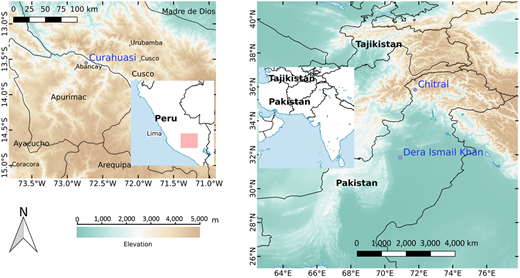
Maps of the case study locations. Spatial data from naturalearthdata.com (access December 2016), elevation data from WorldClim (Section 2.1)
Maps of the case study locations. Spatial data from naturalearthdata.com (access December 2016), elevation data from WorldClim (Section 2.1)
The first case study (Section 3) originates from the Livelihoods Programme Hindukush (HELVETAS Swiss Intercooperation, 2016a), which aims at improving rural livelihoods in the north of Pakistan. One specific goal of this programme is to establish climate change adaptation plans at the district level. Climate corridor analysis was first introduced and field-tested in this project and has since been taken up to investigate future climate suitability of key crops in that region.
Two additional case studies explore extensions of climate corridor analysis, rooted in development projects in the Central Andes of Peru (on food security and water resources, Section 4) and Western Tajikistan (on re-forestation, Section 5).
2. Data and tools
According to the aim of the climate corridor approach, the case studies rely to the largest possible extent on public and easily usable data. Where available, local information has been used to refine the analysis.
2.1 Data
2.1.1 Ecocrop.
The Ecocrop database, hosted by FAO, provides crop requirements with regard to soil and climate (FAO, 2007). Generally, the interplay between climate and crop growth is complex (Boote et al., 1994). Circumventing such detailed consideration, the Ecocrop database describes climate conditions and soil characteristics under which, on average, these complex requirements are satisfied. It provides corridors for annual precipitation and the range of monthly temperatures during the growing season. Corridors are provided for the optimum and for the absolute conditions (the range outside of which the crop cannot survive). Case studies have shown good spatial agreement between the observed occurrence of crops and their spatial suitability patterns according to the Ecocrop corridors (Ramirez-Villegas et al., 2013).
2.1.2 Station data.
For the Pakistan case study, multi-year monthly average temperatures from two weather stations at the cities of Chitral and Dera Ismail Khan from the GHCN-Monthly data set (version 3, Lawrimore et al., 2011) are used. The station data are, e.g., available at climexp.knmi.nl (last accessed date December 2016). For the Peru case study, multi-year monthly average, minimum and maximum temperatures and precipitation from a weather station operated by the Peruvian weather service SENAMHI near the village of Curahuasi, Apurímac are used (Schwarb et al., 2011). See Figure 1 for the station locations.
2.1.3 United Nations’ Development Programme country climate profiles.
For quick analyses, the country climate profiles produced under the United Nations’ Development Programme (UNDP; McSweeney et al., 2010) provide present-day climate averages and recent trends together with future climate changes according to projections by 15 GCMs used in the 4th Assessment Report by the Intergovernmental Panel on Climate Change (IPCC; Meehl et al., 2007) under different greenhouse gas (GHG) emission scenarios (Nakicenovic and Swart, 2001). While these data are conveniently pre-processed and provide a temporal resolution of three months, these come aggregated at the country scale and rely on the second-last generation of GCMs and GHG emission scenarios only.
2.1.4 WorldClim.
If spatial details matter, the multi-year monthly average grids from the WorldClim project (Hijmans et al., 2005) are a frequent choice. Interpolating monthly climatologies of the 1950-2000 period from a vast network of weather stations, these grids provide a spatial resolution of approximately 1 km. Bias-corrected future projections by 17 GCMS used in the most recent (fifth) Assessment Report by the IPCC (Taylor et al., 2012) of similar monthly climatologies are provided for different GHG concentration scenarios (Moss et al., 2010) and two time slices in the twenty-first century (2041-2060 and 2061-2080).
2.2 Tools
2.2.1 CropWat.
FAO promotes a series of models for crop management, including for irrigation planning and yield calculation. In the Peru case study (Section 4), the CropWat model (Allen et al., 1998) was used to compute the water demand of crops for optimal growth under given climate conditions. For this study, CropWat was run by using the Hargreaves–Samani approximation to reference evapotranspiration, which was then translated to actual crop evapotranspiration using scaling factors depending on the crop’s developmental stages.
2.2.2 CO2 effect.
C4 plants such as maize have developed more efficient photosynthesis processes compared to the more common C3 plants, minimising evaporative losses and optimising CO2 uptake (Hatch, 2002). Furthermore, elevated CO2 concentrations increase the water use efficiency of plants, (possibly) compensating for the increased water losses owing to higher temperatures and evaporative demand in the future. For the time horizon considered in the case study from Peru (end of twenty-first century) and the corresponding projected CO2 concentrations, Kruijt et al. (2008) quantify the increased water use efficiency of C4 plants to range between 0 and 20 per cent, with an average of 10 per cent, which is further adopted for our discussion.
2.2.3 Statistical downscaling.
GCMs are often unable to provide reliable precipitation projections for high mountain regions. Reasons are the (still relatively) coarse spatial resolution of the models and the need to parameterise processes occurring at sub-grid scales, along with limited process understanding and lack of observations for validation. To overcome this deficit in the case study from Peru, a statistical downscaling following Neukom et al. (2015) is applied, based on a robust negative correlation between local precipitation and upper tropospheric westerlies, the latter being simulated in a more reliable way by GCMs (Garreaud et al., 2003; Minvielle and Garreaud, 2011). In a first step, linear regression models for the relation between upper tropospheric westerlies (from the ERA-40 reanalysis, Uppala et al., 2005) and local precipitation (Curahuasi, see above) are derived separately for each seasons. Second, the models are used to predict future changes in seasonal precipitation from corresponding changes in the westerlies as projected by the GCMs (Neukom et al., 2015, for a description of these projections).
3. Wheat in Pakistan
For more than a decade, the Livelihoods Programme Hindukush in Pakistan (HELVETAS Swiss Intercooperation, 2016a) contributed towards improving livelihood strategies of rural households and reducing their region’s vulnerabilities to disasters and climate change in north-western Pakistan. In 2012, the programme began concerted efforts to make climate assessments and identify adaptation strategies in the fields of disasters, agriculture and water. In 2014, first steps were taken to improve institutional capacities for adaptation planning at the district level (so-called Local Adaptation Plans of Action, LAPAs) in Chitral, a high mountain district in the north, and the Dera Ismail Khan district in the central Indus plains (Figure 1). Adaptation planning in Chitral was further advanced in 2015 and finally concluded in 2016.
When conducting, in October 2014, an initial capacity-building workshop targeted at stakeholders from local non-governmental organisations (NGOs), government and administration, participants were provided with general information about emission scenarios and associated global climate changes. This information was important to understand the relationship between mitigation efforts and needs for adaptation at the national scale, but was considered insufficient to discuss adaptation challenges at the district level.
To overcome this problem, the perspective was shifted from climate to wheat cultivation, the most important crop in Chitral and Dera Ismail Khan, and also a commodity at the national level (Yu et al., 2013). Temperature corridors of wheat, obtained from Ecocrop, were then compared to present-day conditions and different future climate change scenarios.
Figure 2 displays the Ecocrop temperature corridors of wheat (green for optimum, orange for absolute; Section 2.1) together with observed present-day and projected future temperatures, computed by adding future temperature changes from the UNDP profiles to the observed temperatures (Section 2.1). The panels display temperatures of the coldest and warmest months during the growing seasons (October to May in Chitral, October to April in Dera Ismail Khan) under two climate change scenarios, the A2 scenario of strong climate change [Figure 2(a)] and the B1 scenario of weaker climate change [Figure 2(b)].
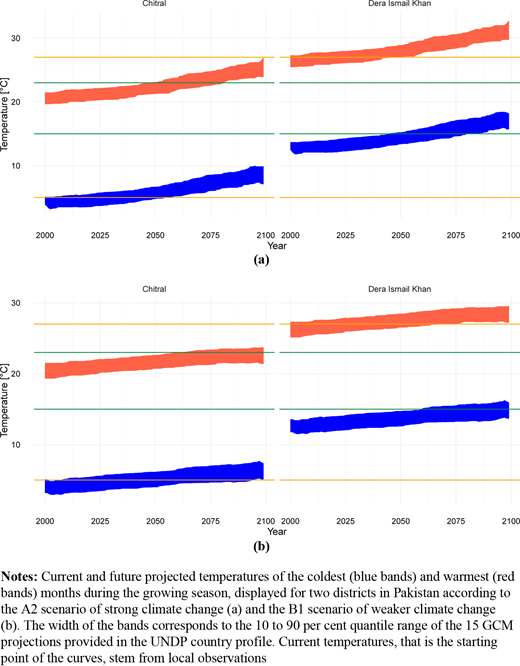
Temperature corridors for wheat cultivation from FAO’s Ecocrop database (horizontal green lines: optimal corridor, orange lines: absolute corridor)
Temperature corridors for wheat cultivation from FAO’s Ecocrop database (horizontal green lines: optimal corridor, orange lines: absolute corridor)
As seen in Figure 2(a), the coldest months in Chitral are barely within the absolute corridor during the first half of the twenty-first century, and only in the second half both coldest and warmest months are within the absolute corridor. This indicates non-optimum and maybe even critical conditions today and for the coming decades, a result which is consistent with the fact that today wheat in Chitral (above 1,500 m a.s.l.) does not reach maturity and is produced for fodder mainly (Hussain et al., 2013). Conditions are projected to improve after about 2050.
In Dera Ismail Khan, on the other hand, conditions are acceptable today, but less so starting from about 2025 when the warmest month is projected to leave the absolute corridor. This suggests that without adaptation, wheat cultivation will become difficult to sustain during the second half of the twenty-first century, in spite of a shortening of the growing season and a resulting opportunity to harvest before the highest temperatures are reached.
When considering the B1 scenario [Figure 2(b)], the same trends are observed, but the impacts of climate change are delayed. The corresponding analysis for precipitation under both scenarios reveals that precipitation in both districts is just above the absolute requirements, a situation which is projected to persist in future (not shown).
The general results of improving (deteriorating) conditions for wheat cultivation in Chitral (Dera Ismail Khan) are in line with the conclusions of Sultana et al. (2009) and Iqbal et al. (2009), based on a mechanistic crop model, as well as with the findings from an empirical econometric analysis by Hussain and Mudasser (2007).
Note that the width of the temperature bands (of approximately 2°C) contains a measure of the uncertainty from the different GCMs. This rather moderate uncertainty translates into several decades of uncertainty about the exact moment when a corridor is actually left.
The discussion of these climate corridor analyses provided the participants of the workshop with a better understanding of the consequences of climate change for a key agricultural product in their two districts, and the need to prepare adaptation measures. Specifically, climate corridor analyses helped to better appreciate:
that even if expected changes in climatic conditions are nearly equal in the two districts, the potential impacts on wheat production are different;
that the impacts on wheat production vary according to the assumed climate scenario, thus local climate impacts are directly related to international efforts of mitigating climate change; and
that adaptation is best planned at the district level.
The experience of tangible climate change that the climate corridor analysis had offered to the participants led to inclusion of these analyses into the process of preparing the respective adaptation plans. A follow-up four-weeks training for key persons from the Pakistan program’s context enabled them to perform similar analyses for a wider range of crops and locations throughout the districts. The Chitral adaptation plan now includes eight crops (Ali et al., 2016), and specific recommendations for climate change adaptation such as introducing short-duration wheat varieties and two-crop systems.
The evident utility of climate corridor analysis for investigating and communicating local climate change impacts, including for non-expert stakeholders, motivated the exploration of further potentials of this approach in the following two sections.
4. Maize in Peru
The Climate Change Adaptation Programme in Peru (PACC, 2008 to 2016) was a Peruvian-Swiss collaboration with a geographical focus in the regions of Apurímac and Cusco. The aim was to identify and implement appropriate adaptation activities with regard to water resources and food security (HELVETAS Swiss Intercooperation, 2016b). The analysis of climate corridors for typical crops grown in these regions was therefore an evident task, especially as one of the partners (SENAMHI, 2012) had already compiled climate corridors for the crop varieties cultivated in the study area.
Given the availability of information and weather data dating back to 1964, maize cultivation in Curahuasi (Apurímac, 2,740 m a.s.l.; Figure 1) was selected for this case study. As for wheat cultivation in Pakistan, future projections of temperature were compared to temperature corridors of absolute and optimal growth conditions. Additionally, the crop’s water demand and the corresponding supply from precipitation were investigated. Note that water demand itself depends on not only climate but also CO2 concentrations (Boote et al., 1994). As the latter are projected to increase, the climate corridor defining water demand will no longer be constant, even under the unrealistic assumption of no change in temperature.
The water demand of maize during the growing season (October to April) under present-day and future climate conditions was estimated by CropWat, a simple crop model promoted by the FAO (Allen et al., 1998, and Section 2.2). Typical sowing and harvest dates together with observed phenological phases of the crop were prescribed using local information (SENAMHI, 2012; MINAGRI, 2015). Monthly output from CropWat was aggregated to the growing season (October to April).
Figure 3 shows the evolution of water demand from present-day (station data) to 2061-2080 (RCP8.5 scenario of strong climate change from WorldClim, Hijmans et al., 2005). As seen in this figure, the estimated present-day water demand lies within the optimum corridor of annual precipitation, confirming the consistency of the CropWat simulations with the local crop requirements (95 per cent of the annual precipitation occurs during the growing season in this case, so that even the comparison of the water demand during the growing season with precipitation of the entire year is justified). The dark-green box for the future period indicates an average increase of some 10 per cent compared to the present-day water demand, owing to elevated evapotranspiration following the temperature increase (Figure 4).
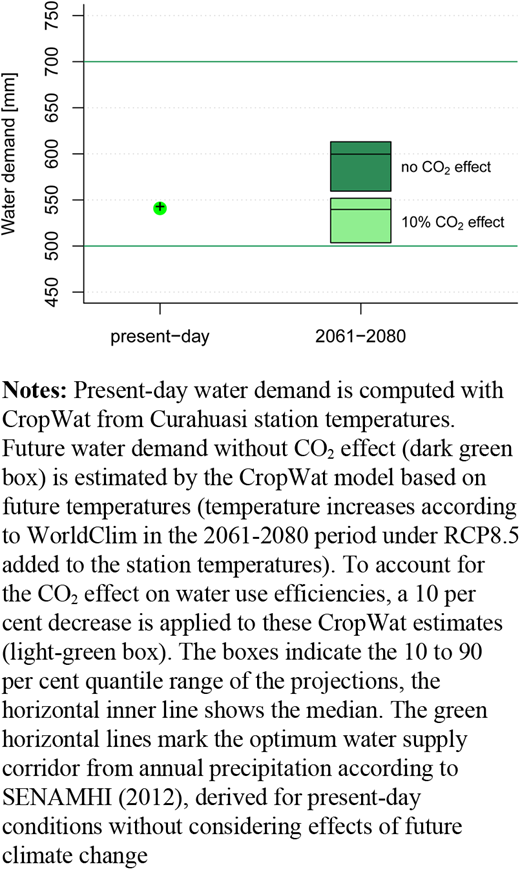
Present-day and future water demand during the growing season of maize in Curahuasi (October to April)
Present-day and future water demand during the growing season of maize in Curahuasi (October to April)
Accounting for an increase of 10 per cent in water use efficiency of the crop due to elevated CO2 concentrations (Kruijt et al., 2008, and Section 2.2) leads to a compensation for the increase in evaporative demand, which is evident from the light-green box of Figure 3. Such cancelation has also been found in modelling studies on the twentieth century (Gerten et al., 2008; Peng et al., 2013). The associated range of the future projections provides an uncertainty measure of the future climate corridor for optimal water supply from precipitation.
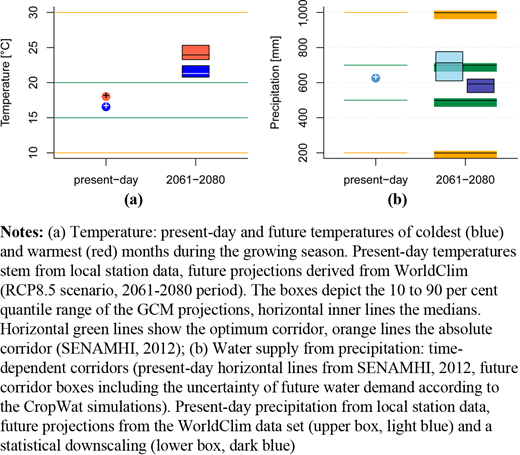
Putting it all together, the left panel of Figure 4 shows the climate corridors of temperature (SENAMHI, 2012) together with present-day temperatures of the warmest and coldest months and the respective 2061 to 2080 projections from WorldClim. Present-day temperatures are completely within the optimum corridor (green lines), highlighting the consistency between local agricultural practice and these corridors. For the end of the century, temperatures will still be well within the absolute temperature corridor (orange lines), but are projected to leave the optimum corridor.
The right panel of Figure 4 presents the corresponding analysis of water supply from precipitation. The optimum supply corridor (green) slightly widens up until the end of the century owing to the uncertainty of the future water demand presented in Figure 3. Note that present-day precipitation is well within the present-day optimum water supply corridor.
Many studies have stressed the large uncertainty of future precipitation scenarios as projected by current GCMs. Therefore, precipitation projections from two sources are compared in this figure. The upper light-blue box indicates the range of interpolated and bias-corrected GCM projections from the WorldClim data set. According to these GCM projections, precipitation increases. The lower dark-blue box displays precipitation projections from a statistical downscaling of the Western winds in the high atmosphere over the region (following Neukom et al., 2015, see Section 2.2). According to these downscaled projections, precipitation decreases. Although these two sources highlight precipitation trends of opposite signs, changes are overall small. While about half of the WorldClim projections leave the optimum corridor (although remaining within the absolute corridor), the entire ensemble of the downscaled projections remains within the optimum corridor.
Based on this analysis, and neglecting for the moment the risk of seasonal water scarcity, there is thus no evidence of a problematic water scarcity for the cultivation of maize in the Curahuasi region. However, temperature is projected to clearly leave the optimum corridor, pointing to less ideal conditions for the future.
This example demonstrates possible extensions of the simpler analysis presented in the case from Pakistan (Section 3), accounting, for example, for the time dependence of the water demand corridor owing to a changing evaporative demand of the atmosphere and changing CO2 concentrations. Furthermore, it shows how different sources of climate change projections can be incorporated to account for uncertainties and knowledge gaps. Integrating data from diverse sources into climate corridor analyses is thus straight-forward.
5. Walnut trees in Tajikistan
In Tajikistan, a project on sustainable forestry and climate change adaptation (running 2015 to 2018, CARITAS, 2016), aims at counteracting the overuse of forests in recent decades which resulted from a declined supply of coal and other heating materials after the collapse of the Soviet Union. The project supports the Forestry Agency in planning and implementing reforestation activities and forest rehabilitation. Walnut (Juglans regia), a native species which provides economic and cultural value, is ecologically and economically important for these activities in Western Tajikistan, despite climatic conditions, which are not ideal. Especially late frosts are critical (Gauthier and Jacobs, 2011). To assess the potential role of walnut trees within the national reforestation strategy, the project needed to assess climate change impacts on these trees.
Tajikistan is characterised by a high plateau in the east and descending altitudes to the west, dispersed with steep topographical gradients in the Pamirs mountain range and its foothills (Figures 1 and 5). The topography induces strong climatic gradients, and knowledge of these gradients is key for planning adaptation. In particular, the project was interested in obtaining specific elevation ranges in Western Tajikistan, in which reforestation of walnut trees is possible.
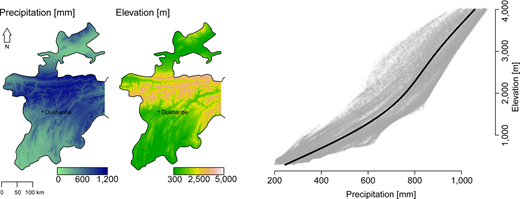
Maps of average annual precipitation (left) and elevation (middle) of Western Tajikistan from the WorldClim data set and their scatter plot, generalised by a smooth spline fit (right)
Maps of average annual precipitation (left) and elevation (middle) of Western Tajikistan from the WorldClim data set and their scatter plot, generalised by a smooth spline fit (right)
Figure 5 shows maps of Western Tajikistan current precipitation and elevation from WorldClim and their scatter plot. A monotonic relation of increasing precipitation with increasing elevation is apparent, which is generalised by a smooth spline fit. The relation between temperature and elevation is of the opposite sign (decreasing temperatures with increasing elevation, see below).
The precipitation – elevation relation leads to a lower bound of elevation, above which precipitation is enough to sustain walnut trees. The temperature–elevation relation leads to an upper bound of elevation, below which temperatures are high enough to sustain production during the coldest month of the growing season (April to October). The Ecocrop optimum climate corridors indicate temperatures of at least 15°C during the growing season and at least 800 mm of annual precipitation. It turns out that nowhere in Tajikistan these optimum conditions are given. The following analysis is therefore limited to the lower boundaries of the absolute corridors of 7°C and 400 mm, respectively.
These bounds are displayed in the two top panels of Figure 6 as vertical lines. The left panel reproduces the elevation – precipitation spline of Figure 5 together with the corresponding elevation–temperature spline. They cross the respective absolute climate corridor bounds at approximately 800 and 2,100 m, respectively. This elevation range corresponds well with ranges from literature. Akhmadov (2008) report ranges of 1,000 to 2,300 m, and Makhmadaliev and Novikov (2002) highlight ranges of 1,000 to 2,000 m.
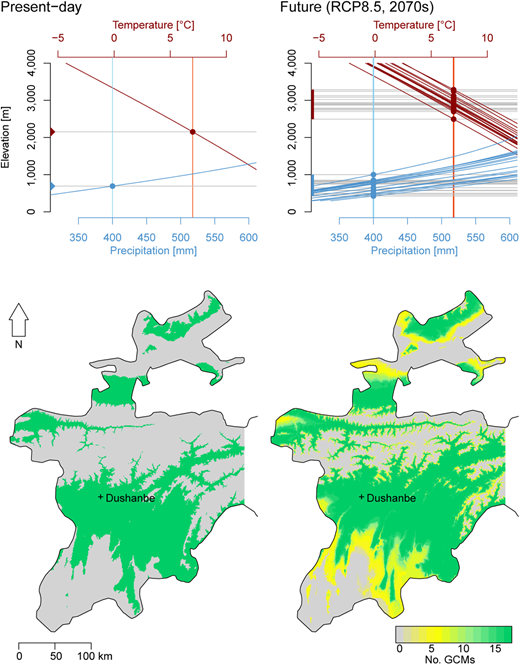
Top: Bounds of the absolute corridors of temperature (coldest month of the growing season) and annual precipitation for growing walnut trees in Western Tajikistan (vertical lines), temperature and precipitation relations to elevation (red and blue splines, respectively) and the corresponding elevation range (marked on the vertical axis). Left for present-day, right for 17 GCM projections of the 2061-2080 conditions (WorldClim, RCP8.5 scenario of strong climate change). Bottom: maps indicate where the temperature and precipitation requirements according to the absolute climate corridors are met (left for present-day, right for the future conditions; colours indicate the number of GCMs)
Top: Bounds of the absolute corridors of temperature (coldest month of the growing season) and annual precipitation for growing walnut trees in Western Tajikistan (vertical lines), temperature and precipitation relations to elevation (red and blue splines, respectively) and the corresponding elevation range (marked on the vertical axis). Left for present-day, right for 17 GCM projections of the 2061-2080 conditions (WorldClim, RCP8.5 scenario of strong climate change). Bottom: maps indicate where the temperature and precipitation requirements according to the absolute climate corridors are met (left for present-day, right for the future conditions; colours indicate the number of GCMs)
The right panel of Figure 6 shows the corresponding analyses of future climates (WorldClim, 2061-2080, RCP8.5). The lower elevation bound from future precipitation ranges between 500 and 1,000 m, indicating only little change in average for the future. Temperature rise, on the other hand, pushes the maximum elevation below which the required 7°C are given up to 2,500 to 3,300 m. The elevation band which under future climate conditions is suitable for cultivating walnut trees widens significantly.
The maps below show where these precipitation and temperature requirements from the absolute climate corridors are fulfilled under present-day and future conditions, which holds for substantial fractions of Western Tajikistan. However, currently, only some 3 per cent of the entire country are covered by forest (FAO, 2015) and the fraction of walnut forests is almost negligible (Makhmadaliev and Novikov, 2002), suggesting possibilities for reforestation already in the near future. The widening of the future elevation range is reflected in the future map (right), which shows the number of GCMs, which at a given pixel, indicate suitable conditions for the 2061 to 2080 period. The suitable area extends mainly into higher elevations. Results of climate corridor analysis indicate a 40 per cent increase in suitable areas for walnut, disclosing a wide range of opportunities for adaptation.
6. Discussion
Climate corridor analysis was conceived in response to the need for a simple but robust approach to climate change impacts assessment in the context of development and cooperation. Implementing climate corridor analysis in practice involves finding appropriate “climate corridors” for each of the considered activities and assessing whether these constraints are met by (observed) present and (projected) future climatic conditions. Climate corridor analysis is not tied to a particular set of tools or data, and is extendable to applications outside agriculture and forestry (see below).
In this article, climate corridor analysis was first discussed in relation to adaptation planning within a development project in north-western Pakistan (introduced as Local Adaptation Plan of Actions, LAPAs). The simplicity of displays like in Figure 2, assessing prospects of wheat cultivation under climate change, made these results tangible to the involved stakeholders from diverse sectors. A subsequent four-weeks training enabled partners from Pakistan to perform these analyses independently, and their analyses now inform policymakers about the local impacts of climate change on key crops.
Encouraged by the smooth adoption of the approach in Pakistan, possible extensions were explored in the contexts of two other development projects. The analysis on maize cultivation in Peru introduced time-dependent climate corridors, where time dependency resulted from the crop’s changing water demand under future climate and CO2 concentrations. The example from Tajikistan added the spatial dimension to the analyses, which allowed for translating climate corridors into suitable elevation ranges in Western Tajikistan for walnut tree afforestation under present-day and future climate conditions.
The purpose of these additional case studies was to highlight the versatility and flexibility of the approach. The Peru case showed that, if additional information is available, their integration into the analysis is straightforward and can increase the accuracy of the analysis substantially. Note that online portals such as the Global Agro-Ecological Zones (GAEZ) by the FAO allow only to consider standard settings (e.g. standard crop climatic requirements). Impacts assessed with such tools may differ considerably from results of specific applications of climate corridor analysis. In our case, e.g. maize suitability in Curahuasi according to GAEZ was very marginal, in contradiction to the fact that 42 per cent of the total agricultural area in the Curahuasi district is cultivated with maize (SENAMHI, 2012). Likewise, accounting for the time dependency of the crop’s water demand or considering different ensembles of future climate projections is conceptually simple. The same analysis also made it clear that for this particular location and crop, future temperature is projected to be more limiting than future precipitation, a differentiation which would not have been possible for a Ecocrop-type suitability index (Ramirez-Villegas et al., 2013).
The example from Tajikistan illustrated how spatial climate data can be used to derive dependencies between temperature or precipitation with elevation, and to combine these dependencies with climate corridors to identify suitable elevation ranges.
The case studies revealed both challenges and opportunities from climate change. High elevation regions like Chitral (Pakistan) or the higher parts of Western Tajikistan may benefit from less cold temperatures. On the other hand, future prospects of maize in Curahuasi (Peru) are less ideal than today, and wheat in Dera Ismail Khan (Pakistan) will become difficult to sustain at all.
Sources of future climate scenarios differed between the three case studies. The Pakistan case relied on ready-to-use country-averaged time series of climate change provided in the UNDP country climate change profiles (McSweeney et al., 2010), which are particularly easy to use but lack spatial detail and rely on the second-last generation of GCMs and future GHG emissions scenarios. The scenarios from WorldClim applied in the exploratory examples from Peru and Tajikistan bring a much higher spatial resolution and derive from the most recent GCMs and GHG concentrations scenarios, but provide a few time slices of present-day and future conditions only. Potentially, complete time series of these most recent projections are available for downscaling, but the entailed effort is significant. While each source of future climate projections has its strengths and weaknesses, climate corridor analysis can deal with all of them. The ultimate choice will depend on the purpose of the analysis, but as well on computing resources and technical capacity.
Analyses for the future of all three cases were based on large ensembles of GCMs, allowing to account for the corresponding uncertainties. This is often not feasible in more complex impact modelling studies, which consider typically one to five GCMs in their modelling chain. Referring to above, the GAEZ portal provides future suitabilities for four GCMs and a limited set of GHG emissions scenarios only, and the ISI-MIP project mentioned in the introduction investigated only five GCMs.
As seen in the case studies, the climate corridor analysis relies on sometimes strong simplifications and therefore cannot account in detail for all relevant aspects of the investigated activities. The climate corridors from the Ecocrop database, for example, neglect potentially vital effects of short-term temperature extremes and changing seasonalities, which especially for precipitation are of vital relevance. Crops may adapt to rising temperatures with shorter growing seasons, thereby avoiding the high temperatures, but potentially reducing yields. As in other impact evaluations, data quality and availability can become limiting, in particular when investigating climate corridors which refer to weather extremes. The potential for success of an activity is further determined by additional factors such as soil properties and quality, accessibility, social acceptance, economic feasibility, to name just a few.
However, despite such simplifications, all three case studies have produced robust results and show that the approach can deliver relevant and understandable information to non-expert stakeholders.
7. Conclusions
Looking for future extensions, the climate corridor analysis can be applied to sectors other than agriculture or forestry. A hydro-power plant, for example, has a corridor for river discharge, which defines the range from minimum discharge for efficient production to a discharge which begins overcharging the installation. Drenkhan et al. (2015), for instance, report from the Vilcanota River Basin in the Andes of Peru, where current hydropower installations do not produce at full capacity during the dry season, a situation which is expected to aggravate when projected reductions of glacier storage will further reduce the discharge of the dry season.
Climate corridor analysis can further contribute to assess “adaptation pathways” (Haasnoot et al., 2013), an analysis scheme which has been successfully applied to prioritise a set of possible adaptation actions, based on different storylines about external constraints.
The link between climate projections and the constraints of a specific envisaged activity is often overlooked or not addressed with the necessary rigour in development cooperation. Producing transparent results which are straightforward to interpret, climate corridor analysis provides an intuitive yet quantitative way of assessing this link. Integration of local information, apart from increasing the accuracy of the analysis, additionally creates opportunities for local stakeholder involvement and capacity building. Further developing and promoting climate corridor analysis therefore offers both an improved mainstreaming of knowledge from climate science into strategic adaptation planning, and a vehicle for knowledge transfer and ownership.
BO, CH, NS, PC, MR acknowledge financial support by the Swiss Agency for Development and Cooperation (SDC) through the Climate Change Adaptation Programme (PACC) in Peru. RN is supported by the Swiss NSF grant PZ00P2 154802. The Livelihoods Programme Hindukush is implemented by HELVETAS Swiss Intercooperation and Intercooperation Pakistan with funding from SDC. The reforestation project in Tajikistan is funded by the German Ministry for Economic Cooperation and Development (BMZ) through KfW Development Bank and executed by the Forestry Agency under the Government of Tajikistan with the assistance of a consortium led by CARITAS Switzerland.

