


As the contradiction between economic development, resource and environment has become increasingly prominent, low-carbon competitiveness has received worldwide focus. This study aims to examine low-carbon competitiveness in 31 provinces (cities and regions) of China.
An evaluation index system for low-carbon competitiveness in China has been constructed, which is composed of 25 economic, social, environmental and policy indicators. To study the state of low-carbon competitiveness and resistance to China’ development of low-carbon competitiveness, this study uses a combination of the catastrophe progression model, the spatial autocorrelation model and the barrier method.
China’ low-carbon competitiveness gradually decreases from coastal to inland areas: the Tibet and Ningxia Hui autonomous regions are the least competitive regions, while the Shandong and Jiangsu provinces are the most competitive areas. The spatial correlation of the 31 provinces’ low-carbon competitiveness is very low and lacks regional cooperation. This study finds that the proportion of a region’ wetland area, the proportion of tertiary industries represented in its GDP and afforestation areas are the main factors in the development of low-carbon competitiveness. China should become the leader of carbon competitiveness by playing the leading role in the Eastern Region, optimizing the industrial structure, improving government supervision and strengthening environmental protection.
The paper provides a quantitative reference for evaluating China’ low-carbon competitiveness, which is beneficial for environmental policymaking. In addition, the evaluation and analysis methods offer relevant implications for developing countries.
1. Introduction
The development of a low-carbon economy is currently a worldwide goal. In particular, developed countries are fostering low-carbon economies to powerfully heighten national competitive advantages, as they strive to develop low-carbon industries and technologies. With the accelerating pace of China’s urbanization, industrialization, agricultural modernization and information technology development, economic and social development continues to confront serious resource and environmental problems, such as the shortage of water resources, poor air quality standards and low energy efficiency. Therefore, China’s “Twelfth Five-Year Plan” clearly identifies scientific development as its main focus. Hastening the transformation of patterns of economic development is the plan’s main initiative with the goal of building a resource-saving and environmental-friendly society. In 2015, the Fifth Plenary Session of the 18th CPC Central Committee proposed that China should adhere to the path of green development, affluent living and better ecology. In addition, China should promote the establishment of a green, low-carbon and circular development industrial system; the construction of a modern low-carbon energy system that is safe and efficient; and the formation of an intensive resources perspective that focuses on saving and recycling resources. Thus, enhancing the competitiveness of low-carbon will help China achieve sustainable development and the construction of an ecological civilization.
In 2003, the British White Paper “Our Energy Future: Creating a Low-carbon Economy” first proposed the concept of “low-carbon economy,” stressing that greater economic output can be obtained by reducing pollution and consumption. A competitive low-carbon economy can create lasting economic value through low-carbon technologies, products and services (Lee et al., 2010). Scholars in China and abroad have studied low-carbon issues from three main perspectives. The first is the relationship between carbon emissions, energy consumption and the country’s ageing population. Studies have shown that energy consumption is the source of carbon emissions, and an ageing population may reduce carbon emissions (Ramanathan, 2006; Soytas et al., 2007; Dalton et al., 2008; Puliafito et al., 2008). The second consideration is the importance of carbon and energy tax policies. Carbon and energy tax policies can lead to low-carbon production and lifestyles and promote economic development (Nakata and Lamont, 2001; Cheng et al., 2007; Hughes and Strachan, 2010). The third perspective is the relationship between the low-carbon economy and a country’s competitiveness. A low-carbon economy can reinforce the national economy and enhance national competitiveness (Lee et al., 2007; Strachan et al., 2008).
In 2009, however, economists began filling the gaps in the literature regarding the competitiveness of low-carbon initiatives, as the extant literature had primarily focused on the construction of a theoretical index system (Lee et al., 2010; OECD, 2011). Evaluation methods were then the main component of the analysis (Jin and Shouhu, 2013), including the gray correlation analysis method (Chen et al., 2012) and the analytic hierarchy process method (Feng, 2011; Pan and Wang, 2013). These studies found that the overall low-carbon competitiveness of China showed an increasing trend year over year, with the low-carbon competitiveness of Beijing, Shanghai, Tianjin and Chongqing exceeding the average level of China and gradually forming a pattern that declined from the coastal to the inland provinces. However, these methods have strong subjectivity. Empirical analyses are primarily conducted with national comparisons or the specific analysis of a city or region, and certain analyses involve industries and enterprises. There is currently a lack of research on low-carbon competitiveness differences between the regions of a single country.
Based on the existing literature, this paper first details the construction of a low-carbon competitiveness evaluation index system involving the economy, society, the environment and policy to comprehensively measure the level of competitiveness. To overcome evaluation subjectivity, our study uses the catastrophe progression method proposed by Chinese scholar Du Xingfu; this can sequence the importance of all indices. The weight of each index is then determined using the principal component analysis method, and the low-carbon competitiveness of 31 provinces in China is calculated. Combined with the improved diagnosis of the obstacle indicator model, this allows us to deeply understand obstacles to certain provinces’ low-carbon competitiveness development. Furthermore, we use the spatial autocorrelation model to analyze the distribution of low-carbon competitiveness to provide new ideas and new research for the development of Chinese low-carbon competitiveness.
2. Materials and methods
2.1 Catastrophe progression method
The catastrophe progression method avoids the weight of each index in the quantitative calculation and overcomes the limitation of subjective weighting. It also considers the relative importance of each evaluation index, increases scientificity and rationality and makes the calculation simple and accurate. Therefore, this study uses the principal component analysis method to scientifically determine the primary and secondary indicators. The catastrophe progression method is used to evaluate low-carbon competitiveness. The specific steps involved are as follows:
Establish the mutation evaluation system.
Determine the type of mutation in each level of the index system. According to the basic principle of the catastrophe progression method, there are seven types of catastrophe systems. This paper involves the cusp, dovetail and butterfly catastrophe systems.
h(x) represents the potential function of state variable x. State variables x coefficients of α, β, γ and ε represent the control variables of state variables. If only one indicator is divided into two sub-indices, the system is a cusp catastrophe system; if an indicator is divided into three sub-indices, the system is a dovetail catastrophe system; if an indicator is divided into four sub-indices, the system is a butterfly catastrophe system (Chen and Yang, 2013).
Derive the normalized formula using a staging catastrophe equation.
Based on catastrophe theory, all critical points of potential function h(x) are composed of the equilibrium surface U. The equation of surface U is obtained by calculating the first derivative of h(x), namely, h(x)' = 0. The singularity set of the potential function is obtained by calculating the second derivative of h(x), that is, h(x)” = 0. The h(x)' = 0 and h(x)"= 0 can eliminate x; then we obtain a bifurcation set equation.
For the cusp catastrophe system model:
From h(x)'= 0, we obtain 4x3+2αx + β = 0, namely, 2x(2x2+α)+β = 0①; from h(x)"= 0, we obtain 12x2+2α = 0, namely,. Bringing equation ② into equation ①, we can obtain . Bringing equation ③ into equation ①, then 8α3 + 27β2 = 0, whereby we can know α =−6x2, β = 8x2. Therefore, the normalized formula of the cusp catastrophe system is:
Similarly, the normalized formula of the dovetail catastrophe system is:
The butterfly catastrophe system is:
where xα is the corresponding value of α; similarly, xβ, xγ, xε.Analyze the evaluation subject comprehensively with the advantage of a normalized formula and the principal component analysis method.
The first principal component of the principal component analysis method represents the direction of the sample data and is most relevant to the original variables. Therefore, in practice, each component of the characteristic vector corresponding to the maximum characteristic value can be used as the index weight, and the importance of each index is sorted.
Two different evaluation criteria for each control variable calculation are the complementary criterion and the non-complementary criterion.
Complementary criterion: If there is a clear interaction between the various control variables, we calculate the mean value of each control variable.
Non-complementary criterion: If there is no clear correlation between each control variable, we take the minimum value of each control variable.
For example: if variables C1, C2 and C3 obey the complementary criterion, ; if variables C1, C2 and C3 obey the non-complementary criterion,.
2.2 Spatial autocorrelation model
The spatial autocorrelation is divided into local autocorrelation and global autocorrelation. Global spatial autocorrelation is used to detect the spatial patterns of the entire region, using Moran’s I index to reflect the space-related degree.
Moran’s I calculation formula:
; ; wij is the spatial weight matrix, reflecting the relationship of provinces (cities and regions)., i = 1,2,…,n; j = 1,2,…,n. xi is the observed value of province i. n is the number of provinces (cities and regions).
Moran’s I is in the range [−1,1]. A value close to 1 indicates the presence of a strong positive spatial correlation between provinces (cities and regions); a value close to −1 indicates that there is a negative spatial correlation between provinces (cities and regions) and equal to 0 represents spatial uncorrelation.
It is difficult to detect the unit spatial association pattern in geographically different locations using global spatial autocorrelation analysis. Strong and significant global spatial autocorrelation may mask the correlation feature of a sub-sample that does not, in fact, exist. Occasionally, the local spatial correlation is opposite to the global spatial correlation.
Local Moran’s I calculation formula:
Moran’s Ii is the correlation coefficient of province i. Moran’s Ii > 0 denotes that the low-carbon competitiveness of province i and of adjacent provinces are similar. Moran’s Ii < 0 denotes that the low-carbon competitiveness of province i and of adjacent provinces are converse.
In the four quadrants of Moran’s I scattered point diagram, the first quadrant is a high-high (H-H) gathering area, indicating that the low-carbon competitiveness of the province (city and region) and of the adjacent provinces (cities and regions) are at a relatively high level, with a spatial diffusion effect. The second quadrant is a low-high gathering area (L-H), representing that the competitiveness of the province (city and region) is low and the competitiveness of neighboring provinces (cities and regions) is high, with the transitional spatial-related area performance. The third quadrant is a low-low gathering area (L-L), indicating that the low-carbon competitiveness of the province (city and region) and of the adjacent provinces (cities and regions) are relatively weak, with slow growth performance of the spatial correlation zone. The fourth quadrant is a high-low gathering area (H-L), representing that the low-carbon competitiveness of the province (city and region) is strong and the competitiveness of neighboring provinces (cities and regions) is weak, which exhibits a polarization spatial effect.
2.3 Obstacle diagnosis model
In the low-carbon competitiveness evaluation process, on the one hand, we attempt to understand the development of low-carbon competitiveness in China. On the other hand, we analyze the factors that hinder the stable improvement of low-carbon competitiveness in the economic and social development process and conduct a pathological analysis to explore the root of the problems. We combine the obstacle diagnosis model with a normalized formula in the catastrophe system.
We calculate the degree of deviation indicators:
Iij is the deviation of index j in province i and xij is the standardized score of index j in province i.
Then, we calculate the catastrophe progression of the index deviation, which is the obstacle degree of the upper layer index system after normalization. At the same time, using the normalized formula to calculate the obstacle level of each layer index, we can obtain the provincial low-carbon obstacle data of each subsystem and conduct an in-depth analysis. However, the non-complementary criterion for calculating the degree of obstacle is changed to “take the big from the small.”
2.4 Data sources
This paper selects 31 Chinese provinces (cities and regions) as the research object and establishes a low-carbon evaluation system that contains 25 indices, all of which are from the 2008-2014 “China Statistical Yearbook,” the “China Environment Yearbook” and the “China Environment Statistical Yearbook.”
3. Constitution of the index system
In reference to the existing papers on the low-carbon economy (Jin and Shouhu, 2013; Feng, 2011; Cheng et al., 2015; Li et al., 2015), 25 indices are selected from the four sub-systems of economy, society, environment and policy; therefore, the low-carbon competitiveness evaluation system is established to accurately appraise the low-carbon competitiveness status of 31 Chinese provinces. The specific index system is shown in Table I.
Low-carbon competitiveness index
| Total target layer | Target layer | Intermediate layer | Index layer | Forward or reverse |
|---|---|---|---|---|
| Low-carbon competitiveness | Economic system (A1) | Economic and industrial benefits (B1) | The percentage of tertiary industry in GDP (C1) | Forward |
| Growth rate of tertiary industry (C2) | Forward | |||
| Per capita GDP (C3) | Forward | |||
| Energy consumption (B2) | Coal consumption of RMB10,000 industrial output (C4) | Reverse | ||
| Fuel oil consumption of RMB10,000 industrial output (C5) | Reverse | |||
| Electricity consumption of RMB10,000 GDP (C6) | Reverse | |||
| Investment of environment and technology (B3) | The proportion of science and technology expenditure in fiscal expenditure (C7) | Forward | ||
| The proportion of energy saving and environmental protection expenditure in fiscal expenditure (C8) | Forward | |||
| Social system(A2) | Low-carbon life (B4) | Total annual passenger traffic volume of public steam (electric) vehicle (C9) | Forward | |
| The number of buses which per 10,000 people own (C10) | Forward | |||
| Gas penetration rate in city (C11) | Forward | |||
| Pollution control efforts (B5) | Processing capability of wastewater treatment facilities (C12) | Forward | ||
| Comprehensive usage rate of general industrial solid waste (C13) | Forward | |||
| Treatment rate of life garbage (C14) | Forward | |||
| The total investment in environmental pollution control (C15) | Forward | |||
| Environmental system (A3) | Low-carbon environment (B6) | Park green area of urban per capita (C16) | Forward | |
| The proportion of wetlands in precinct (C17) | Forward | |||
| Urban garden green space area (C18) | Forward | |||
| Increasing carbon sequestration basis (B7) | Percentage of forest cover (C19) | Forward | ||
| Afforestation area (C20) | Forward | |||
| Policy system (A4) | Institutional settings (B8) | Number of national and provincial environmental protection agencies (C21) | Forward | |
| Number of environmental protection agencies at all levels (C22) | Forward | |||
| Enforcement (B9) | Number of projects to implement environmental impact assessment (C23) | Forward | ||
| Number of Chinese People’s Political Consultative Conference and National People’s Congress recommendations (C24) | Forward | |||
| Number of letters and visits have been completed(C25) | Forward |
Notes:
Economic and industrial benefits, energy consumption, pollution control efforts and institutional settings in middle layer use complementary criterion. Low-carbon life, low-carbon environment, increasing carbon sequestration basis and enforcement in middle layer use non-complementary criterion. Economic system, social system, environmental system and policy system in target layer use complementary criterion
Where, coal consumption of 10,000 renminbi (RMB) industrial output = industrial coal consumption/industrial output value.
Fuel oil consumption of RMB10,000 industrial output = industrial fuel oil consumption/industrial output value.
Electricity consumption of RMB10,000 gross domestic product (GDP) = electricity consumption/GDP.
We select 2007, 2009, 2011 and 2013 as the four time points; as the unit is not uniform among the indicators and forward indices are standardized based on the minimum of the sample. The specific formula is as follows:
Additionally, reverse indices are standardized based on the maximum of the sample, as follows:
Based on standardization, we use the principal component analysis method to rank the indices in the index layer. According to the complementary and non-complementary criteria, we calculate the value of each index in the intermediate layer through normalized formulas. At the same time, to prevent the aggregation phenomenon of the intermediate layer indices obtained by the mutation series method, the intermediate layer indices are standardized again. Then, the indices are ranked by importance according to principal component analysis, and the value formula and the normalized formula are applied to obtain the index value of the target layer. The above method is followed until the low-carbon competitiveness level is obtained.
4. Results analysis
4.1 Low-carbon competitiveness of China
We use the average of the competitiveness of China’s 31 provinces as the overall level of China’s low-carbon competitiveness (Table II). From 2007 to 2013, China’s low-carbon competitiveness steadily increased. The 2008 financial crisis did not hinder the development of China’s low-carbon competitiveness, but accelerated the emergence of high-energy consumption and high-pollution industries and promoted the transformation of China’s economic development model. In 2009, China’s low-carbon competitiveness increased by 0.59 percentage points compared with 2008, and in 2011, China’s low-carbon competitiveness increased by 2.03 percentage points compared with 2009. However, in 2013, China’s low-carbon competitiveness increased by only 0.06 percentage points from 2011. This is mainly because China entered a comprehensive deepening reform stage. The industrial structure entered a period of deep adjustment, and the advantageous surplus capacity gradually shifted to the emerging developing economies; thus, the development speed of low-carbon competitiveness slowed. However, the State Council of China issued the “Twelfth Five-Year Plan” for energy development, in which a carbon tax has been included in the environmental protection tax law for the first time; in addition, sewage charges have increased. These measures further strengthen the sustainable development of China’s low-carbon industry.
4.2 Low-carbon competitiveness of provinces (cities and regions)
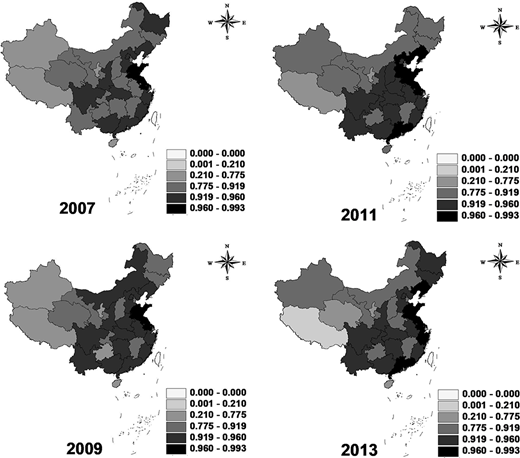
In 2007, in terms of low-carbon competitiveness, Jiangsu, Shandong, Zhejiang, Hebei and Beijing ranked as the top five. These five provinces (cities and regions) actively promoted green manufacturing; shutdown projects with high-energy consumption, such as flat glass, crude steel, electrolytic aluminum, pig iron and other high-pollution and high-energy consumption projects; and vigorously developed high-tech industries and equipment manufacturing. The five provinces (cities and regions) continued to improve the structure of the three industries, and tertiary industry in the five provinces (cities and regions) has developed rapidly, with an annual growth rate exceeding 13 per cent. Moreover, these provinces took the lead in wind power generation, photovoltaic power generation and other fields of energy in China. Guizhou, Hainan, Xinjiang Uygur, Ningxia Hui and Tibet had the lowest low-carbon competitiveness. The economic growth of the five provinces (regions) mainly depended on the development of the secondary industry, which represented an increasing proportion of GDP. The industrial structure of the five provinces (regions) was mainly dominated by heavy chemical industries, and the technology research, introduction and absorption capacity of energy production and utilization were lower than the national average, especially in the fields of transportation, power, chemicals and metallurgy, which led to greater constraints and pressure to improve low-carbon competitiveness. From the perspective of China as a whole, the low-carbon competitiveness of the eastern coastal areas was stronger than that of the central and western provinces (cities and regions). Additionally, the competitiveness of Sichuan, Shaanxi and Hubei provinces in the central area was much higher than other parts of the Midwest; thus, they formed a “high-low-high-low” ladder distribution. Tibet and Xinjiang were subject to their economic development and technological innovation levels and unable to take full advantage of their natural resources; therefore, their low-carbon competitiveness was below the average level of China.
In 2009, the low-carbon competitiveness of Jiangsu, Shandong, Guangdong, Liaoning and Zhejiang provinces ranked in the top five, as Guangdong and Liaoning provinces enhanced their competitiveness by improving the policy system. In the 21st Century, Guangdong promulgated the “Pearl River Delta Environmental Protection Special Planning,” the “Guangdong Unit GDP Energy Consumption Evaluation System Implementation Plan,” the “Development Plan of Nine Industrial Industries in Guangdong Province” and the “Development and Reform Planning for the Pearl River Delta Region.” Furthermore, WWF Hong Kong Branch, The Climate Group, Hong Kong Productivity Council and Netherlands ECOFYS Company all support the “Low-carbon Projects for Pearl River Delta Production.” All these initiatives have greatly promoted the rapid rise of the low-carbon economy in Guangdong and significantly improved its competitiveness. In contrast, Liaoning Province incorporated ecological province construction into the provincial target responsibility assessment system, and 65 agriculture-related counties (districts) and 14 cities launched ecological city (county and district) planning. At the same time, with the approval of the State Council, the development and opening of the Liaoning coastal economic zone has emerged as a national development strategy, emphasizing the elimination of outdated production capacity, promoting industrial restructuring and upgrading and forming an advanced manufacturing-oriented modern industrial system. Thus, the low-carbon competitiveness of Liaoning significantly increased, surpassing Zhejiang. However, Guizhou, Hainan, Ningxia Hui, Xinjiang Uygur and Tibet continued to occupy the last five low-carbon competitiveness positions. With continuous economic growth, the environment and resources of these five provinces (regions) became increasingly unable to bear the pollution and excessive resource consumption caused by traditional economic growth; however, the traditional pattern of economic development possessed inertia and rigidity, leading the low-carbon economy into difficulties. Overall, the low-carbon competitiveness level of the Bohai Sea Region was higher than that of other regions; the low-carbon competitiveness of the central regions had increased significantly, while low-carbon competitiveness in the northwestern provinces (regions) developed slowly and continued to lag far behind other provinces (cities).
In 2011, the Chinese provinces (cities and regions) with the best low-carbon competitiveness were Guangdong, Shandong, Jiangsu, Liaoning and Hebei provinces. During the period of the “Eleventh Five-Year Plan,” Hebei invested in many biomass power generation projects; the methane recovery power generation of municipal waste incineration and landfill gas methane recovery power generation for Hebei saved significant amounts of energy. Furthermore, China General Nuclear Power Corporation, China Energy Conservation and Environmental Protection Group, China Longyuan Power Group Corporation and other large enterprises had entered Chengde and Zhangjiakou, building large wind farms. Through “China Power Valley” industrial projects, Baoding became China’s low-carbon urban development project pilot; thus, dramatically increasing the low-carbon competitiveness of Hebei. The low-carbon competitiveness of Qinghai, Hainan, Shanghai, Ningxia Hui and Tibet were the lowest in China. Guizhou accelerated the development of ecological agriculture, integrating information technologies and biotechnologies into conventional agricultural technologies, mainly strengthening the production of special new agricultural products. The province promoted four integrated reforms of mineral resource allocation, which involved coal phosphorus, coal-fired electricity, coal steel and coal aluminum and improved the bidding mechanism for minerals, land and other resources, thus significantly improving the province’s low-carbon competitiveness, separating it from the inadequate low-carbon group. In 2011, the high value cluster of Chinese low-carbon competitiveness appeared in the Bohai Sea Region and on the Southeast Coast; however, the low-carbon development of Jiangxi, Tibet and Ningxia Hui lagged behind, becoming areas of China’s low-carbon competitiveness “depression.”
In 2013, Jiangsu, Guangdong, Shandong, Zhejiang and Liaoning provinces led China in low-carbon competitiveness. Zhejiang deeply implemented transformation and upgrading measures, including “four-for-three,” “five water cohabitation” and “one split and three changes.” In Zhejiang province, strategic emerging industries and high-tech industries accounted for 23.5 per cent and 25.6 per cent of the industrial added value. Additionally, Zhejiang actively developed low-carbon buildings and built 450 million square meters of energy-efficient buildings. Thus, the low-carbon competitiveness of Zhejiang again exceeded that of Liaoning. The low-carbon competitiveness of Ningxia Hui, Qinghai, Hainan, Shanghai City and Tibet lagged behind other regions. The low-carbon competitiveness of Shanghai City was constrained by the low-carbon environment and carbon sinks; however, that of the remaining four provinces (regions) was subject to their energy consumption capacity. In 2013, the low-carbon competitiveness of the eastern coastal areas remained at a high level; however, that of Hebei and Fujian provinces weakened dramatically, while that of midwestern China also declined.
In summary, from 2007 to 2013, the peak zone for China’s low-carbon competitiveness extended from Shandong and Jiangsu provinces to the Bohai Sea Region, then moved into the eastern coastal areas and the Yangtze River Basin. At the same time, the low-carbon competitiveness of Southwest China improved significantly, while the low-carbon competitiveness of Northeast China remained stable. Currently, the Tibet, Ningxia Hui, Guizhou and Jiangxi province are the regions with the lowest competitiveness in China and their development lagged far behind the Chinese national average (Figure 1).
4.3 Spatial correlation analysis of low-carbon competitiveness
In this paper, we use GeoDa (spatial analysis software) to calculate global Moran’s I of low-carbon competitiveness in China from 2007 to 2013 and to calculate the first-order adjacency matrix to determine the spatial weight matrix.
From Table III, we can observe that the value of Moran’s I increased significantly from 2007 to 2009, which showed that the spatial correlation of China’s provinces (cities and regions) was enhanced, and there was an obvious global spatial agglomeration effect on China’s low-carbon competitiveness. However, after 2009, Moran’s I value decreased rapidly, nearly to zero, indicating that China’s spatial agglomeration effects of low-carbon competitiveness disappeared, the spatial correlation of regional low-carbon competitiveness weakened and the activities of low-carbon interactive development decreased. Each province (city and region) independently conducted low-carbon development, which was not conducive to the overall development of China’s low-carbon economy.
China’s Moran’s I of low-carbon competitiveness in 2007-2013
| Year | 2007 | 2009 | 2011 | 2013 |
|---|---|---|---|---|
| Moran’s I | 0.2236 | 0.2332 | 0.0270 | 0.0629 |
As can be observed from Table III, the majority of Chinese provinces are distributed in the high-high gathering area and 61.29, 67.74, 64.52 and 67.74 per cent of 31 Chinese provinces have a conspicuous positive spatial correlation in the respective four periods. At the same time, the spatial agglomeration phenomena first expands, then shrinks, before reaching stability.
High-high gathering areas are mainly concentrated in the three northeastern provinces, the Bohai Sea Region and the Southeast Coast (Table IV). This district has a high level of economic development, reasonable industrial structure and layout, high-quality personnel and advanced technologies. These features can effectively improve the utilization efficiency of resources and the environment, meet strict environmental regulations, promote the rapid development of a low-carbon economy and show a moderate trend for diffusion, the scope of which is mainly in the Inner Mongolia, Hubei, Hunan, Guizhou and Chongqing City.
Spatial clustering of low-carbon competitiveness (2007-2013)
| Year | ||||
|---|---|---|---|---|
| Gathering area | 2007 | 2009 | 2011 | 2013 |
| High-High(H-H) | Tianjin, Jiangsu, Shandong, Beijing, Anhui, Zhejiang, Jiangxi, Liaoning, Henan, Guangdong, Chongqing, Jilin, Fujian, Hebei, Heilongjiang, Inner Mongolia, Hubei, Guangxi and Hunan | Heilongjiang, Shandong, Henan, Jiangsu, Anhui, Hubei, Zhejiang, Jiangxi, Hunan, Fujian, Guangxi, Guangdong and Jilin Liaoning, Tianjin, Shaanxi, Inner Mongolia, Chongqing, Hebei, Shanghai and Beijing | Heilongjiang, Shanxi, Shandong, Henan, Jiangsu, Anhui, Hubei, Zhejiang, Jiangxi, Hunan, Fujian, Guangxi, Guangdong, Jilin, Liaoning, Tianjin, Inner Mongolia, Chongqing, Hebei and Beijing | Heilongjiang, Shanxi, Shandong, Jiangsu, Anhui, Hubei, Zhejiang, Jiangxi, Hunan, Guizhou, Fujian, Guangxi, Guangdong, Jilin, Liaoning, Tianjin, Shaanxi, Inner Mongolia, Chongqing, Hebei and Beijing |
| Low-High(L-H) | Shanxi, Ningxia, Guizhou, Hainan and Shanghai | Shanxi, Ningxia, Guizhou and Hainan | Ningxia, Tibet, Guizhou, Hainan and Shanghai | Ningxia, Henan, Hainan and Shanghai |
| Low-Low(L-L) | Xinjiang, Tibet, Qinghai and Gansu | Xinjiang Uygur, Tibet, Qinghai and Gansu | Xinjiang, Qinghai and Gansu | Xinjiang, Tibet, Qinghai and Gansu |
| High-Low(H-L) | Yunnan, Shaanxi and Sichuan | Yunnan and Sichuan | Yunnan, Shaanxi and Sichuan | Yunnan and Sichuan |
Low-high gathering areas are mainly concentrated in Shanxi, Guizhou and Ningxia Hui (Table IV). The five provinces (regions) are located in the plateau regions, which are rich in mineral resources. These regions must bear a large amount of the environmental and resource costs of China’s rapid economic development process, and have not focused on ecological compensation in undertaking the industrial transfer process of Eastern China. Therefore, low-carbon competitiveness is much lower than in neighboring provinces (cities and regions). If the radiation-driven effect of high- and low-carbon competitiveness in the surrounding areas can be used effectively, the low-carbon level of these gathering areas will increase dramatically.
Low-low gathering areas are distributed across China’s western regions (Table IV). These regions are located in inland China, with no location advantage, where it is difficult to obtain external resources. The main feature of these areas is that the industrial structure is highly dependent on the resources and energy, and the level of science and technology is relatively inadequate, which leads directly to problems such as the inefficient use of energy resources and the destruction of the environment. Simultaneously, as the key national energy bases, Xinjiang and Gansu should strive to improve energy saving regarding the transportation, construction and mining industries, fully use local resources and rebuild a low-carbon industrial system to enhance competitiveness.
High-low gathering areas include Yunnan, Sichuan and Shaanxi (Table IV). These three provinces have natural resource advantages, a high forest coverage rate, rapid tertiary industry development and convenient public transportation; therefore, low-carbon competitiveness is higher here than in surrounding areas. High-low gathering areas are typically polarized, and the low-carbon cooperation mechanisms between these provinces and adjacent areas are not perfect. Additionally, the gathering areas lack a reasonable layout and extension of the industrial chain. Therefore, such a development mode is not conducive to the improvement of China’s low-carbon competitiveness.
4.4 Obstacle factor diagnosis
Based on China’s low-carbon competitiveness, we calculate the obstacle degree of the index layer and the intermediate layer to understand the constraints of China’s low-carbon competitiveness development.
4.4.1 Obstacle factor in the intermediate layer.
From a holistic perspective, the main obstacles to the development of China’s low-carbon competitiveness are the realization of a low-carbon environment, enforcement and low-carbon lifestyles. First, China’s implementation of environmental policy started late; therefore, the policy system remains imperfect and implementation is low. Second, the economy is in a transitional period, and industries with high-carbon emissions remain the pillars of China’s economic growth; thus, the level of environmental pollution is relatively high. Third, the per-capita income level remains low and is unable to effectively improve living standards. In addition, the economic and industrial benefits and investment in the environment and technology have played an increasingly small role in hindering the development of China’s low-carbon competitiveness. Thus, we can observe that China’s emphasis on environmental protection has increased significantly and the initial results of low-carbon development have been revealed.
From the perspective of each province, in 2007-2013, the main obstacles for Hebei, Shanxi, Liaoning, Jilin, Heilongjiang and Anhui provinces regarding low-carbon competitiveness were economic and industrial benefits, low-carbon lifestyles, low-carbon environments and enforcement. The economic hindrance in Hebei, Shanxi and Jilin provinces was gradually enhanced over this period and the economy of the three provinces mainly relied on traditional heavy industry with high pollution and energy consumption. As low-carbon competitiveness was mainly restricted by the economic structure, the three provinces should accelerate the optimization and upgrading of the industrial structure to promote the rapid development of tertiary industry. The obstacle degree of the policy enforcement of the above six provinces was reduced, while the environmental restraint of the policy system was strengthened in 2007-2013.
The main obstacles for the Inner Mongolia, Jiangxi, Henan, Guangxi Zhuang and Shaanxi regarding low-carbon competitiveness were economic and industrial benefits, investment in the environment and technology, low-carbon life, low-carbon environment and enforcement. The obstacle degree of economic and industrial benefits and investment in technology and the environment in Henan and the Inner Mongolia increased in 2007-2013. This finding indicates that the two provinces (regions) with a low industrial level have prominent economic structural contradictions and weak independent innovation capabilities. This finding also indicates that the development of a modern service industry in these areas is lagging, and the restrictive roles of the environment and resources has become prominent. Therefore, the tasks of energy saving and environmental protection remain arduous. In recent years, the obstacle degree of investment in the environment and technology in Shaanxi has risen, indicating that Shaanxi focuses insufficiently on science, technology and environmental protection and has poor energy and resource utilization efficiency. Additionally, the province’s technological innovation capacity needs to be improved. However, the public transport facilities in Jiangxi are relatively inadequate; the role of energy-saving and emission reduction is not significant and the garden green space area is small, leading to an inhibitory effect on a low-carbon environment.
The main obstacles of low-carbon competitiveness in Hubei, Hainan, Chongqing City, Guizhou and Yunnan are investment in the environment and technology, low-carbon life, low-carbon environment and enforcement. The six provinces have had many problems, such as a low level of industrialization, unbalanced urban and rural development, an irrational industrial structure and resources and environmental pressures. Furthermore, weak technological innovation fatigue, an extensive pattern of development and increasing social conflicts have all contributed to the low level of these provinces’ low-carbon competitiveness.
Because the low-carbon competitiveness of Gansu, Qinghai, Xinjiang Uygur, Ningxia Hui and Tibet was lower than others, the nine aspects of the obstacles are relatively high. The obstacle degree of investment in the environment and technology and enforcement in Gansu increased. The obstacle degree of pollution control efforts and institutional settings in Qinghai rose; and the obstacle degree of investment in the environment, technology and enforcement also rose. The impeditive role of economic and industrial benefits and environmental and technological investments was strengthened. In addition to increasing the carbon sequestration basis, the impeditive role of the other eight aspects in the Tibet increased. Therefore, in the western region, transportation infrastructure continued to be inadequate and the environment remained fragile. The irrational economic structure and weak capacity for self-development capacity have not improved. In 2007-2013, the development gap with other regions continued to expand.
The development of obstacle factors in the intermediate layer in other provinces was more balanced. In accordance with the development direction, these provinces were divided into three clusters. The first cluster with increasing carbon sequestration basis as its core included Jiangsu, Zhejiang, Shandong and Guangdong provinces, which increased the afforestation area and the forest coverage rate. The second cluster contained Beijing City, Tianjin City and Shanghai City, which should increase the environmental supervision, strengthen the role of environmental policy constraints and expand the size of the urban green space area. The third cluster included Fujian and Sichuan provinces, which could increase environmental and technological investments, heighten the utilization efficiency of resources and reduce carbon emissions, thus improving the environment.
4.4.2 Obstacle factor in index layer.
As the index system involves 25 indicators, to further research the main obstacle factors of China’s low-carbon competitiveness, we list the top three obstacle factors in accordance with the size of the obstacles, as shown in Table V.
Obstacle value of China’s low-carbon competitiveness in index layer
| Indicators order | |||||||||||||
|---|---|---|---|---|---|---|---|---|---|---|---|---|---|
| 2007 | 2009 | 2011 | 2013 | ||||||||||
| Region | Item | 1 | 2 | 3 | 1 | 2 | 3 | 1 | 2 | 3 | 1 | 2 | 3 |
| Beijing | Obstacle indicators | C20 | C17 | C22 | C20 | C17 | C12 | C12 | C20 | C17 | C12 | C17 | C20 |
| Tianjin | Obstacle indicators | C20 | C8 | C23 | C8 | C20 | C23 | C20 | C24 | C12 | C20 | C23 | C24 |
| Hebei | Obstacle indicators | C24 | C1 | C7 | C24 | C7 | C17 | C17 | C7 | C1 | C17 | C1 | C6 |
| Shanxi | Obstacle indicators | C4 | C10 | C25 | C4 | C10 | C24 | C10 | C17 | C18 | C17 | C2 | C18 |
| Inner Mongolia | Obstacle indicators | C10 | C7 | C23 | C10 | C7 | C17 | C10 | C17 | C12 | C2 | C10 | C17 |
| Liaoning | Obstacle indicators | C2 | C20 | C17 | C20 | C17 | C10 | C17 | C1 | C8 | C17 | C1 | C8 |
| Jilin | Obstacle indicators | C20 | C24 | C12 | C20 | C24 | C25 | C20 | C23 | C12 | C17 | C12 | C1 |
| Heilongjiang | Obstacle indicators | C14 | C24 | C23 | C14 | C23 | C7 | C23 | C14 | C12 | C7 | C17 | C24 |
| Shanghai | Obstacle indicators | C20 | C19 | C8 | C8 | C20 | C22 | C8 | C21 | C20 | C8 | C21 | C20 |
| Jiangsu | Obstacle indicators | C19 | C20 | C1 | C20 | C19 | C1 | C20 | C19 | C1 | C20 | C19 | C1 |
| Zhejiang | Obstacle indicators | C20 | C17 | C8 | C20 | C9 | C17 | C20 | C17 | C8 | C20 | C17 | C8 |
| Anhui | Obstacle indicators | C20 | C17 | C3 | C20 | C17 | C10 | C1 | C20 | C17 | C1 | C17 | C3 |
| Fujian | Obstacle indicators | C8 | C20 | C17 | C20 | C17 | C18 | C17 | C8 | C18 | C17 | C20 | C18 |
| Jiangxi | Obstacle indicators | C1 | C7 | C23 | C7 | C23 | C18 | C23 | C1 | C7 | C17 | C1 | C10 |
| Shandong | Obstacle indicators | C1 | C8 | C19 | C1 | C10 | C7 | C1 | C17 | C19 | C17 | C19 | C1 |
| Henan | Obstacle indicators | C1 | C17 | C10 | C1 | C10 | C17 | C1 | C21 | C17 | C1 | C17 | C10 |
| Hubei | Obstacle indicators | C23 | C17 | C18 | C17 | C23 | C7 | C23 | C17 | C18 | C17 | C1 | C21 |
| Hunan | Obstacle indicators | C21 | C23 | C17 | C23 | C17 | C18 | C17 | C12 | C18 | C17 | C18 | C7 |
| Guangdong | Obstacle indicators | C5 | C8 | C20 | C5 | C20 | C17 | C17 | C20 | C12 | C17 | C20 | C21 |
| Guangxi | Obstacle indicators | C17 | C3 | C8 | C17 | C7 | C3 | C17 | C1 | C10 | C17 | C1 | C10 |
| Hainan | Obstacle indicators | C21 | C12 | C23 | C21 | C25 | C23 | C21 | C23 | C24 | C15 | C21 | C25 |
| Chongqing | Obstacle indicators | C17 | C25 | C12 | C17 | C10 | C12 | C17 | C12 | C22 | C17 | C12 | C23 |
| Sichuan | Obstacle indicators | C17 | C23 | C7 | C17 | C7 | C23 | C17 | C23 | C1 | C17 | C1 | C3 |
| Guizhou | Obstacle indicators | C3 | C11 | C16 | C3 | C25 | C16 | C3 | C11 | C17 | C3 | C17 | C18 |
| Yunnan | Obstacle indicators | C17 | C25 | C3 | C17 | C3 | C18 | C17 | C3 | C18 | C17 | C3 | C18 |
| Tibet | Obstacle indicators | C7 | C9 | C12 | C7 | C23 | C12 | C23 | C12 | C13 | C7 | C21 | C15 |
| Shaanxi | Obstacle indicators | C24 | C17 | C23 | C17 | C13 | C18 | C17 | C12 | C18 | C17 | C1 | C18 |
| Gansu | Obstacle indicators | C23 | C2 | C18 | C18 | C25 | C23 | C14 | C23 | C18 | C14 | C3 | C17 |
| Qinghai | Obstacle indicators | C18 | C25 | C22 | C18 | C19 | C23 | C7 | C15 | C18 | C6 | C23 | C24 |
| Ningxia | Obstacle indicators | C6 | C9 | C2 | C6 | C22 | C23 | C2 | C4 | C6 | C4 | C22 | C23 |
| Xinjiang | Obstacle indicators | C19 | C25 | C17 | C2 | C19 | C17 | C19 | C18 | C12 | C19 | C17 | C12 |
In 2007-2009, the main obstacle factors for Chinese low-carbon competitiveness were the number of projects that implement environmental impact assessment projects, the afforestation area, the proportion of science and technology expenditure and the number of buses per 10,000 people. Environmental impact assessment projects mainly affected the low-carbon levels of the northwest, northeast and the middle reaches of the Yangtze River. The afforestation area restricted the improvement of low-carbon status in areas that included the Yangtze River Delta, the southeast coast, the Bohai Sea Region and the northeastern region. The influence of the proportion of science and technology expenditure in the total fiscal expenditure extended from Hebei, the Inner Mongolia, Jiangxi, Sichuan and Tibet to the northeast, southwest and the other nine s around the Bohai Sea Region. The restricted area of bus ownership per 10,000 people also extended from Shanxi, the Inner Mongolia and Henan to North China, Northeast China and the middle reaches of the Yangtze River.
In 2010-2013, the proportion of GDP attributable to tertiary industry, the capacity of wastewater treatment facilities, urban garden green space areas and afforestation were the main factors in China’s low-carbon competitiveness. The radiation range of the proportion of tertiary industry in GDP was from North China, the middle and upper reaches of the Yangtze River area to Northeast China, Southwest China, Northern China, and the Yangtze River Basin. The affected areas of the processing capability of wastewater treatment facilities from 11 provinces located in the Northeast, the Northwest, Bohai Rim Region, the middle and upper reaches of the Yangtze River area decreased to Beijing City, Jilin, Chongqing City and Xinjiang Uygur. The scope of the urban garden green space area from the southwest, northwest and middle reaches of the Yangtze River changed to the southwest and northwest. The influence portion of the afforestation area remained unchanged; this was the area of Beijing-Tianjin, the southeast coast and the Yangtze River Delta.
In 2007-2013, the most important factor for restricting the development of China’s low-carbon competitiveness was the proportion of wetlands in a precinct. Additionally, in 2007, 2009, 2011 and 2013, the number of provinces affected by this index was 14, 14, 19 and 24, respectively, involving most parts of China. It can be observed that the wetland has become an obstacle to enhancing low-carbon competitiveness in all Chinese provinces. For a long time, wetlands played an extremely important role in supporting the sustainable development of China’s economy and society. However, the problems of wetland infrastructure occupancy, reclamation, overfishing and pollution remained very serious. Therefore, the long-term planning of wetland protection should be further improved to comprehensively enhance the overall level of wetland protection in accordance with China's main functional area planning and the requirements of comprehensive management of mountains, forests, fields and lakes. We should focus on strengthening the supervision and protection of internationally and nationally important wetlands, national wetland parks, coastal wetlands and trans-regional and inter-basin wetlands. At the same time, a diversified investment mechanism should be established to broaden the sources of funding for wetland protection, promoting the establishment of an ecological compensation system.
5. Conclusions and suggestions
5.1 Conclusions
Based on the evaluation of low-carbon competitiveness, we apply the catastrophe progression model to actual analysis using 31 provinces (cities and regions) to study the current situation of China’s low-carbon competitiveness. Low-carbon competitiveness in China from the East[1] to the West[2] gradually decreases. The Tibet and Ningxia Hui have the lowest low-carbon competitiveness, while regions with the greatest low-carbon competitiveness range from Shandong and Jiangsu provinces to the east coast and the Yangtze River Basin in China. The spatial autocorrelation model showed that the global Moran’s I value of China’s low-carbon competitiveness increases first, then decreases and finally approaches zero. The spatial correlation of low-carbon competitiveness is extremely low, and each province is in a state of independent development. At the same time, the phenomenon of high-value agglomeration appears in the northeast, the Bohai Sea Region and the Southeast coast; low-value gathering areas are the Xinjiang Uygur, the Ningxia Hui and Gansu. Finally, through obstacle factor diagnosis, we also find that the development of low-carbon competitiveness in China is mainly restricted to economic, industrial, environmental and technological benefits. Additionally, hindrance from wetlands is most significant, affecting more than half of the 31 provinces (cities and regions). The inhibitory effect of the environment is gradually weakening; the impeditive function of the economy is becoming increasingly prominent.
In summary, the steady improvement of China’s low-carbon competitiveness will further stimulate the momentum of sustainable development; help strengthen the implementation of environmental protection policies; promote the transformation of industries into energy-saving, low-carbon and high-efficiency industries; expand the scope of high-tech applications; and facilitate the international transfer of China’s advantageous surplus capacity, enhancing China’s position in the global value chain.
5.2 Suggestions
The following suggestions are proposed as methods for promoting the development of low-carbon competitiveness:
First, China should fully champion the leading role of the eastern region in driving economic growth and should strengthen regional cooperation and promote the sustained, well-coordinated, stable development of each province (city and region). As the eastern region has higher low-carbon competitiveness than the central and western regions, it is necessary to reasonably guide the transfer of labor, capital and technology from the eastern regions to the central and western regions to promote the low-carbon competitiveness of the central and western regions through advanced experience and radiation effects. In addition, the central and western regions should strengthen their cooperation and exchanges with eastern regions, actively introduce advanced personnel and technologies, embrace the strategic opportunity of Western Development and follow a sustainable development path.
Second, China should optimize its industrial structure and develop low-carbon industries. Above all, China should increase the threshold for entry into “high-carbon” industries to reduce the number of enterprises with high-energy consumption, material consumption and carbon emissions. China should then promote industry and product profit lines and form brands and sales networks to enhance core competitiveness. Finally, China should develop modern service industries and high-tech industries and transform traditional industries that involve cement, chemicals and steel using advanced technology to reduce the carbon intensity of the GDP.
Third, China should enhance government supervision and strengthen environmental protections. With economic development, each province (city and region) should focus on ecological protection and transfer resource use patterns to achieve the intensive and economical use of energy and resources. China should also comprehensively manage and oversee the government effectively, constantly improving the protection of the environment, forest resources and wetlands, and realizing the spatial development and protection of land resources. Furthermore, China should reduce the loss of mineral, forest and other natural resources, improve the carrying capacity of the environment, make reasonable use of the market mechanism and reduce the cost of emissions reduction and environmental protections. Thus, the above measures could accelerate the development of China’s low-carbon competitiveness.
Notes
China East includes Beijing City, Tianjin City, Hebei, Shandong, Jiangsu, Shanghai City, Zhejiang, Fujian, Guangdong and Hainan.
China West includes Sichuan, Yunnan, Guizhou, Tibet, Chongqing City, Shaanxi, Gansu, Qinghai, Xinjiang Uygur, Ningxia Hui, Inner Mongolia and Guangxi Zhuang.
This research is supported by the National Social Science Foundation of China (Grant No. 18AJY010), and China Fundamental Research Funds for the Central Universities (Grant No. 310422107).

