


Social development is the ultimate goal of every nation, and climate change is a major stumbling block. Climate Risk Index has documented several climate change events with their devastations in terms of lives lost and economic cost. This study aims to link the climate change and renewable energy with the social progress of extreme climate affected countries.
This research used the top 50 most climate-affected countries of the decade and estimated the impact of climate risk on social progress with moderation effects of renewable energy and technology. Several competing panel data models such as quantile regression, bootstrap quantile regression and feasible generalized least square are used to generate robust estimates.
The results confirm that climate hazards obstruct socioeconomic progress, but renewable energy and technology can help to mitigate the repercussion. Moreover, improved institutions enhance the social progress of nations.
Government should improve the institutional quality that enhances their performance in terms of Voice and Accountability, Political Stability and Absence of Violence, Government Effectiveness, Regulatory Quality, Rule of Law and Control of Corruption to increase social progress. In addition, society should use renewable energy instead of fossil fuels to avoid environmental degradation and health hazards. Innovation and technology also play an important role in social progress and living standards, so there should be free hand to private business research and development, encouraging research institutes and universities to come forward for innovation and research.
The ultimate goal of all human struggle is to have progress that facilitates human beings to uplift their living standard. One of the best measures that can tell us about a nation’s progress is Social Progress Index (SPI), and one of many factors that can abruptly change it is the climate; so this study is an attempt to link the relationship among these variables and also discuss the situation where the impact of climate can be reduced.
Although social progress is an important concept of today’s economics discussion, relatively few studies are using the SPI to measure social well-being. Similarly, there is consensus about the impact of climate on people, government and crops but relatively less study about its overall impact on social progress, so this study attempts to fill the gap about the relationship between social progress and climate change.
The main contribution of this study is the solution for the impact of climate risk. Climate risk is not in human control, and we cannot eliminate it, but we can reduce the negative impacts of climate change. Moderator impact of renewable energy decreases the negative impact of climate change, so there is a need to use more renewable energy to mitigate the bad consequences of climate on social progress. Another moderator is technology; using technology will also mitigate the negative consequences of the climate, so there is a need to facilitate technological advancement.
1. Introduction
Social development refers to improvement in the standard of living of individuals in all walks of life, corresponding to access to capabilities and appreciation of their functioning. Sustainable Development Goals (SDGs) show this global effort to improve social development. This study measures social development using Social Progress Index (SPI) to link climate change with social development. It is based on 54 factors related to three dimensions:
basic human needs;
well-being (health and sanitation); and
opportunity (inclusion, equality and personal freedom).
Each dimension has four components which are based on several outcome indicators. The important contribution of SPI is that it assesses the well-being of a society by observing social and environmental outcomes instead of economic factors, so it is more appropriate to measure the state of human living. The outcome parameters of all 17 SDGs are included in the SPI, and the SPI (2020) report suggests that the current progress rate will not be achieved until 2092. Sen (1986), North (1989), Stiglitz (2009) and Porter et al. (2017) provided input in developing the SPI index.
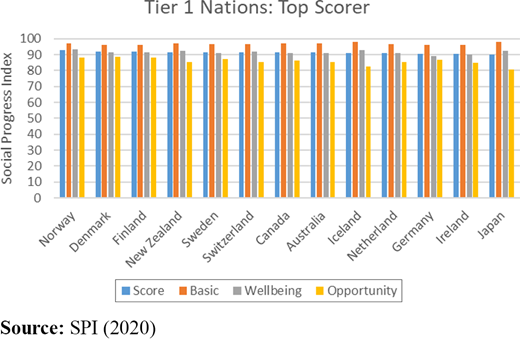
SPI (2020) reported six tiers of nations and tier 1 being high social progress achievers, including Norway, Denmark and Finland (shown in Figure 1). On the lower end, tier 6 includes South Sudan, Chad, Central African Republic, Eritrea, etc. The top improvers of the decades are Gambia, Ethiopia and Tunisia, whereas the USA is one of three declining countries over the same 10 years. Thirteen countries’ performance is beyond their GDP, and toper is Kyrgyzstan, whereas 35 countries are underperformers and at the bottom is Saudi Arabia. Overall, the world’s performance has increased from 60.63 to 64.24. From 12 components, personal safety and environmental quality are constant, but inclusiveness and personal rights have declined. Moreover, the remaining 8 components are improving. The underimproved components are environmental quality and personal safety, representing the standard of living. Several studies have pointed out renewable energy and technological innovation as potential environmental quality instruments (Wang et al., 2021; Zahid et al., 2021).
Many factors can affect social progress, and this study incorporates certain input factors that impact social progress, like climate risk being the current focus of research and eco-friendly energy use, technological innovations and government institutions being possible policy options in mitigating the climate change risk. Hence, countries focusing on energy security and sustainability by increasing the share of renewable energy and focusing on energy-related technological innovation can improve their social progress score.
Within the climate change domain, floods, cyclones, rising temperatures, drought, extreme weather, crop failure and polar cap melting are examples of climate risks that have far-reaching effects on economies. Intergovernmental Panel on Climate Change (IPCC) (2019) report concluded that climate is becoming vulnerable and is a threat to the ecosystem leading to less progress in human living. For example, it is common to observe that the physical infrastructure of energy and logistics can be damaged because of storms and floods. Similarly, drought leads to less agricultural output (Ali et al., 2021; Khan et al., 2019) and all of them lead to a fall in the standard of living. Climate Risk Index (CRI; 2021) reported a $2.56tn (PPP) loss because of extreme weather conditions, and over 475,000 people died because of it during the period 2000–2019. United Nations Environment Programme report (2016) estimated that annual loss would be $140bn to $300bn from 2030, and from 2050 such loss of income would be $280bn to $500bn annually. IPCC estimated that a loss would be $54tn at global warming 1.5°C level and $67tn at a 2.0°C level by 2100.
Su et al. (2018) projected the drought losses in China under the condition of 1.5°C and 2.0°C and concluded that the losses at 1.5°C would be 10 times higher than in the reference period of 1986–2005. Kundzewicz et al. (2019) estimated that floods cause a loss of more than $10bn in China each year, and such floods are expected to continue with rising trends. Wang et al. (2019) estimated 27,900 additional deaths in China’s urban population because of the temperature rise from 1.5°C to 2°C. The estimation for 1.5°C is 48.8–67.1 per million.
This study has taken CRI (2021) for the climate risk variable. CRI is primarily for extreme weather-related events like a flood, cyclones, heatwaves and storms, and it is not for slow geological factors like rising sea levels, ocean warming, glacier melting and acidification. One important aspect of this index is that it cannot be used for linear prediction as factors contributing to its formation, like heat waves and storms, are unpredictable. It should be noted that the occurrence of single events cannot be easily attributed to climate change. CRI captures only direct impacts such as income loss and fatalities because of extreme weather events, but it may have indirect impacts like food security (Fahad et al., 2020; Khan et al., 2022) and energy security (Cergibozan, 2022), which is why this study assesses the direct and indirect effect holistically against SPI.
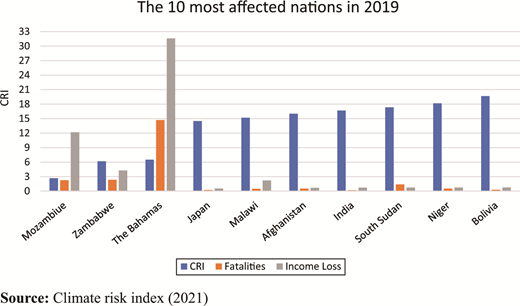
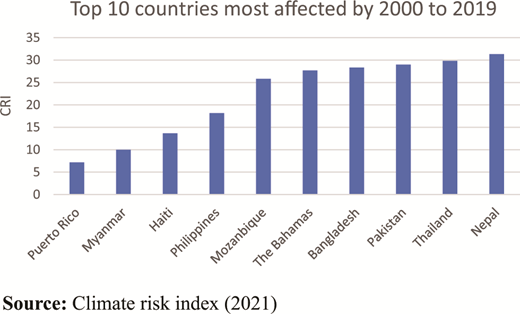
In 2019, a major cause of climate change was storms and cyclones, and such cyclones hit six out of the ten most affected countries and are expected to rise. Figure 2 indicates the top ten countries affected by climate in 2019 based on the overall index, fatalities and income loss from climate change. These ten countries sustained 4,000 fatalities, $42,000m in losses in income and millions of people were directly affected by various climate events like tropical cyclone Idai in Mozambique, Zimbabwe and Malawi; Dorian in the Bahamas; Hagibis in Japan; floods in Afghanistan and India and the wildfire in Bolivia. Haiti, Pakistan and Philippines are the countries affected by a single intense event that has a recurring impact, so such countries are continuously on the list of the top ten most affected countries from 2000 to 2019 (Climate Risk Index, 2021). Figure 3 indicates the top ten countries affected by climate between 2000 and 2019.
Logically, if there is a high risk of climate change, most of the country’s resources would be diverted toward rehabilitating people and reconstructing infrastructure damaged by climate change ignoring the poor who need social support. The lack or inability of national focus on development and mitigation capacity building would lead to a divide between the rich and the poor, whereby the rich could finance their way to climate change resilient living (Islam and Winkel, 2017; Fatima et al., 2021).
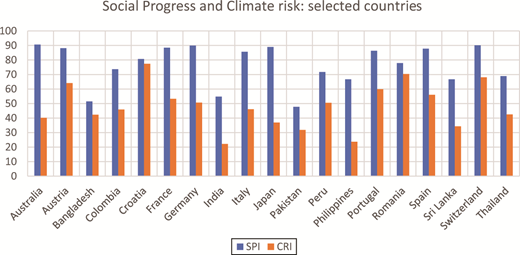
Figure 4 indicates social progress and climate risk data for the countries selected for this study, top climate risk countries subject to data availability for all variables. This figure shows countries comparing the social development and climate change risk. Here, it can be noted that not all countries depict a negative association between SPI and CRI. Hence, this mixed association calls for exploring how these high-climate-risk countries could sustain high social progress while facing higher climate change risk.
1.1 Objectives of the study
The ultimate goal of all human struggles is to have progress that facilitates human beings to uplift their living standard. One of the best measures that can tell us about a nation’s progress is SPI, and one of many factors that can abruptly change it is the climate, so this study is an attempt to link the relationship among these variables and also discuss the situation where the impact of climate can be reduced.
1.2 Research questions
It is hypothesized that climate, renewable energy, technology and government efficiency can play an important role in social progress, so the following questions are set to analyze.
What is the impact of change in climate on social progress?
What is the role of renewable energy in social progress?
Can we mitigate the impact of climate using renewable energy as a moderator?
Whether technology plays a role in social progress or not?
Does technology act as a moderator to change the impact of climate on social progress?
1.3 Novelty of the study
Although social progress is an important concept of today’s economics discussion, relatively few studies use the SPI to measure social well-being. Similarly, there is consensus about the impact of climate on people, government and crops but relatively fewer studies about its overall impact on social progress, so this study attempts to fill the gap about the relationship between social progress and climate change.
A similar case is with renewable energy and social progress. Again, there may be some idea about their relationship, but most studies discuss the impact of renewable energy and carbon emission or renewable energy and the economy but not on the final outcome, social progress.
Climate change like floods, cyclones and heatwaves are not (less) in the control of man, but whether we can reduce its impact by using technology? This study attempts to give its answer by using technological innovation and renewable energy as moderators. Moreover, this study has checked the consistency and robustness of the results by applying various estimation techniques like quantile regression, bootstrap quantile regression (BSQReg) and feasible generalized least squares.
2. Literature review
2.1 Impact of climate change
The impact of environmental degradation has been studied by many researchers like Nordhaus(1977); O'Riordan and d'Arge (1979); Schelling (1992); Edmonds (1996); Goulder and Mathai (2000); and Fatima et al. (2021), and they generally agreed on the negative externality of climate change and has proposed carbon pricing. But, Pindyck (2013a, 2013b) concluded that the economic theory does not support the predicted economic effects of climate change.
Fankhauser and Tol (2005), Hallegatte (2005), Dell et al. (2014), Eboli et al. (2010), Burrows et al. (2011), Bretschger and Valente (2011), Fang et al. (2013a, 2013b), Ciscar et al. (2014) and Lemoine and Kapnick (2016) claimed that climate change has a negative impact on the growth rate of GDP, mostly by decreasing agriculture output and productivity of resources but Masters and McMillan (2001) and Burke et al. (2015) are not agreed with this.
The impact of climate on development is debatable (Pal et al., 2009; Dell et al., 2014; Fatima, 2021). Masters and McMillan (2001) concluded that the impact of climate on agriculture is overemphasized. If institutions are effective, the negative impact of climate would disappear (Acemoglu et al., 2005; Easterly and Levine, 2003), but Alsan (2015) differs.
Das Gupta (2014) concluded that developed nations are the main drivers of global warming, but the fallout is on the developing countries in terms of loss of agricultural productivity, health and increased natural disasters. In addition, population growth in developing countries makes the situation more adverse. Kazmi et al. (2015) adopted the Down Scaling Model from data from 44 national stations from 1961 to 1990, predicted the scenario up to 2099, and concluded that the feeding sources of the Indus River are vulnerable to the temperature hydro agriculture are at risk.
Zinsstag et al. (2018) suggested that one health system is good for tackling the negative impact of climate change on the health of humans, animals, wildlife, fish stock and pets. However, climate change has a paradoxical impact like when electricity demand for cooling rises, but its demand for heating decreases, carbon cause drought but also causes fertilization and heat stress increases but cold stress decreases, so there is still ambiguity in concluding its net effect (Field and Barros, 2014; Tol, 2018).
Tol (2018) concluded from a study of 27 published articles that the rise of mean temperature to 2.5°C reduces 1.3% of individual income and also has an adverse effect on life longevity (Fatima et al., 2021). Moreover, he found that 8 out of 27 have shown a negative net welfare impact, whereas 3 have shown a positive impact, so there is still uncertainty about the net welfare gain or loss from the rising temperature (Tol, 2018).
Budolfson et al. (2019) explained that if future generations are projected to be richer with fewer populations, they would be financially better to handle the damage. Conversely, if developing countries remain poor with a high population, they would be more exposed to climate change. Jiang et al. (2020) projected that flood losses in China would be four times at 1.5°C and 17 times at 4.0°C. They also studied the reverse scenario and concluded that a reduction in 0.5°C warming would increase China’s GDP by 0.04%.
2.2 Renewable energy and social progress
Barber (1956), in his book Energy and Society: The Relation Between Energy, Social Change, and Economic Development, concluded that think beyond the traditional view of nation development like race, religion, culture, army and geography and accept that available energy is the basic driver of social development.
Wilkinson et al. (1982) investigated the use of energy and social disruption in western countries and concluded that the results were inconsistent and needed theoretical background and proper methodology. Roberts and Grimes (1997) concluded that energy use has an inverted U-shape impact, but poor countries’ performance is still beyond the turning point to gain from energy without damaging society. Similarly, Hanif et al. (2020) showed the nonlinear effect of transitioning to renewable energy on human development.
Cottrell (2009) concluded in his book that the amount of energy limits the power of man (society) and also sets a direction for his future path of progress. He suggested that low-energy societies get progress by using more energy. Sathaye et al. (2011) explained a positive correlation between energy use, greenhouse gas and economic development. All this is uncertain on social development, but if we use renewable energy, it will decouple the correlation between energy and carbon emission, and that will have a positive impact on social development, and nations can also achieve sustainable development goals. Similar conclusions were drawn by Sial et al. (2022).
Colombo et al. (2013) suggested that renewable energy is a solution for sustainable social development. Papanelopoulou and Nieto-Galan (2016), in their book, stated that energy circulation was the main source of social development in Spain for the period of 1868–1890. Sen and Ganguly (2017) suggested that renewable energy is a strategic commodity essential for the functioning of the economy, especially for developing economies. Moreover, renewable energy is essential to mitigate the impact of climate change and cause sustainable development. On the contrary, Gámez et al. (2017) suggested that the impact of renewable energy on social development is subject to the condition of the region, source, amount and technology.
Khribich et al. (2021) concluded that renewable energy in high-income countries does not significantly contribute to social development in the short run, but renewable energy has a significant positive impact in the long run. Similarly, Hanif et al. (2020), Zahid et al. (2021) and Sial et al. (2022) assessed that while countries are transitioning toward renewable energy, they might face a fall in social development while the country is developing renewable energy infrastructure, but in the longer term, renewable energy is beneficial for social development.
2.3 Technological innovation and social development
The sole purpose of technology is to improve the standard of living and achieve higher needs and wants. Technology-based innovation has helped achieve higher incomes from higher productivity, and this pattern has been confirmed for the USA (Ogburn, 1955).
Several studies have confirmed the relationship between technological innovation and social development. A study by Hanif et al. (2020) compared technology with human capital. A study by Wang et al. (2021) and Arshed et al. (2021b) related technology level of the economy with the environmental quality and Salem et al. (2021) showed that an increase in technological innovation leads to sustainability.
2.4 Government institutions and social development
Sun (1994) analyzed that people think the US Government is unjust for taxes and is a barrier to human freedom, but this is not so. Government institutions are vital for developing a better society by engaging all those who are left behind. Evans (1996) suggested that state – society synergy is important for enhancing social development, and he argued that active government with a vibrant private sector could bring social progress.
Adelman (2000) emphasized that the government is the primary mover of social development because the private sector is a profit seeker and can damage the environment and social fabric, but the government can set a direction by enforcing different laws to favor social development.
Gilson (2003) suggested that government can play an important role in the health-care system and is vital for social development. Rothstein (2011) explained in his book that the quality of government and social trust are important for the social development of society. There are governments worldwide but still many social problems because of the low quality of government intuitions. On the contrary, active intuitions can make laws and implement them to better society. Several empirical studies, like Abduqayumov et al. (2020), Hassan et al. (2020) and Arshed et al. (2021a), have confirmed the positive role of institutions on social development.
Empirically, few studies have selected the indicator of climate change like temperature, precipitation or indicator of the environment like CO2 emissions, which do not holistically represent the climate change risk. The recent development of the climate change risk index is developed using the economic and health-related consequences of climate change in the country. It represents both frequency and severity of climate change events that could affect social development. Further empirical studies have used single-variable indicators of social development like poverty and income inequality. Even composite index like HDI was criticized for their eventual evolution from GDP. This study has proposed the SPI, a multidimensional index of social development without involving GDP. Empirically, there is a dearth of studies which have explored the role of climate change risk against a holistic indicator of social development and further provided mitigation strategies. Using the moderator model approach, this study proposes renewable energy and technological innovation as possible policy options to mitigate climate change risk.
3. Methodology and results
3.1 Data Framework
The dependent variable SPI is available from 2011 to 2020, but the CRI data is available from 2011 to 2019, which defines the time periods selected for the study. This study has selected the 50 most climate-affected countries (based on the average CRI value of the past 10 years). After adjusting for the data availability of dependent and independent variables discussed in Table 1, the countries are reduced to 19. Figure 4 compares the SPI and CPI for these 19 countries.
Variables
| Variable name | Symbols | Brief definition | Source |
|---|---|---|---|
| Social Progress Index | SPI | Three main components: Basic human needs, Foundation of well-being and Opportunity to progress | https://www.socialprogress.org/ |
| Climate Risk Index | CRI | Based on Fatalities, Income loss (PPP), Fatalities per million and Loss as a % of GDP | https://germanwatch.org/en |
| Renewable Energy | RE | Renewable energy (Exajoule) as a percentage of primary energy consumption | British Petroleum https://www.bp.com/ |
| High Tech Export | Tech | High tech export as a percentage of Service Export | WDI, The World Bank |
| Institutions | GI | Index of six governance indicators by WGI discussed in Section 3.3 | WGI, The World Bank |
3.2 Functional form and estimation model
The relationship between climate and social progress is analyzed using the following functional form.
In equation (1), the estimates of intercept and slope parameters β’s are assessed for i (19 countries) and t (10 time periods at most), allowing for the data to be unbalanced, having independently and identically distributed residuals. Table 1 shows the summary of all variables in the study, their definitions and sources. Social development is the dependent variable measured using “SPI,” while others are independent variables. Climate risk is assessed using “CRI,” while renewable energy “RE” and high tech exports “Tech,” which are moderators and institutional quality “GI” is the control variable.
Equation (1) includes the data varying across i and t, which require estimation using panel data methods. Empirical studies have focused on simple panel data models like Fixed or Random effect models, which lack robustness to issues like heteroskedasticity and normality. Three estimation techniques are used in the study to check the robustness and consistency of the results, namely:
Quantile Regression Analysis (QReg);
BSQReg (Koenker, 2005); and
Feasible Generalized Least Square (FGLS). (Greene, 2018)
The quantile regression method can estimate slope coefficients for the data having outliers and skewness (Arshed et al., 2022), further bootstrapping provides consistent standard errors of estimates and the FGLS regression method provides robust estimates against heteroskedasticity and autocorrelation (Ahmad et al., 2022). Both of these estimates are transformed into panel data using Least Square Dummy Variable method to cater to unobserved heterogeneity. Conclusively, this study shows robust estimates of two different forms of heteroskedasticity and normality of data.
3.3 Formulation of the institution index
The data of SPI and CRI are readily available, but the authors developed the institution index from the six different dimensions of institutions in the Worldwide Governance Indicators (WGI). The dimensions are voice and accountability, rule of law, political stability, regulatory quality, government effectiveness and control of corruption. Using the Principle Axis Factoring method, the index is developed in SPSS, and the Kaiser-Meyer-Olkin test value is 0.897, which shows that the sample is adequately dependent on each other. Barlett’s test is significant, indicating the sphericity among the variables used to form the index. The total variance of the index generated in factor analysis indicates that it can explain 84.35% of the information, which all six items could explain. Several studies, like Carballo (2010), Kline (2014), Siddique et al. (2016) and Hassan et al. (2020), have used this method to form an institutional quality/governance index.
3.4 Descriptive statistics
Table 2 indicates the measure of the center, dispersion and distribution of the selected variables. Because the study has used unbalanced panel data, the number of observations before regression may differ in each variable, but regression selects the least common observations, which is 153. Based on Jarque Bera Test, other than CRI, all variables are not normal, even though the data can be assumed asymptotically normal according to the central limit theorem. The presence of kurtosis necessitates quantile regression, which uses the median as a representative intercept and slope point estimate.
Univariate properties of variables
| Var. | Obs. | SD | Mean | Min | Max | Prob. (Kurtosis) | Prob. (Skewness) | Jarque Bera Prob>χ2 |
|---|---|---|---|---|---|---|---|---|
| SPI | 164 | 13.18 | 77.47 | 46.27 | 91.52 | 0.44 | 0.00* | 0.0005* |
| CRI | 164 | 23.58 | 49.64 | 2.50 | 109.50 | 0.33 | 0.13 | 0.1961 |
| RE | 164 | 4.40 | 5.06 | 0.001 | 16.98 | 0.98 | 0.00* | 0.0003* |
| Tech | 164 | 10.34 | 12.39 | 0.19 | 62.25 | 0.00* | 0.00* | 0.0000* |
| GI | 153 | 0.82 | 0.60 | −1.07 | 1.72 | 0.00* | 0.15 | 0.0000* |
*Significant at 1%
3.5 Linear association analysis
The quantified values of linear association between the dependent variable SPI and independent variables are shown in Table 3. Here, we can see an increase in risk, renewable energy proportion, technology and institutional quality are directly associated with the SPI in the selected countries and time periods. Though having a positive association does not necessitate a positive relation (Gujarati, 2022), it only tells the relevancy of the selected variable in explaining the changes in the SPI.
Quantitative correlation matrix
| Var. | SPI | CRI | RE | Tech | GI |
|---|---|---|---|---|---|
| SPI | 1.0000 | ||||
| CRI | 0.3422 | 1.0000 | |||
| RE | 0.5582 | 0.2021 | 1.0000 | ||
| Tech | 0.3793 | 0.0096 | 0.0150 | 1.0000 | |
| GI | 0.8960 | 0.2383 | 0.5019 | 0.4375 | 1.0000 |
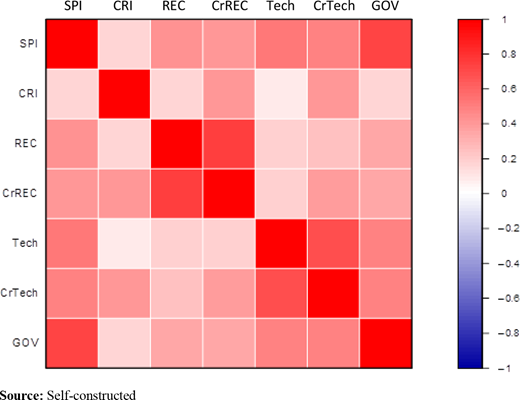
Figure 5 provides the visualized version of the linear association, including the cross-products introduced for moderators such as CrREC, which is CRI*REC and Climate Risk and Technology (CrTECH), which is CRI*TECH. It also confirms the positive association among the variables.
3.6 Multicollinearity diagnostics and criterions
Table 4 assesses the presence of multicollinearity among the explanatory variables. The results provide pairwise variance inflation factor (VIF) and overall VIF because they are less than 10, indicating no multicollinearity problem (Arshed, 2020; Gujarati, 2022) among the independent variables.
Variance inflation factor (VIF) matrix
| Vars. | CRI | RE | CrRE | Tech | CrTech | GI | VIF | 1/VIF |
|---|---|---|---|---|---|---|---|---|
| CRI | – | 9.58 | 0.104422 | |||||
| RE | 1.042584 | – | 7.72 | 0.129595 | ||||
| CrRE | 1.435958 | 3.837711 | – | 7.12 | 0.140460 | |||
| Tech | 1.000092 | 1.000225 | 1.005153 | – | 4.52 | 0.221285 | ||
| CrTech | 1.402264 | 1.000534 | 1.026645 | 2.187582 | – | 4.27 | 0.234233 | |
| GI | 1.060206 | 1.336726 | 1.235513 | 1.236715 | 1.3805 | – | 2.20 | 0.453595 |
| Mean VIF | 5.90 | |||||||
3.7 Estimation and discussion
Table 5 provides the regression estimates. The FGLS model showed that selected independent variables explain 84% variation in the dependent variable, and the significant probability value shows that the overall model is a fit. The intercept is significant, ranging from 59 to 65, showing that other excluded factors contribute to the increase in SPI.
Regression estimates
| FGLS Regression | FGLS Hetero. Robust | Quantile Req | BootStrap QReg | |||||
|---|---|---|---|---|---|---|---|---|
| Model | R2 = 0.84 | p = 0.00 | p = 0.000 | |||||
| Coef. | Prob. | Coef. | Prob. | Coef. | Prob. | Coef. | Prob. | |
| CRI | −0.18 | 0.00 | −0.10 | 0.00 | −0.27 | 0.00 | −0.27 | 0.00 |
| RE | 1.03 | 0.00 | 0.56 | 0.00 | 0.83 | 0.02 | 0.83 | 0.01 |
| CrRE | 0.01 | 0.01 | 0.01 | 0.02 | 0.06 | 0.01 | 0.06 | 0.00 |
| Tech | 0.15 | 0.11 | 0.11 | 0.04 | 0.32 | 0.01 | 0.32 | 0.04 |
| CrTech | 0.004 | 0.09 | 0.00 | 0.00 | 0.01 | 0.00 | 0.01 | 0.00 |
| GI | 13.11 | 0.00 | 13.24 | 0.00 | 13.48 | 0.00 | 13.48 | 0.00 |
| _Const | 59.84 | 0.00 | 65.01 | 0.00 | 59.03 | 0.00 | 59.03 | 0.00 |
Comparing the effects of climate risk, it can be seen that climate risk negatively and significantly impacts social progress in all four estimation techniques. A 1 unit increase in climate risk decreases social progress by 0.2 units in FGLS estimates, by 0.1 units in FGLS robust regression and by 0.27 units in Quantile and Quantile Bootstrap regression. Climate may impact social progress by directly affecting human life, resources, crops, damage to infrastructure, heat stress, peace, etc. The results of the study are consistent with the scholars like O'Riordan and d’Arge (1979), Schelling (1992), Edmonds 1996, Fankhauser and Tol (2005), Hallegatte (2005); Dell et al. (2014); Eboli et al. (2010); Barrios et al. (2010); Bretschger and Valente (2011), Lemoine and Kapnick (2016) and Javaid et al. (2022) but not consistent with the scholars like Masters and McMillan (2001) and Burke et al. (2015).
Following the independent variables in Table 5, renewable energy consumption positively and significantly impacts social progress. However, the degree of impact varies in different estimation models. For the 1% increase in renewable energy, simple FGLS regression shows that the positive impact would be 1.02 units, quantile and quantile robust regression show the impact to be 0.83 units and FGLS robust indicates that the impact is 0.55 units. Renewable energy is preferred over nonrenewable because later is dangerous for the environment and people’s health, so renewable energy is desirable. The results generated by the study are similar to outcomes by Barber (1956), Wilkinson et al. (1982), Roberts and Grimes (1997), Cottrell (2009), Sathaye et al. (2011), Colombo et al. (2013), Papanelopoulou and Nieto-Galan (2016), Sen and Ganguly (2017), Gámez et al. (2017), Hanif et al. (2020), Sial et al. (2022) and Wang et al. (2022) that increase in renewable energy reduces the global warming, and it promotes positive implications for social development.
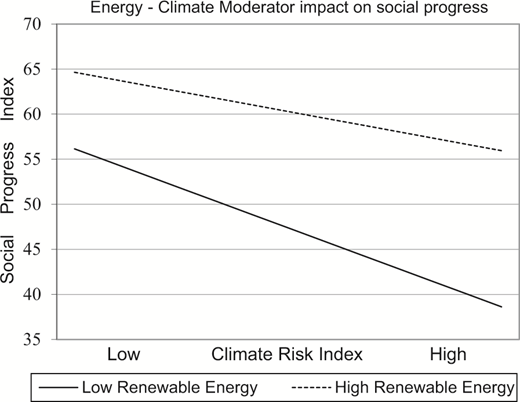
The moderation effect highlighted that increased renewable energy mitigates the negative effect of climate change risks (similar to Dai et al., 2022). CrRE has a positive sign in all four estimations. The simultaneous impact of the renewable energy and climate risk is 0.006 units in the case of Quantile and Quantiel Bootstrap regression, 0.013 units in the case of FGLS and 0.016 units in FGLS robust regression. This means that a 1 unit increase in renewable energy reduces the negative effect of climate change risk at all points. Figure 6 indicates that the increase in renewable energy shifts and reduces the slope of climate risk and social progress curve.
High-tech exports are the outcome of all technological advancement so they can be used as the best possible and outcome-based proxy for technological innovation in the country. This study indicates a positive and significant impact on social development in three estimations and an insignificant positive in simple FGLS regression. The impact of 1 unit increase in technology is 0.1 units in FGLS robust, 0.32 units in the case of quantile and BSQReg. A study by Hanif et al. (2020), Wang et al. (2021), Arshed et al. (2021b) and Salem et al. (2021) showed that an increase in technological innovation leads to environmental sustainability, which is one of the components of SPI.
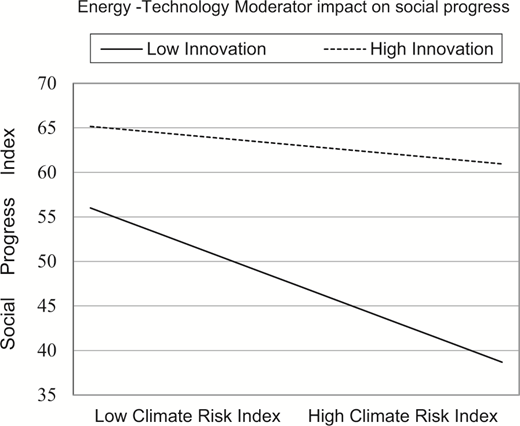
Technology can act as a moderator to mitigate the adverse impact of climate change, as discussed by Calvin et al. (2012). A simultaneous increase in CrTech, a technology moderator, shows that the impact is significant and positive in all four estimations. A 1 unit increase in technology moderator increases the social progress by 0.003 units in case of FGLS regression, by 0.0095 units in case of quantile and BSQReg and 0.0034 units in case of FGLS robust estimation against an increase in climate change risk. This increase in technological innovation helps mitigate the adverse effects of climate change. Figure 7 plots the shift and rotation of the climate risk and social progress curve because of technological changes. The study results are similar to the outcomes of Mishra et al. (2014).
Finally, improvement in institutional quality has a positive and significant impact on social progress in all four estimations. A 1 unit increase in GI increases social progress by approximately 13 units in all four estimation techniques. A study by Abduqayumov et al. (2020), Hassan et al. (2020) and Arshed et al. (2021b) showed the contribution of all six forms of institutional quality to the social development of the country.
Hence, the results point out that countries which have high climate change risk would tend to face a deterring effect on their social development. According to the study, renewable energy and technological innovations can successfully abate social and environmental sustainability against extreme climate change events.
4. Conclusion and policy implication
The main contribution of this study is to explore the mitigating effects of climate risk in high-climate-risk countries. Climate risk was generated from human activities costing the national exchequer, and now most of the climate change is irreversible, and its effects remain, but we can improve the social resilience against climate change. The suitability assessment of social resilience motivating factors uses the moderator model in the climate change risk and SPI model. This study has proposed renewable energy and technological innovation as policy options.
This study first confirms that climate risk has a negative and significant impact on the social progress of a country. This conclusion is consistent in all four robust estimation techniques used. The moderator specification is used in the estimation to assess the climate change mitigating effects. The direct and moderating impact of technology and renewable energy is positive and significant across all regression models. This study has confirmed that renewable energy and technological innovation can mitigate the harmful and social-development-detrimental effects of climate risk. The quality of institutions as a controlling factor also significantly improves the SPI. Figures 6 and 7 highlight that the mitigation techniques can increase social sustainability against climate change.
Hence, this study urges policymakers to act on the following suggestions. The government should improve institutional quality by targeting the six dimensions of WGIs. Better institutions can regulate markets and human behaviors to reduce climate-altering activities, which later help ensure sustainability. In addition, society should transit toward renewable energy, and businesses should resort to innovation and technology to develop net-zero-carbon processes and climate change-resilient supply chains and infrastructure. All these actions play an important role in social progress and living standards. Both of these policy options successfully reduce the harmful effect of climate change risk on social development.
Future studies could explore the role of different types of technology development on social development and investigate what type of technology matters when countries focus on renewable energy infrastructure of high climate risk countries.
Expression of Concern: The publisher of International Journal of Climate Change Strategies and Management is issuing an Expression of Concern for the following article, Xiaobing Huang, Yousaf Ali Khan, Noman Arshed, Sultan Salem, Muhammad Ghulam Shabeer, Uzma Hanif; Increasing social resilience against climate change risks: a case of extreme climate affected countries. International Journal of Climate Change Strategies and Management 19 April 2023; 15 (3): 412-431. https://doi.org/10.1108/IJCCSM-04-2022-0051. An investigation by the publisher found evidence of an undisclosed conflict of interest and that the peer review process had been partially compromised; the publisher can confirm, however, that the article received additional multiple independent reviews. The article also features an excessive number of self-citations that cannot be justified, despite their alignment with the subject; as part of the investigation, the authors were requested to provide an explanation in accordance with HYPERLINK "https://www.emeraldgrouppublishing.com/publish-with-us/ethics-integrity/research-publishing-ethics#citation-manipulation" Emerald's policy on citation manipulation. The authors cooperated with this investigation but failed to provide a satisfactory explanation. As a result of these concerns and as trust in the content is central to the integrity of the publication process, the publisher has taken the decision to publish an Expression of Concern. The publisher of the journal sincerely apologizes to the readers of this article.
Funding: This research was supported by The National Natural Science Foundation of China (Grant No.71663003).
Conflicts of interest/Competing interests: The author declares no competing interest.
Availability of data and material: All results reported in this research are carried out in R statistical environment. The details about data sources are mentioned in Table 1 of the manuscript.
Ethics approval: Not applicable.
Consent to participate: Not applicable.
Consent for publication: All authors have provided their consent to publish this manuscript if accepted by the journal.

