


– The purpose of this study is to examine the biophysical and socioeconomic impacts of climate change on maize production and food security in sub-Saharan Africa (SSA) using adapted improved maize varieties and well-calibrated and validated bioeconomic models.
– Using the past climate (1950-2000) as a baseline, the study estimated the biophysical impacts of climate change in 2050 (2040-2069) and 2080 (2070-2099) under the A1B emission scenario and three nitrogen levels, and the socioeconomic impacts in 2050.
– Climate change will affect maize yields across SSA in 2050 and 2080, and the extent of the impact at a given period will vary considerably between input levels, regions and maize mega environments (MMEs). Greater relative yield reductions may occur under medium and high-input intensification than under low intensification, in Western and Southern Africa than in Eastern and Central Africa and in lowland and dry mid-altitude than in highland and wet mid-altitude MMEs. Climate change may worsen food insecurity in SSA in 2050 through its negative impact on maize consumption and reduction in daily calorie intake. However, international trade has the potential to offset some of the negative impacts.
– The study calibrated and applied bioeconomic models to estimate the biophysical and socioeconomic impact of climate change on maize production at fine resolution. The results could be used as a baseline to evaluate measures that will be applied to adapt maize to the future climate in SSA.
1. Introduction
Maize is the most widely cultivated crop and one of the few crops that have profound effects on the livelihoods of people in sub-Saharan Africa (SSA). Over half of the countries in SSA allocate over 50 per cent of their cereal area to maize production (FAOSTAT, 2010). Maize accounts for almost half of the calories and protein consumed in Eastern and Southern Africa (ESA) and one-fifth of calories and protein consumed in West Africa (Shiferaw et al., 2011). Despite the importance of maize in SSA, current production is not sufficient in most countries and yields remain among the lowest in the world (Ray et al., 2012) because of an array of biophysical and socioeconomic constraints (Shiferaw et al., 2011). With the population of SSA likely to double by 2050 (PRB, 2013), maize production is facing a formidable challenge from worsening soil degradation and low soil fertility, drought, increasing pressure of pests, diseases and weeds, and increasing and changing consumer demand (Shiferaw et al., 2011). Climate change will add further challenges to maize production in SSA, undermining efforts being made to enhance food security and reduce poverty in the region (IPCC, 2007).
Projected changes in precipitation during the maize growing season in SSA vary greatly (IPCC, 2007), although the direction and magnitude of change vary with location in maize-growing regions (Cairns et al., 2013). Temperatures are likely to increase throughout SSA by 2050, and maximum temperatures within maize-growing areas of SSA could increase by 2.1-3.6°C by 2050 (Cairns et al., 2012). Although it is usually considered a warm season crop, maize seems to be more sensitive to high temperature stress than other cereals. For example, a study in Tanzania indicated a higher reduction of maize yield (13 per cent) than that of sorghum (8.8 per cent) and rice (7.6 per cent) in 2050s due to a projected seasonal temperature increase of 2°C (Rowhani et al., 2011).
Adapting the agricultural systems of SSA to climate change is critical for ensuring food security for its growing population. Identifying hotspots of climate change and understanding associated socioeconomic impacts at different spatial scales are important steps toward designing and implementing appropriate adaptation measures. In recent years, spatial crop modeling has received increasing attention and has been used to assess the impacts of climate change at both global (Parry et al., 1999) and regional or national levels (Jagtap and Jones, 2002; Jones and Thornton, 2003; Reilly et al., 2003; Wang et al., 2011; Xiong et al., 2007). Fine resolution spatial simulations are important to provide insights into the impact of climate change at the local level and to identify regions that are highly vulnerable to climate change (Wang et al., 2011).
However, the credibility of outputs of crop models depends on their calibration and evaluation within target environments (Timsina and Humphreys, 2006; Xiong et al., 2008). Thus, calibration of models using widely adapted benchmark varieties (improved varieties that grow at a wider spatial scale) is crucial to link model outputs to real world adaptation options and to facilitate their use in understanding the impacts of climate change (Challinor et al., 2009). Over- or under-estimation of model outputs may result when models are used in environments for which they are not calibrated. Poor model performance may arise from the use of models calibrated for high-yielding cultivars which do not reflect varieties usually grown in low-yielding regions such as Africa (Folberth et al., 2012). Crop models are usually calibrated and evaluated using measured yield trial data from field plots for field-level applications. However, it is not always appropriate to extrapolate field-level model evaluations to large-scale conditions; hence, the evaluation of models at a higher scale is also important to avoid the problem of extrapolating results from a plot level to a regional level in spatial modeling. For example, Folberth et al. (2012) improved the performance of a geographic information system (GIS)-based Environmental Policy Integrated Climate (EPIC) model by adjusting model parameters at a regional level to suit the low-input maize production system in SSA. In general, judicious model choice and calibration are crucial for reliable model outputs (Challinor et al., 2009).
Studies that have applied spatial crop models for climate change analysis in SSA used generic cultivars and crop management (Jones and Thornton, 2003; Liu et al., 2008; Thornton et al., 2011; Waha et al., 2013), and in many cases, past assessments of climate change impacts do not provide a thorough validation of the models used. Moreover, previous spatial climate change modeling studies in SSA neither used maize varieties adapted to the region nor assessed the economic impacts of climate change using integrated bioeconomic models. Therefore, the purposes of this study were to calibrate and evaluate the cropping system model–crop estimation through resource and environment synthesis (cropping systems model-crop estimation through resource and environment synthesis [CSM–CERES]–maize model using field trial data of widely adapted benchmark maize varieties in six maize mega environments (MMEs), and to assess the potential biophysical and socioeconomic impacts of climate change on maize production at different spatial scales in SSA.
2. Methodology
A geospatial bioeconomic modeling framework that integrates biophysical and economic models (Robertson et al., 2012) was used to assess the impact of climate change on maize production in SSA.
2.1 Biophysical modeling
2.1.1 Model description.
The cropping system model (CSM) used for this study was crop estimation through resource and environment synthesis, CERES–maize (Jones and Kiniry, 1986), which is embedded in the Decision Support System for Agrotechnology Transfer (DSSAT), Version 4.5 (Hoogenboom et al., 2010). CERES–maize is a process-based, management-oriented model that utilizes water, carbon, nitrogen and energy balance principles to simulate the growth and development of maize plants within an agricultural system. The model runs with a daily time step and simulates crop growth, development and yield of specific cultivars based on the effects of weather, soil characteristics and crop management practices (Jones et al., 2003).
2.2 Genetic and environmental data for model calibration and evaluation at field level
The maize breeding program in the International Maize and Wheat Improvement Center (CIMMYT) is organized based on the concept of mega environments, which are areas with broadly similar environmental characteristics for maize production (Banziger et al., 2006). Within SSA, there are six MMEs: highland, dry lowland, dry mid-altitude, wet lowland, wet lower mid-altitude and wet upper mid-altitude (Bellon et al., 2005). Five benchmark maize varieties (BH660, SC403, SC513, WH403 and ZM521), which together cover all MMEs within SSA, were selected for the study (Table I). These varieties also represent three different maturity groups (early, medium and late maturing) and are hybrids with the exception of ZM521 which is an open-pollinated variety. As compared to land races or local cultivars, these are improved varieties developed through rigorous breeding and have a combination of desired traits such as high grain yield and resistance to diseases and pests.
Data on crop phenology, yield and crop management (including planting date, plant density, fertilization and irrigation) of maize were obtained from the regional trials database of CIMMYT in ESA, particularly in Ethiopia, Kenya and Zimbabwe. Soil profile data of experimental stations were obtained from several sources, including field measurements, country-level secondary sources (Abebe, 1998; Nyamapfene, 1991) and the World Inventory of Soil Emission (WISE) database (Batjes, 2009). Daily rainfall, maximum and minimum temperature and radiation data of the experimental stations were obtained from national meteorology service offices of the respective countries and other secondary sources. Whenever radiation data were missing or became unavailable, estimated data provided by National Aeronautics and Space Administration-Prediction Of Worldwide Energy Resource (NASA-POWER) (http://power.larc.nasa.gov/) were used.
2.3 Data for spatial crop modeling
2.3.1 Maize area.
To simulate maize yield at the continental level, SSA was divided into square pixels (grid cells) with a square length of 5 arc-minutes (≈10 km at the equator), and each pixel was considered as a field. The spatial allocation model raster map for maize (You and Wood, 2006) was used to select maize-growing areas of SSA using the Geographic Resources Analysis Support System (GRASS) software (http://grass.osgeo.org/).
2.3.2 Soil data.
For each grid cell, soil inputs to the model were obtained from a set of 27 generic soil profiles (HC27) developed by blending and interpreting information from both the Harmonized World Soil Database (HWSD) (Food and Agriculture Organization of the United Nations (FAO)/International Institute for Applied Systems Analysis (IIASA)/International Soil Reference and Information Centre (ISRIC)/Institute of Soil Science, Chinese Academy of Sciences (ISSCAS)/Joint Research Centre of the European Commission (JRC), 2008) and the WISE database (Batjes, 2009) based on texture, rooting depth and organic carbon content. Simulations were run for all soils in each grid cell, and the cell-specific output was computed from the area-weighted average based on the area share of each soil in the grid cell.
2.3.3 Climate data.
Climate data for each simulation grid cell were obtained from the FutureClim-gridded dataset (Jones et al., 2010), which provided all the required climatic elements needed by the stochastic daily weather generator in DSSAT. The weather generator provides daily weather consistent with the monthly averages supplied to it from the FutureClim data. The baseline climate used for the study was that of the years from 1950 to 2000 (Hijmans et al., 2005). Projected climate data for 2050 (2040-2069) and 2080 (2070-2099) were taken from CSIRO-Mk3.0 (CSIRO) and MIROC 3.2 (MIROC) general circulation models (GCMs) for the “A1B” greenhouse gas emissions scenario. The two GCMs were selected because the CSIRO–A1B scenario represents a drier and relatively cooler future while the MIROC–A1B scenario represents a wetter and warmer future compared with other GCMs (Nelson et al., 2010; Robertson et al., 2012).
Because of the uncertainties associated with modeling CO2 fertilization effects on the yield of C4 crops such as maize (Challinor et al., 2009) and the need to account for the level of yield attained in farmers’ fields in Africa (Nelson et al., 2010; Waha et al., 2013), the CO2 level used in this study was kept at 369 ppm throughout.
2.3.4 Planting and crop management.
A rule-based automatic planting (70 per cent soil moisture within 30-cm soil depth, monthly maximum temperature < 50°C and minimum temperature > 7°C within a 135 days [d] planting window) was used to determine area-specific sowing date of maize varieties. To avoid false planting triggers within areas of short rains, additional simulations were made by shifting the planting period by one month forward and backward and reporting the best yield from among the three plantings. BH660 was sown at a plant population of 4.44 plants m−2, while the rest of the varieties were sown at 5.33 plants m−2 in their respective adaptation MMEs. As smallholder farmers in SSA generally use crop residues from previous harvests as animal feed (de Groote et al., 2013), only 200 kg ha−1 crop residue was used as initial residue input to the model. All varieties were simulated with three levels of N application (0, 46 and 92 kg N ha−1) to represent the different levels of input application in SSA and to see the effect of different levels of input application on maize yield under climate change.
2.4 Model calibration and evaluation
The CSM–CERES–maize model requires six genetic coefficients which govern the life cycle and reproductive growth of maize cultivars (Table II). A stepwise iterative calibration procedure was followed whereby genetic coefficients which determine anthesis and physiological maturity dates (P1, P2 and P5) were adjusted in the first stage of the process, followed by those coefficients which affect yield (G2 and G3). Rooting profile and soil fertility factor were also adjusted together with G2 and G3 whenever necessary. Default coefficients provided in DSSAT4.5 for a medium maturing maize cultivar were used as initial values for the calibration. Coefficients were accepted as final when simulated values closely matched with the measured ones. Model evaluation was made using an independent dataset (up to 86 variety-site-years). The agreement between simulated and measured values during calibration and evaluation was assessed using root mean square error (RMSE), relative root mean square error (RRMSE) and index of agreement (d-index) (Willmott, 1982), which are calculated using the following equations: Equation 1 Equation 2 Equation 3
Where Si is simulated value for the ith observation, Oi is measured value for the ith observation, Ō is mean of the measured values and n is the number of observations.
2.5 Calculation of changes
The biophysical impact of climate change at different spatial scales was estimated by calculating changes of biophysical parameters between the baseline and the future climate scenarios. The changes in 2050 and 2080 were calculated relative to the baseline year (2000) for the respective years and treatments as follows: Equation 4
Where ΔY is change of a parameter, Yfi is value of the parameter under future climate i and Yb is value of the parameter under the baseline climate.
Maize production at a national level was obtained by summing up grid cell values within the cultivated maize area of a given country, and average national maize yield was calculated as the ratio of total national maize production to total maize area using GRASS GIS. The simulated baseline yields at a national level were compared with the national level average yields reported by FAO (FAOSTAT, 2010) for 37 SSA countries that grow maize under rainfed conditions to evaluate the performance of the CERES–maize model at higher spatial scale.
2.6 Economic modeling framework
For the assessment of the socioeconomic impact of climate change, additional global maize production simulations were conducted using the calibrated CERES–maize model for the baseline (2000) and 2050 (the period when economic projections are assumed to remain valid). These simulations used the CSIRO and MIROC GCMs and A1B emission scenario with global-gridded nitrogen fertilizer application rates based on FAO estimates. Changes in crop productivity under climate change were used within the International Model for Policy Analysis of Agricultural Commodities and Trade (IMPACT) to estimate socioeconomic welfare impacts of climate change on SSA by the 2050s. IMPACT is a multi-market, multi-country partial equilibrium model that uses various assumptions on production, consumption and trade patterns to project national and global food and nutrition security under alternative scenarios of population growth, income growth and future climates (Rosegrant, 2012).
Assessing the impact of climate change on food security in 2050 should consider future changes in the world economy, as some of the middle-income countries of today could join the rank of high-income countries by 2050. Hence, IMPACT uses three socioeconomic scenarios (base, optimistic and pessimistic)[1], which vary in population and GDP growth rates between 2000 and 2050. In this study, the base socioeconomic scenario combined with three climate scenarios was used to develop three bioeconomic scenarios. These are “2050-baseline”, which reflects the status of global food security in 2050, assuming moderate growth in per capita income worldwide between 2000 and 2050 and halting of the momentum of climate change in the 2000s such that the climate in the 2050s is the same as that of 2000; “CSIRO–A1B” scenario, which combines assumed moderate per capita income growth globally with a climate projected by CSIRO under A1B emission scenario by 2050; and “MIROC–A1B” climate scenario, which combines assumed moderate per capita income growth globally with a climate projected by MIROC under A1B emission scenario by 2050. In all scenarios, farming practices including the use of improved varieties and fertilizer applications rates were assumed to remain unchanged between 2000 and 2050 from the present level worldwide. Thus, socioeconomic changes in 2050 due to CSIRO–A1B and MIROC–A1B scenarios were expressed relative to the 2050-baseline socioeconomic scenario.
3. Results
3.1 Model calibration and evaluation
A comparison of measured and simulated days to anthesis and maturity of all the varieties, for both the calibration and evaluation dataset, showed good agreement between the measured and simulated values [Figure 1(a)], indicating that the five benchmark varieties were accurately represented by the calibrated genetic coefficients (Table II). In the calibration dataset, the RMSE for days to anthesis and maturity for the five varieties ranged from 3.3 to 5.7 d and 3.2 to 13.0 d, respectively. For the combined dataset, RMSE averaged 4.5 d for anthesis and 6.5 d for maturity (Table III). In the evaluation dataset, the RMSE ranged from 1.3 to 11 d for anthesis and from 1 to 7.3 d for maturity, averaging 4.1 and 4.8 d using the combined dataset, respectively. For both anthesis and maturity, the RRMSE values were < 10 per cent and the d-index values were > 0.90 in the calibration and evaluation datasets (Table III), indicating very good performance of the model in simulating the anthesis and maturity periods of the benchmark maize varieties.
Measured and simulated yields for the combined dataset in the calibration and evaluation datasets are shown in Figure 1(b); the comparison statistics are given in Table III. The RMSE for grain yield ranged from 0.4 to 1.5 t ha−1 and averaged 1.3 t ha−1 across variety-site-years in the calibration dataset. It also ranged from 0.7 to 1.6 t ha−1 among the varieties, averaging 1.1 t ha−1 for the whole evaluation dataset. The average simulated yield of the benchmark varieties across all site-years was closely related to measured grain yield [Figure 1(b)], with a d-index of 0.88 and a RRMSE value of less than 18 per cent in both the calibration and evaluation datasets (Table III). This indicates that the CSM–CERES–maize model has captured the response of the different maize varieties across environments.
A comparison of simulated and FAO reported national yield is presented in Figure 1(c). Although the model had a tendency to over-estimate national average maize yields for most countries, the RMSE value of 0.64 t ha−1 and d-index of 0.63 suggested general agreements between simulated and FAO-reported maize yields.
3.2 Biophysical impacts of climate change
3.2.1 Changes in potential maize cultivation area.
While the overall change in land area suitable for maize cultivation by 2050 could be small (0.6-0.8 per cent) in SSA, this figure masks regional variation [Figures 2(a and b) and 3(a and b)]. In Central and Western Africa, the maize cultivation area could be reduced by 1.3 per cent, while in ESA, it may increase by 1.3-2.5 per cent by 2050. In 2080, the cultivation area of maize could potentially increase by 0.2-2.3 per cent in SSA, mainly due to increasing areas within the ESA region, while suitable areas within Central and Western Africa may decrease by 1.2-1.4 per cent. SSA countries bordering the Sahara desert and the coastal areas of Angola may lose current areas suitable for maize production due to climate change [Figures 2(a and b) and 3(a and b)]. In order of increasing loss percentage, the countries that may experience greater reduction in maize area by 2050 and 2080 are Senegal, Sudan, Burkina Faso, Angola, Mali, Botswana, Chad, Niger and Mauritania. On the other hand, Tanzania, Uganda, Ethiopia, Kenya, Rwanda, Eritrea and Lesotho may see an increase in potential maize production area in that order.
3.2.2 Changes in maize yields.
The outputs of CERES–maize indicated large spatial variation in maize yields under projected climate in 2050 and 2080 across SSA [Figures 2(a and b) and 3(a and b)]. Depending on N level, 51-59 per cent of current maize growing areas in SSA may experience yield reduction ranging between 5 and 25 per cent by 2050, while yield change may remain within ± 5 per cent in 21-35 per cent of the areas. In up to 10 per cent of current maize areas (particularly in Western and Southern Africa and the Sahel), yields could reduce by more than 25 per cent, whereas yields may increase by up to 25 per cent in approximately 10 per cent of current maize growing areas (most in Central and Eastern Africa) in 2050.
Maize yields are likely to further decline in large areas of SSA by 2080 [Figures 2(a and b) and 3(a and b)]. Depending on the level of N application, maize yields in 10-30 per cent of the areas (largely located within Western and Southern Africa) will be reduced by more than 25 per cent compared to the baseline. Almost two-thirds of maize growing areas within SSA will experience a yield reduction of between 5 and 25 per cent. In contrast, only 20 per cent of current maize production areas will maintain current yields (within ± 5 per cent changes) by 2080. Yields will increase in up to 8 per cent of current maize areas by 5-25 per cent by 2080, while yields have the potential to increase by over 25 in 2 per cent of the areas. The majority of yield gains will be in the highlands of Tanzania, Kenya, Northern Democratic Republic of Congo, Uganda, Ethiopia and Eritrea [Figures 2(a and b) and 3(a and b)].
Regional aggregation indicates that yields will decline by 6-12 per cent in 2050 and 9-20 per cent in 2080 within the SSA region, depending on the level of input supply and GCM projections (Figure 4). The majority of reductions in maize yields by 2050 and 2080 will occur within Western and Southern Africa (Figure 4). Depending on the level of input use and GCM projections, Western Africa will experience a reduction of maize yield by 11-21 per cent in 2050 and 17-33 per cent in the 2080s, while yields in Southern Africa will decrease by 5-12 per cent and 7-22 per cent by 2050 and 2080, respectively (Figure 4). In contrast, the reduction in maize yields will be relatively small in the Eastern and Central Africa region (3-9 per cent by 2050 and 3-16 per cent by 2080). The largest reductions in maize yields under climate change (loss > 10 per cent in 2050s and > 20 per cent in 2080s) will be in Angola, Benin, Botswana, Burkina Faso, Central African Republic, Chad, Cote d’Ivoire, Gambia, Equatorial Guinea, Ghana, Guinea, Guinea-Bissau, Liberia, Madagascar, Mali, Mauritius, Mozambique, Namibia, Niger, Nigeria, Senegal, Sierra Leone, South Africa, Sudan, Swaziland, Togo and Zimbabwe. In contrast, countries that will experience either a small reduction, or an increase in yields, include Ethiopia, Eritrea, Kenya, Rwanda and Uganda.
Although maize yields will be negatively affected by climate change by 2050 across MMEs, the greatest reduction will be within the dry and wet lowland MMEs (Figure 5). In addition to a further decrease in maize production by up to 25 per cent in the dry and wet lowland MMEs, the wet lower and dry mid-altitude MMEs become additional hotspots for the impact of climate change on maize production in the 2080s. The results indicate an increase in maize yield in the highland MMEs in 2080s, whereas yield will not be affected much relative to its current level in the wet upper mid-altitude MMEs (Figure 5).
3.2.3 Yield response to nitrogen levels.
Results also indicated the differential response of maize to the different levels of N application under future climate conditions in the different regions studied (Figures 2-5). Relative to the low-input level, application of 46 and 92 kg ha−1 N would increase grain yield of maize by 235 and 377 per cent in the baseline period, 226 and 351 per cent in 2050, and 207 and 314 per cent in 2080, respectively. Although N application increases maize yield under both the baseline and future climate conditions, the response of maize to fertilizer N application is low under climate change, and the impact was higher under high than under low level of N application (Figures 2-5). Pooled over GCM projections, the reduction in maize yield from baseline was 11, 8 and 6 per cent in the 2050s and 19, 15 and 10 per cent in the 2080s under the high, medium and low N levels, respectively.
3.3 Impact of climate change on maize production, consumption and food security
Outputs from the IMPACT model indicate that, depending on GCM projections, global maize production may decrease by 40 to 140 million tonnes by 2050 due to climate change compared to the baseline scenario (Table IV). The impact of climate change on global maize production may cause supply shocks in maize markets across the globe which could affect food prices and, in turn, lead to some adjustments in food production, consumption and trade patterns worldwide. For example, maize production in the USA, the leading maize producer by 2050, is projected to decrease by 28 per cent (152 million tonnes) under the MIROC–A1B scenario which would be larger than the decrease in the rest that of the world in volume terms (Table IV). If the USA experiences a substantial decrease in its maize production, other countries including those in SSA might attempt to fill this gap by increasing their maize production (Table IV). In SSA, changes in maize production brought by climate change would range from a decrease of 4 per cent under the CSIRO–A1B scenario to an increase of 12 per cent under the MIROC–A1B scenario (Table IV). Eastern Africa is the only region that would experience an increase in maize production under climate change (Table IV).
Projected impact of climate change on maize production, trade and consumption in SSA and other selected regions in 2050 relative to the baseline scenario.
The decrease in global maize production may translate into a decrease in global maize consumption. Within SSA, climate change could lead to maize consumption decreasing by 4 to 15 per cent compared to the baseline scenario. Increased maize exports from SSA would contribute to decreasing maize consumption in the sub-continent under both future scenarios. For example, under the MIROC–A1B scenario, maize production would increase by 7.7 million tonnes in SSA, but net maize exports would increase by 25 million tonnes because countries would find it preferable to export maize. This would lead to maize consumption decreasing by 17.7 million tonnes (Table III). As maize continues to be a major food crop across SSA in 2050, the decrease in maize consumption would translate into a decrease in daily caloric intake from maize across the region. Relative reductions in caloric intake derived from maize would be the highest in Southern Africa, with values ranging between 1 and 3.6 per cent. The decrease in daily caloric intake caused by climate change is likely to worsen food insecurity across SSA, causing the number of people at risk of hunger to increase by 17 to 37 million people (Figure 6). Eastern Africa may experience the largest increase in the number of people at risk of hunger under climate change (11-30 million), followed by Central Africa (4-6 million), Western Africa (2.2-2.3 million) and Southern Africa (0.1-0.2 million) (Figure 6).
In general, caloric intake under climate change will be inversely related to the number of people at risk of hunger, and countries with lower caloric intake under climate change, such as Congo DR, may experience the largest increase in the number of people at risk of hunger (Figure 7). Under the 2050-baseline scenario, Democratic Republic of Congo, Eritrea, Burundi and Zimbabwe could have an average per capita caloric intake below 2,000 kcal by 2050. Among these four countries, Zimbabwe might experience the largest reduction in caloric intake under both GCMs, but it might not experience a higher increase in the number of people at risk of hunger compared to Democratic Republic of Congo due to its smaller population size (Figure 7).
Most of the countries that will experience the largest increase in the number of people at risk of hunger under climate change will be in Eastern Africa. In Western Africa, however, average per capita caloric intake could reach 3,000 kcal or more under the 2050-baseline scenario, and the reduction in caloric intake due to climate change would be small (less than 124 kcal). Hence, countries like Ghana, Guinea, Guinea Bissau, Ivory Coast, Mali, Mauritania, Senegal, Sierra Leone and Togo may not experience an increase in the number of people at risk of hunger under climate change (Figure 7) despite a reduction of maize yield and area in some of these countries by 2050 [Figures 2(a and b) and 3(a and b)].
In general, the countries that are likely to be major food insecurity hotspots under climate change by 2050 include Tanzania, Malawi, Zambia, Democratic Republic of Congo, Zimbabwe, Ethiopia, Mozambique, Kenya and Nigeria (Figure 7).
4. Discussion
4.1 Bioeconomic impacts of climate change on maize systems
If current crop management practices and technologies continue in the future without major adjustments, climate change will result in large spatial and temporal changes in maize area, yields and production within SSA. The major challenge in the region will be reduction of maize productivity by up to 12 per cent in 2050 and 20 per cent in 2080. This is lower than the 15 per cent maize yield reduction reported by Jones and Thornton (2003) in SSA by 2055 using the CERES–maize model. Using yield transfer functions to estimate current and future yields of maize, wheat, rice and soybean at the national level, Parry et al. (2004) also reported a yield reduction of up to 30 per cent in SSA by the 2080s compared to 1990, under all emission scenarios with no CO2 effects. When the effect of CO2 fertilization was incorporated into maize modeling, there was a general increase in maize production under the future climate scenarios (Liu et al., 2008; Ruane et al., 2011). Recent studies by Allen et al. (2011) and Chun et al. (2011) indicate an increase in water use efficiency of maize by 18 to 20 per cent under doubled CO2. However, the beneficial effect of CO2 fertilization for maize under low-input agriculture is limited (Long et al., 2006), and there are still uncertainties related to model sensitivity to CO2 concentration, which remains a significant obstacle to climate change impact assessment (Challinor et al., 2009; Ruane et al., 2011).
Based on the impact of climate change on maize yields, the maize-growing areas of SSA could be grouped into four categories: highly vulnerable (reduction > 25 per cent), moderately vulnerable (reduction 5-25 per cent), unaffected (change within ± 5 per cent) and benefited (increase > 5 per cent). Most of the highly vulnerable areas are located in Benin, Cote d’Ivoire, Ghana, Lesotho, Mozambique, Nigeria, South Sudan, Togo and Zimbabwe, while majority of the areas that benefit from yield increase are located in Ethiopia, Kenya, Rwanda, Tanzania and Uganda, which are higher-elevation regions. Crop genetic improvement, agronomy and favorable policy and social factors will play a major role in reducing current yield gaps and offsetting loses due to climate change in areas with moderate vulnerability (Jones and Thornton, 2003). However, in highly vulnerable areas, particularly in those areas such as in the Sahel (Roudier et al., 2011) and Southern Africa, where rainfall is decreasing and temperature is increasing, adaptation strategies may not be sufficient (Kates et al., 2012). In these regions, transformation strategies which involve significant changes in livelihood strategies, such as changing cropping systems, may be the most suitable strategies to offset losses due to climate change. However, as maize is a major component in the livelihood and food habits of communities living within many highly vulnerable regions, a shift in farming systems may also have implications on the socio-cultural setting of the communities.
Besides its impacts on maize productivity, climate change greatly affects the economy and food security of several countries in SSA through its impact on global maize production, trade and consumption. Climate change will reduce global maize production and increase the price of maize on the international market, prompting many countries in SSA to export their maize. Increasing maize exports could also be a result of the individual preference of countries to export maize and use the export earnings to purchase other essential products, which may also become scarce under climate change. Increases in maize export would result in a reduction of maize consumption by 2050 across SSA, leading to a decrease in daily caloric intake from maize. In turn, decreasing daily caloric intake under climate change will worsen food insecurity. The food insecurity problem will be influenced not only by the biophysical impacts of climate change but also by the rate of population increase and per capita income growth. For example, in Eastern Africa, maize production will increase by 2050, but the region will still lag behind other regions in per capita caloric intake so that the increase in the number of people at risk of hunger will be high. On the other hand, despite a reduction in maize yields and production in the region, the number of people at risk of hunger by 2050 will be low in Southern Africa because of higher per capita caloric intake from different sources. Population size also plays a role at the country level in determining the number of people who will be at risk of hunger by 2050. For instance, despite facing higher reductions in daily caloric intake under climate change, Zimbabwe will have a smaller number of people at risk of hunger due to its smaller population size. These results are similar with those of Parry et al. (2004), who estimated that, under climate change, SSA would experience an increase of about 20 million people at risk of hunger by 2050s.
The socioeconomic analysis also indicates that countries that are highly vulnerable in terms of maize yield reduction may not necessarily be food insecure by 2050. This highlights the importance of open international trade in attenuating the negative impact of climate change (Brown and Funk, 2008; Nelson et al., 2010; Parry et al., 2004). If trade barriers were incorporated into IMPACT, our estimates on the impact of climate change on food insecurity would be worse. Our study also indicates the importance of integrating biophysical and socioeconomic models in assessing the impact of climate change at different levels.
4.2 Response of maize to input supply under climate change
While yields would increase under higher levels of N application in both the baseline and projected climate change scenarios, climate change will have a greater effect in reducing yields with higher N levels. Under low-input conditions, nutrient stress is a major cause of low yields compared to both water and temperature stresses (Folberth et al., 2012); hence, yield response to climate change is very small, resulting in lower relative yield changes between the baseline and future climate than the response under high-input conditions. If nutrients are less limiting in the presence of relatively favorable climate conditions, as in the base climate used in this study, maize yields increase. However, if nutrients are less limiting in the presence of limiting climate factors, as in the future climate scenarios used in this study, yield is reduced more in response to the changes in climate compared to the baseline. These differential responses of maize yield to nutrient levels under climate change could be related to low nutrient uptake ability under conditions of erratic and unreliable rainfall, as well as the negative effects of extreme temperatures on crop growth, development and assimilate partitioning. Heat stress reduces grain yield through reduced growth duration, low light interception and reproductive failure (Barnabás et al., 2008). Lobell and Burke (2010) indicated that an increase in temperature by 2°C would result in a greater reduction in maize yields in SSA than a 20 per cent decrease in precipitation. Damage due to high temperature could also occur even under optimal nutrient management conditions (Lobell et al., 2011). Although understanding the mechanisms of maize response to high N levels under climate change may require further investigation, the current results indicate the expected challenges of increasing maize productivity under climate change, which will undermine efforts to intensify maize production systems and ensuring food security in SSA.
4.3 Importance of calibrated models for integrated climate change impact assessment
Crop models have shown considerable potential in agricultural research and development and also in the exploration of management and policy decisions (Boote et al., 1996). However, one key limitation of integrated climate change impact assessment relates to the lack of well-calibrated and validated bioeconomic models (Fischer et al., 2005; Schmidhuber and Tubiello, 2007). In this study, we calibrated the CSM–CERES–maize model at site and country level using benchmark maize varieties that are adapted to target environments within SSA. Our model calibration and evaluation results agreed with previous studies that utilized field trial data from different environments to estimate maize genetic coefficients (Gungula et al., 2003; Mavromatis et al., 2001; Yang et al., 2009). Moreover, evaluation of the CERES–maize model with the FAO-reported average national maize yield for countries that produce maize under rainfed conditions indicated acceptable performance of the model in simulating yield of maize at higher spatial scales. The CSM–CERES–maize does not simulate yield reductions due to biotic stresses; hence, the simulated yields are expected to be slightly higher than those reported by FAO. Previous studies also used FAO national level crop yield data to compare simulated yields of maize in SSA (Folberth et al., 2012; Jones and Thornton, 2003). As one of the key contributions of this study, we used an integrated assessment of climate change by incorporating maize production from a well-calibrated and validated biophysical (CERES–maize) model into the IMPACT model, which is also well-calibrated (Rosegrant, 2012), for socioeconomic analysis. This integrated assessment enabled us to identify both biophysical and socioeconomic vulnerabilities in SSA.
5. Conclusion
Although climate change is a global phenomenon, its impacts could vary at different spatial and temporal scales. Improved understanding of the potential impacts of climate change on maize yield and production at different spatial and temporal scales in SSA is critical to planning appropriate adaptation options and timely responses. The results of this study indicate that maize production and food security in many African countries and regions are likely to be severely affected by climate change, albeit the projected impacts vary across countries and regions in SSA. At the aggregate level, SSA will experience a yield reduction of up to 12 per cent in the 2050s and 20 per cent in the 2080s. Similarly, the socioeconomic model estimates showed a change of −4 to 12 per cent in production for SSA by 2050, indicating compensating changes in response to increases in prices and trade that may require increased allocation of land to maize to minimize a fall in production. Increasing temperature combined with decreasing precipitation will have a major negative impact in areas located in the Sahel and Southern Africa, whereas small changes in precipitation with increasing temperatures may have a positive effect on maize yield in the highland areas of Eastern Africa. Climate change will limit the yield response of maize to fertilizer application in poor weather seasons, making input-based intensification less dependable, despite being the primary solution to increase maize production in SSA under climate change. The economic welfare and food security-related impacts of climate change estimated using the economic model show that the number of people at risk of hunger in SSA would increase by up to 15 per cent by 2050 compared to the economic scenario without climate change (perfect mitigation).
This study used projections from only two GCMs, and the effect of CO2 fertilization on yield was not considered. This indicates scope for future study of the response of maize to climate change in Africa, using advances in GCM projections and in modeling the response of maize to CO2 fertilization under low-input agriculture. Moreover, this study used current maize varieties and crop management practices in SSA, which will change in the future with advances in plant breeding and agronomy. Despite these limitations, the study provided a baseline bioeconomic impact of climate change on maize in SSA, which can be used as a benchmark to evaluate the contribution of adaptation interventions and technology options that will be used to adapt maize to the future climate in Africa.
The results of this study highlight the urgent need for greater investment in maize research, particularly on developing maize varieties that tolerate both drought and heat stresses. This will be required to minimize or offset the inevitable impacts of climate change on maize production in SSA and to reduce the level of food insecurity in the continent.




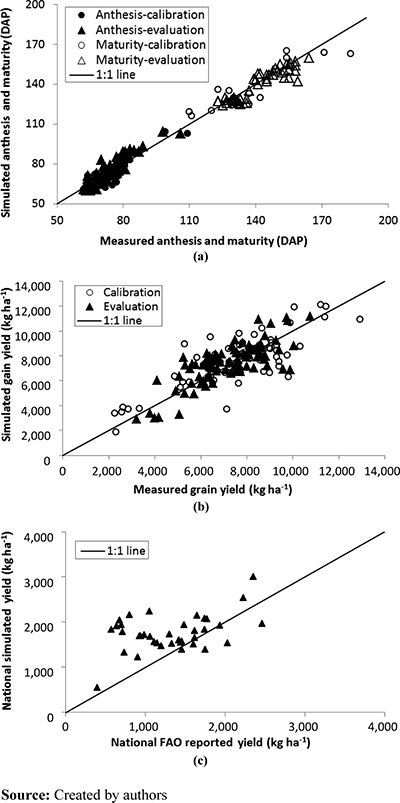
Comparison of measured and simulated values of (a) days to anthesis and physiological maturity and (b) grain yield of five benchmark varieties for the dataset used in model calibration and evaluation, and (c) average national-simulated and FAO-reported rainfed yields in SSA
Comparison of measured and simulated values of (a) days to anthesis and physiological maturity and (b) grain yield of five benchmark varieties for the dataset used in model calibration and evaluation, and (c) average national-simulated and FAO-reported rainfed yields in SSA
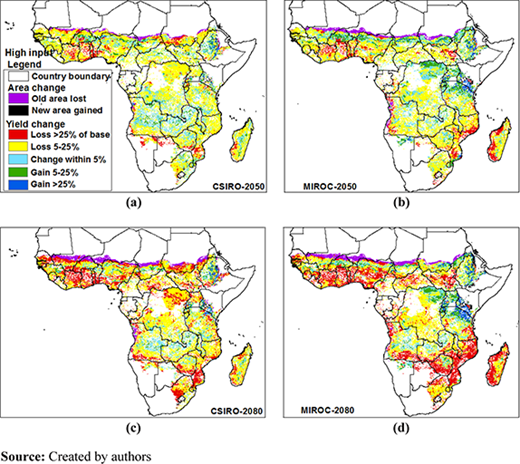
Changes in yield and area of maize under high N level in SSA by 2050 (a and b) and 2080 (c and d) relative to the baseline (2000) using climate projection from CSISRO (cooler, drier) and MIROC (warmer, wetter) GCMs under the A1B emission scenario
Changes in yield and area of maize under high N level in SSA by 2050 (a and b) and 2080 (c and d) relative to the baseline (2000) using climate projection from CSISRO (cooler, drier) and MIROC (warmer, wetter) GCMs under the A1B emission scenario
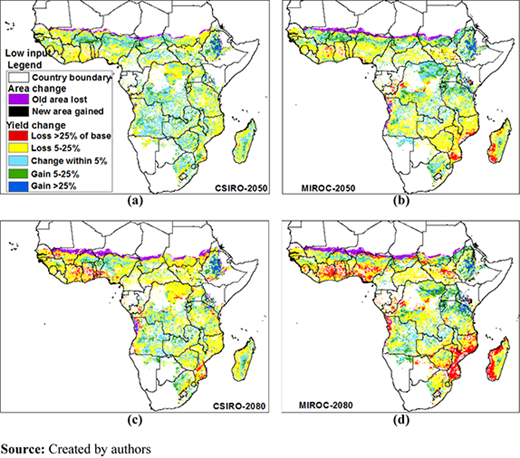
Changes in yield and area of maize under low N level in SSA by 2050 (a and b) and 2080 (c and d) relative to the baseline (2000), using climate projection from CSISRO and MIROC GCMs under the A1B emission scenario
Changes in yield and area of maize under low N level in SSA by 2050 (a and b) and 2080 (c and d) relative to the baseline (2000), using climate projection from CSISRO and MIROC GCMs under the A1B emission scenario
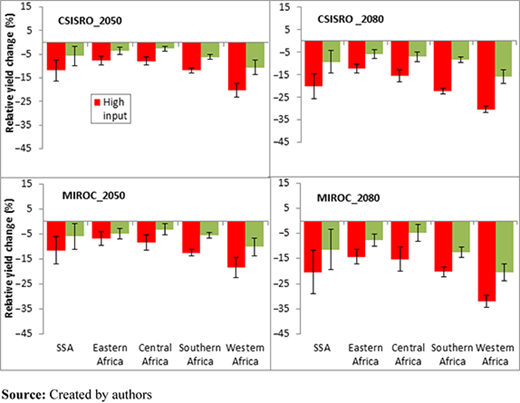
Regional changes in yield of maize by 2050 and 2080 in SSA under two nitrogen levels, using climate projections from CSIRO and MIROC GCMs under the A1B emission scenario relative to the baseline (2000). Vertical bars indicate standard error of means
Regional changes in yield of maize by 2050 and 2080 in SSA under two nitrogen levels, using climate projections from CSIRO and MIROC GCMs under the A1B emission scenario relative to the baseline (2000). Vertical bars indicate standard error of means
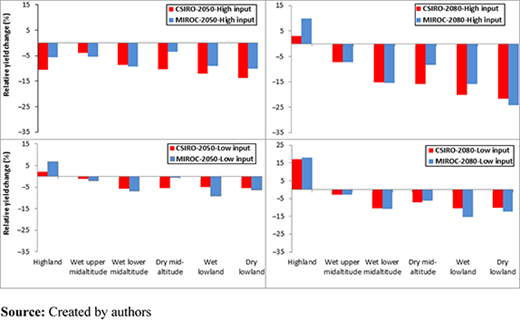
Changes in yield of maize in six MMEs in 2050 and 2080 under high- and low-input (N) levels using climate projection from CSIRO and MIROC GCMs under A1B emission scenario relative to the baseline (2000)
Changes in yield of maize in six MMEs in 2050 and 2080 under high- and low-input (N) levels using climate projection from CSIRO and MIROC GCMs under A1B emission scenario relative to the baseline (2000)
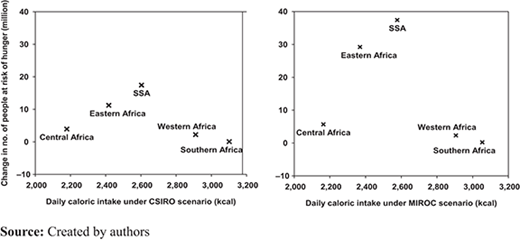
Regional comparison of changes in daily caloric intake and number of people at risk of hunger in sub-Saharan Africa under two climate change scenarios by 2050
Regional comparison of changes in daily caloric intake and number of people at risk of hunger in sub-Saharan Africa under two climate change scenarios by 2050
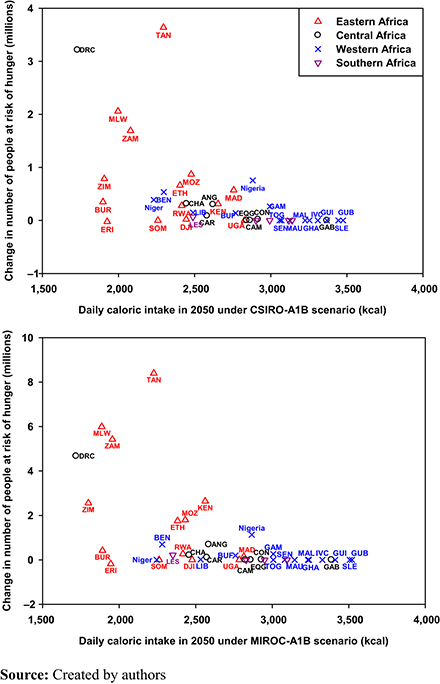
Daily caloric intake and changes in number of people at risk of hunger in sub-Saharan countries under two climate change scenarios by 2050. Unless specified, country names are represented by their three letter ISO codes
Daily caloric intake and changes in number of people at risk of hunger in sub-Saharan countries under two climate change scenarios by 2050. Unless specified, country names are represented by their three letter ISO codes

Description of benchmark varieties used for the study and their adaptation mega environments
Description of benchmark varieties used for the study and their adaptation mega environments
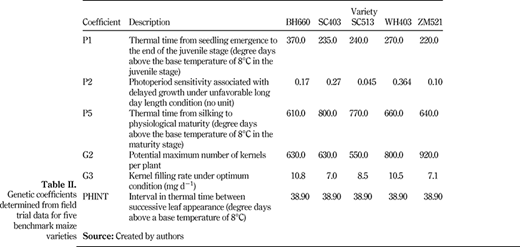
Genetic coefficients determined from field trial data for five benchmark maize varieties
Genetic coefficients determined from field trial data for five benchmark maize varieties
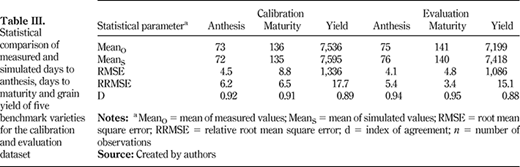
Statistical comparison of measured and simulated days to anthesis, days to maturity and grain yield of five benchmark varieties for the calibration and evaluation dataset
Statistical comparison of measured and simulated days to anthesis, days to maturity and grain yield of five benchmark varieties for the calibration and evaluation dataset
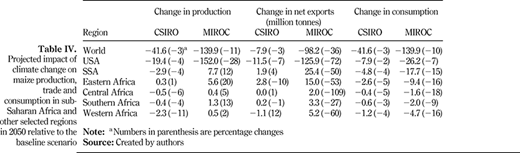
Projected impact of climate change on maize production, trade and consumption in sub-Saharan Africa and other selected regions in 2050 relative to the baseline scenario
Projected impact of climate change on maize production, trade and consumption in sub-Saharan Africa and other selected regions in 2050 relative to the baseline scenario
References
About the authors
Kindie Tesfaye works at the International Maize and Wheat Improvement Center (CIMMYT) based in Addis Ababa, Ethiopia. Prior to joining CIMMYT, he worked at Haramaya University and led several projects and supervised many MSc and PhD students. He has been conducting research on crop modeling, climate change, agricultural water management, agronomy and plant physiology, and published his works in peer-reviewed journals. His current research focuses on modeling the impacts of climate change and assessing adaptation options at several geospatial scales. He holds a PhD in Agricultural Meteorology from the University of the Free State in South Africa. Kindie Tesfaye is the corresponding author and can be contacted at: k.tesfayefantaye@cgiar.org
Sika Gbegbelegbe is an Agricultural Economist at the CIMMYT based in Nairobi, Kenya. Before joining CIMMYT, she was a Post-doctoral Scientist at the Africa’s Regional Strategic Analysis and Knowledge Support System and researched on trade in staple foods and food security in Eastern and Southern Africa (ESA). She is currently working on bioeconomic modeling and analysis of the economic impact of climate change and promising technologies at global and regional scales. She holds a PhD in Agricultural Economics from Purdue University.
Jill E. Cairns works at the CIMMYT based in Harare, Zimbabwe. She received her PhD from the University of Aberdeen in UK, and she has more than 13 years’ research experience in Southeast Asia, Latin America and Africa. Her research has focused on tolerance to drought, low nitrogen and heat stress in both maize and rice. Her current research focuses on the identification of donors for abiotic stress breeding programs, dissecting mechanisms of abiotic stress tolerance and improving the precision of field screening. She is also part of a team of CIMMYT researchers developing priorities for climate change research for maize production systems in ESA. She has published more than 30 articles in peer-reviewed international journals and book chapters.
Bekele Shiferaw is an Agricultural and Development Economist. He worked with the socioeconomic program at the CIMMYT based in Nairobi, Kenya until he joined the Partnership for Economic Policy recently. His research interests span analysis of institutions and policies for agricultural development and change, linking knowledge with policy and action, determinants of technology adoption, measurement of development and environmental impacts of policy interventions, analysis of market relations and commodity value chains, policy and institutional innovations for remedying market failures and strategies for enhancing adaptation to and mitigation of climate change impacts on agriculture. He has extensive experience on agricultural transformation, sustainable development and drivers of change in the developing regions. He has published over 50 papers in peer-reviewed international journals and books. He received his PhD degree in Development and Resource Economics from the Department of Economics and Resource Management, University of Life Sciences, Norway.
Boddupalli M. Prasanna is Director of the Global Maize Program at CIMMYT, based in Nairobi, Kenya. He received his PhD degree from the Indian Agricultural Research Institute (IARI), New Delhi, in 1991. Before joining CIMMYT, he worked as a maize Geneticist at IARI and led several network projects on molecular breeding, gene pyramiding, quality protein maize, biofortification, functional genomics and allele mining, and phenotypic and molecular characterization of maize landraces. He also served as Team Leader for India under the Asian Maize Biotechnology Network during 1998-2005, and as National Fellow of the Indian Council of Agricultural Research (ICAR) during 2005-2010. As a Fellow of the National Academy of Agricultural Sciences (India), he guided the research programs of several MSc and PhD students, and published more than 95 research articles and book chapters in peer-reviewed journals and books. He served as a member of several important policy-making bodies in India, including biosafety and biotechnology issues.
Kai Sonder is the Head of the GIS unit at CIMMYT, a cross-cutting service unit embedded in the socioeconomics program, based in Mexico. He has more than 16 years’ experience in Africa and Latin America in GIS, natural resource management and crop production. He holds a PhD in Soil Conservation and Erosion Modeling from the University of Hohenheim, Germany and MSc in Tropical Plant Production with emphasis on agroecology and entomology from the Justus-Liebig University in Giessen, Germany. His current research focuses on GIS, spatial analysis, targeting, remote sensing, climate change and crop modeling in Asia, Africa and Latin America.
Ken Boote is a Professor Emeritus at the University of Florida. He has researched and extensively published on photosynthesis, respiration, carbon and nitrogen metabolism and growth of crop plants in response to climate, carbon dioxide enrichment, drought, defoliating pests and diseases. He has collaborated with others to develop crop growth models for the purposes of enhancing physiological understanding, improving crop management strategies, evaluating physiological traits for genetic improvement and creating decision-support tools.
Dan Makumbi is a senior maize breeder at CIMMYT, Nairobi, Kenya. He has developed improved stress tolerant maize varieties that are being grown in diverse environments in several countries in Africa. He has been also involved in building the capacity of young maize breeders in many countries. He holds a PhD in plant breeding from Texas A &M University.
Richard Robertson works at the International Food Policy Research Institute (IFPRI) in Washington DC since 2008. Prior to that he completed environmental and water related post-docs at the University of Illinois at Urbana-Champaign in the Civil and Environmental Engineering as well as Agricultural and Consumer Economics departments. He obtained is PhD research (also at the University of Illinois) revolved around empirically modeling land use decisions using very large datasets to estimate discrete choice models. Prior to that, he earned a double major in Mathematics Education and Physics from Andrews University in Michigan. His work is concerned with harnessing GIS and parallelized computation to help deal with research problems of a spatial nature and/or those which are prohibitively difficult to tackle using conventional computational resources.
This work was supported by the CGIAR Research Programs on Climate Change, Agriculture and Food Security (CCAFS), and the Global Futures and Strategic Foresight (GFSF) Project funded by the Bill & Melinda Gates Foundation. We thank all the scientists involved in conducting regional trials. We also thank the three anonymous reviewers for their constructive comments and suggestions. The boundaries and names shown and the designations used on all maps do not imply official endorsement or acceptance by the authors.
Note
The base scenario assumes a moderate growth of 52 per cent in population and 212 per cent in per capita income worldwide between 2000 and 2050. The optimistic scenario assumes a higher increase in per capita GDP due to lower population growth rates and higher GDP growth rates whereas the pessimistic scenario involves higher population growth rates and lower GDP growth rates worldwide.

