


– This paper aims to assess the vulnerability of the farmer-respondents in Southern Philippines, specifically Region XI and XII, to climate change.
– This study conducted an empirical analysis of the impact of climate change on maize (Zea mays), banana (Musa sapientum) and durian (Durio zibethinus) production. Furthermore, it estimated the determinants of adaptation to climate change and its corresponding effect on farm productivity. The analysis used primary data from 541 farmer-respondents producing maize, banana and durian in the 6 provinces and 18 municipalities of the sample areas.
– Based on the probit estimate results, farmers adaptation decisions were influenced by information about future climate change conditions, social capital, access to formal extension and farmer-to-farmer extension. The author found from the stochastic frontier estimation in the production function that climate change adaptations exerted a significant impact on farm productivity. It helped in coping with the adverse effects and risk of climate change while increasing agricultural productivities of the farmer-respondents.
– This research paper will be an addition to the body of knowledge on the socioeconomic aspects on the climate change and adaptation on the production of maize, banana and durian in the case of a developing country like Southern Philippines. This will bring more insights into the adaptation strategies that are crucial to cope with climatic variability and change.
1. Introduction
The contribution of the Philippine agricultural sector to the total economy is challenged by its vulnerability to climate change. It is because agriculture is arguably the most important sector of the economy that is highly dependent on climate. This vulnerability has been manifested by the devastating effects of flooding and droughts. The disasters these have caused losses amounting to billions of pesos. The decline in production and productivity will possibly threaten the country’s food security. Climate change is a serious risk to poverty reduction and threatens to undo decades of development effort. Climate change will generally reduce production potential and increase risk of hunger and starvation. Thus, for countries that are highly vulnerable to the effects of climate change, understanding farmers’ responses to climatic variation is crucial in designing appropriate coping strategies to climate change. Moreover, to bring more insights into adaptation strategies that are crucial to coping with climatic variability and change, this study also investigates key factors that govern farmers’ decisions to use climate change adaptations and the impact of this action on food production.
Few studies have been made to estimate the impact of climate change on food production at the country, regional or global scale (Rosenzweig and Parry, 1994; Parry et al., 2004; Parry, 2007; Aydinalp and Cresser, 2008; Antle, 2010). Insights from these studies are important to appreciate the global extent of the problem. Nevertheless, these studies fail to include essential element in terms of effective adaptation strategies at the household level. Little work has been done on the impact of climate change (in particular precipitation and temperature) and climate-related adaptation measures on crop yield. Few researchers have addressed the latter problem (Deressa, 2007; Yesuf et al., 2008). This study was conducted using subregional agricultural data as well as household level. Insights from the study of Deressa (2007) are crucial to appreciating the impact of climate change on farm profits in Ethiopia. It applies the Ricardian approach, wherein the cost of climate change is imputed from farm net revenue as a proxy for capitalized land value. On the other hand, the study of Yesuf et al. (2008) examined the impact of key climatic variables on food production in Ethiopia using household-specific survey data. It identified the determinants of each of the adaptation methods used and the key factors that govern farmers’ decisions to use climate change adaptations and the impact of this action on food production. Although this study was conducted using subregional agricultural data as well as household level, it did not include the technical efficiency of each farm households.
This paper attempts to answer the increasing need for the body of literature on examining the impact of key climatic variables of food production in a typical developing country, using farm-household survey data. To bring more insights into adaptation strategies that are crucial to coping with climatic variability and change, this study also investigates key factors that govern farmers’ decisions to use climate change adaptations and the impact of this action on food production. The objectives of this research were to investigate key factors that govern farmers’ decisions to use climate change adaptations and the impact that conveys action on food production and to provide estimates of the determinants of adaptation to climate change and the implications of these strategies on farm productivity. The econometric approach the author used in this study is the stochastic frontier estimation in the production function which did not only look at how the climate change adaptations affect farm productivity but also reveals the technical efficiency of each farm household.
This paper is organized as follows: In Section 2, the author describes the study area. Section 3 details the theoretical framework, the sampling procedure and data analysis. Section 4 presents the empirical findings, while Section 5 concludes the paper and its implications.
2. Description of the study area
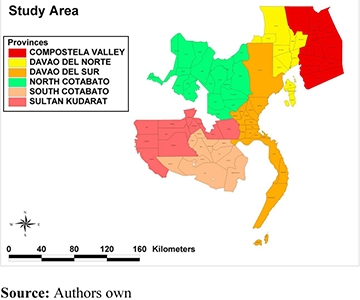
The study was undertaken in the major production areas of maize, durian and banana in Southern Philippines, specifically these are in Region XI and XII. The grouping of sample areas is shown below:
Region XI provinces: Davao del Sur, Davao del Norte and Compostela Valley. The average annual rainfall and temperature for 15 years in Region XI are 191.44 mm and 27.42°C, respectively. The total land area is 11098.43 sq. km. Region XII provinces: North Cotabato, South Cotabato and Sultan Kudarat. Rainfall and temperature for 15 years in Region XII are 175.5 mm and 27.5°C, respectively. The total land area is 14,819 sq. km. The study areas are depicted in Figure 1.
3. Methodology
3.1 Theoretical framework
3.1.1 The econometric approach.
The theoretical model presented here was adopted from the work of Yesuf et al. (2008). We framed our analysis using the standard theory of technology adoption, wherein the problem facing a representative risk-averse farm household was to choose a mix of climate change adaptation strategies that will maximize the expected utility from final wealth at the end of the production period. Assuming that the utility function is state-independent, solving this problem would give an optimal mix of adaptation measures undertaken by the representative farm household, as given by: Equation 1
Where A is household h adaptation strategy at time t; Inline Equation 1 are household characteristics, land and other characteristics and climate variables, respectively; β is the vector of parameters; and ξht is the household-specific random error term. Households will choose Adaptation Strategy 1 over Adaptation Strategy 2 if and only if the expected utility from Adaptation Strategy 1 is greater than the Adaptation Strategy 2 – that is E[U(A1)] > E[U(A2)].
A probit regression fit our data to estimate determinants of adaptation as specified in equation (1). This study’s central focus was to investigate whether climate change and adaptation have any impact on food production with adaptation measured by a dummy variable entered into a standard household production function, yht: Equation 2
Where Inline Equation 2 are conventional inputs, climatic factors and climate change adaptation measure, respectively; y is a vector of parameters; and ξht is a household-specific random error term.
3.2 Sampling procedure
Maize, durian and banana farmers were the target respondents for the study. A total of 541 farmers-respondents were picked from the study areas. The sampling technique used was multi-stage stratified random sampling technique. The first stage involved purposive selection of the vulnerable or barangays prone to climate change. The second stage was simple random sampling through selection of 541 farmers in the study areas.
3.3 Source of data
The project made use of both primary and secondary data. The secondary data used were from the socioeconomic profile report of the six provinces and the base maps were from the different Provincial Agriculture Offices and Provincial Planning Offices. Monthly precipitation and temperature data for the past 15 years were taken from the eight meteorological stations distributed across the regions, which served as basis for the interpolation procedure (precipitation and temperature). The eight meteorological stations were PAGASA Synoptic Station in Gensan Airport, General Santos City; PAGASA Synoptic Station in Hinatuan, Surigao del Sur; PAGASA Synoptic Station in Butuan City Airport; PAGASA Synoptic Station in Cagayan de Oro; PAGASA Davao City, Davao Airport, Sasa, Davao City; PAGASA Agromet Station, USeP, Apokon, Tagum City; PAGASA Bukidnon, Malaybalay City; and DA-CEMIARC for Upland Plain Agromet Station in Balindog, Kidapawan City. The interpolated precipitation and temperature were used as variables in the probit regression model.
Primary data were taken from the personal interview with the farmers, making use of pre-tested questionnaires and interview schedule designed specifically for maize, durian and banana. These were the sources used to collect data from the farmers for the study.
3.4 Data analysis
The data obtained from the field survey were subjected to analysis using inferential statistics.
A probit regression was used to estimate the determinants of adaptation. For this analysis, the data were run using data analysis and statistical software (STATA). The estimated production function made use of the stochastic frontier estimation method. For this analysis, the data were run using data analysis and statistical software (FRONTIER version 4.1c).
4. Results and discussion
4.1 Climate change and adaptation in the study sites
In response to long-term perceived changes in climate, the farmer-respondents in the study areas have undertaken a number of adaptation measures which were yield-related. The adaptation measures adopted by the farmer-respondents in Region XI included tree planting (40 per cent), provision of irrigation (18 per cent), drainage or construction of canal (19 per cent) and changing crop varieties (15 per cent). On the other hand, the adaptation measures adopted by the farmer-respondents in Region XII included changing crop varieties (55 per cent), tree planting (33 per cent) and intercropping (30 per cent). The non-yield related adaptation measures included sought off-farm activities (Table I).
About 82 per cent of the farmer-respondents in Region XI who did not adopt adaptation measures in response to climate change indicated lack of money as the major reason for not doing so. This was followed by lack of information, as reported by 59 per cent of the farmer-respondents. On the other hand, 45 per cent of the farmer-respondents in Region XII indicated that they did not see the need to adopt adaptation or counter measures to climate change. Reasons for not adopting included lack of information (40 per cent) and lack of money (29 per cent). Overall, the predominant reasons of the farmer-respondents in Regions XI and XII not adopting adaptation measures were lack of money (59 per cent) and lack of information (51 per cent), as shown in Table II.
Results of the study revealed that the farmer-respondents in both Regions XI and XII who have adopted climate change adaptation measures enjoyed higher average yield per hectare per year and average gross income per hectare per year than those who did not adopt adaptation measures. Specifically, the average yield per hectare per year of farmer-respondents in Region XI was 9,167 kg, while that of those in Region XII was 8,111 kg. In contrast, the average yield per hectare per year of farmer-respondents who did not adopt adaptation measures in Regions XI and XII was 5,135 kg and 5,850 kg, respectively. Based on the marginal effect estimates of our results, farmer-respondents with climate change adaptation measures tended to produce about 4,032 kg and 2,261 kg (in Regions XI and XII, respectively) or a greater average yield per hectare than those who did not adopt adaptation measures. On the other hand, the average gross income per hectare per year of adopters in Regions XI and XII was Php144,914 and Php120,354, respectively. This was higher compared to non-adopters whose average gross income per hectare per year was Php80,852 and Php90,027 in Regions XI and XII, respectively Overall, the pooled data revealed that both the average yield per hectare per year and average gross income per hectare per year of adopters were higher than the non-adopters.
4.2 The determinants of climate change adaptation
4.2.1 Basic descriptive statistics of sampled farmer-respondents.
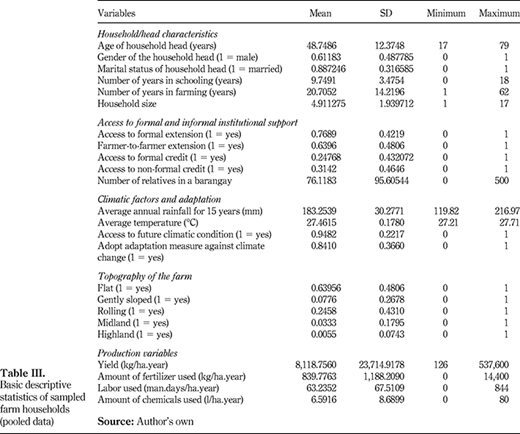
The basic descriptive statistics of the sampled farmer-respondents in both Regions XI and XII (pooled data) are shown in Table III. It revealed that the mean age of farmer-respondents was 48.75 years and spent schooling for 9.75 years on the average. The mean number of years in farming was 20.71 years and the mean household size, 5. In terms of climatic factors, the pooled data revealed that the average annual rainfall for the past 15 years was 183.25 mm and the average temperature was 27.46°C. The pooled data revealed that the average yield of the farmer-respondent was 8118.75 kg/ha/yr. The amount of fertilizer used averaged at 839.77 kg/ha/yr, while the amount of chemicals applied averaged at 6.6 liters/ha/yr. The farmer-respondents in both regions used labor at an average of 63 man-days/ha/yr.
4.2.2 Probit estimate of the adaptation regression.
Tables IV and V report the estimates of the empirical analysis. Table IV presents the probit results of the adaptation regression. A probit regression model was utilized to determine the factors affecting adoption of adaptation measures against climate change. The decision to use adaptation measures was assumed to be a function of household characteristics (i.e. age, gender, marital status, literacy, farming experience and household size), formal and informal institutional support (formal extension, farmer-to-farmer extension, access to credit and social capital), climatic factors (i.e. precipitation level, temperature level, information about future climatic conditions) and the farm household’s agro-ecological setting. The results suggested that information about future climate change condition, number of relatives in a barangay and access to formal credit tend to strongly govern each household’s adaptation decisions in Region XI. The afore-said variables were statistically significant, as indicated in the p-value (0.001, 0.008, and 0.04), significant at 0.01, 0.01 and 0.05 alpha level, respectively.
These results are consistent with a similar study by Deressa et al. (2008), which used a multinomial logit model in the Nile Basin, and the study by Yesuf et al. (2008), which also used a probit regression model. Likewise, age, number of years in schooling, household size and access to farmer-to-farmer extension were also significant variables that could affect the decision of the farmers to adopt the adaptation measure against climate change. There was a significant difference across the size of households. Larger households were more likely to adopt than were smaller households, highlighting the role of household labor on the adoption decision. Although, age had a negative sign, implying that as farmer’s age increased, the chance of supporting and adopting the adaptation measures against climate change decreased. The full model registered an LR χ2 which was significant at the 0.01 alpha level, indicating that the full model fitted reasonably well (as seen in Table IV).
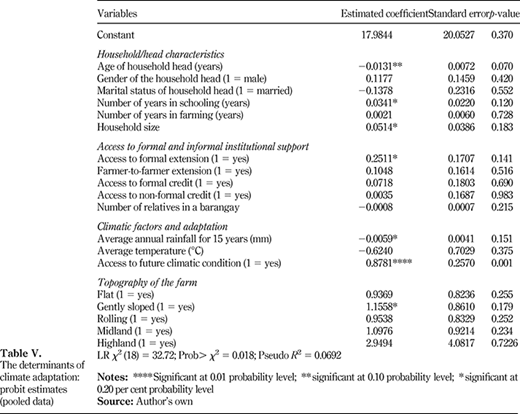
The probit estimates of the pooled data revealed that access to future climatic condition, average annual rainfall for 15 years, access to formal extension, household size, number of years in schooling, gently sloped and age of household head tend to strongly govern each household's adaptation decisions. Age of household head had a negative sign, implying that as farmer’s age increased, the chance of supporting and adopting the adaptation measures against climate change decreased. Furthermore, the average annual rainfall for 15 years also had a negative sign, implying that as the average annual rainfall increased, the chance of supporting and adopting the adaptation measures against climate change decreases (as seen in Table V). The full model registered an LR χ2 which was significant at the 0.05 alpha level, indicating that the full model fitted reasonably well.
4.2.3 Estimated production function.
4.2.3.1 Maize in Regions XI and XII.
Table VI shows the estimated parameters of the production function of maize in Region XI using the stochastic frontier estimation method. As shown in the table, all climatic factors and topography of the farm (agro-ecology) and the production inputs were highly significant; all estimates obtained p-value less than the 0.01 alpha level. The results showed that the estimated coefficient for adaptation was positive and statistically significant. Farmers who adopted climate change adaptation strategies had higher maize production than those who did not. Based on marginal effect estimates of our results, households with climate change adaptation measures tended to produce about 4,032 kg more crops per hectare than did those who did not take such measures. In other words, the effect of climate change is expected to be reduced by such a magnitude if households followed adaptation measures. All the conventional inputs exhibited signs consistent with predictions of economic theory, and all are statistically significant. As expected, more use of fertilizers, chemicals and labor tended to increase maize production. Finally, the gamma coefficient was also statistically significant at the 0.01 alpha level, indicating that the stochastic frontier model reasonably fitted the data.
Table VII shows the estimated parameters of the production function of maize in Region XII using the stochastic frontier estimation method. The results showed that the estimated coefficient for average annual rainfall was negative and statistically significant at the 0.05 alpha level. This implied that too much precipitation affected maize production negatively in Region XII. In terms of topography (highland, midland, rolling and gently sloped), coefficients were negative and statistically significant at the 0.05 and 0.10 alpha level. Higher topography affected maize production negatively. Inputs like chemicals and labor were statistically significant at the 0.01 and 0.05 alpha level, respectively. This implied that more labor and chemicals tended to increase maize production. Finally, the gamma coefficient was also statistically significant at the 0.01 alpha level, indicating that the stochastic frontier model reasonably fitted the data.
4.2.3.2 Banana in Region XI.
The estimated parameter of the production function of banana in Region XI is shown in Table VIII. As shown in the table, the estimated coefficient for adaptation is positive and statistically significant at the 0.10 alpha level. This implied that farmers who adopted climate change adaptation strategies had higher production than those who did not. All the conventional inputs exhibited signs consistent with predictions of economic theory, and all are statistically significant at the 0.01 alpha level. As expected, more use of fertilizers, chemicals and labor tended to increase banana production. Finally, the gamma coefficient was also statistically significant at the 0.01 alpha level, indicating that the stochastic frontier model reasonably fitted the data.
4.2.3.3 Durian in Region XII.
Table IX shows the estimated parameters of the production function of durian in Region XII. The results showed that the estimated coefficient for adaptation was positive and statistically significant at the 0.01 alpha level. This implied that farmers who adopted climate change adaptation strategies had higher production than those who did not. Furthermore, the results showed that the estimated coefficient for average temperature was positive and statistically significant at the 0.10 alpha level. This implied that higher temperature tended to increase durian production. In terms of inputs, amount of chemicals used was negative and statistically significant at the 0.10 alpha level. This implied that more amount of chemicals used tended to decrease durian production. Finally, the gamma coefficient is also statistically significant at the 0.01 alpha level, indicating that the stochastic frontier model reasonably fitted the data.
4.2.3.4 Pooled data in Region XI.
Table X shows the estimated parameters of the production function of the pooled data in Region XI using the stochastic frontier estimation method. As shown in the table, the estimated coefficient for adaptation is positive and statistically significant at the 0.05 alpha level. This implied that farmers who adopted climate change adaptation strategies had higher production than those who did not. Based on marginal effect estimates of our results, households with climate change adaptation measures tended to produce about 4,032 kg more crops per hectare than did those who did not take such measures. In other words, the effect of climate change is expected to reduce by such a magnitude if households took adaptation measures. The results showed that the estimated coefficient for average annual rainfall was positively and statistically significant at the 0.05 alpha level. This implied that more precipitation will affect crop production positively in Region XI. In a similar manner, the estimated coefficient for labor input was positive and highly significant at the 0.01 alpha level. This implied that more labor tended to increase crop production in Region XI.
4.2.4 Technical efficiency between adopter and non-adopter farmers.
Table XI presented the test for statistical difference in the mean technical efficiency of farmers who adopted the adaptation measure against climate change (adopter) and farmers who did not adopt the adaptation measure against climate change (non-adopter). Results revealed that the non-adopter corn farmers in Region XI have significantly higher mean technical efficiency, which marked at 0.1926, than adopter corn farmers in the same region, with mean equal to 0.0258. The statistical difference is indicated in the obtained p-value of 0.03, which is lesser than the 0.05 alpha level. Conversely, among the durian farmers, adopter farmers have statistically higher mean technical efficiency (0.4295) than the non-adopter farmers (0.2567). The statistical significance is based on the obtained p-value of 0.04, which is lesser than the 0.05 alpha level.
On the other hand, the mean technical efficiency between adopter banana farmers and non-adapter banana farmers in Region XI showed no statistical significance based on the computed p-value of 0.835, which is greater than the 0.05 alpha level. The same result is also observed in mean technical efficiency among farmers of banana, corn and durian in Region XII.
This indicates that technical efficiency of the adopter farmers is not drastically different from non-adopter farmers in Region XII. The non-significant difference in mean technical efficiency is consistent when data in each region are aggregated. When all the data are aggregated into one, same result is obtained. This means that, in general, technical efficiency is homogenous among farmers.
5. Conclusions and implications
The objectives of this study were to investigate key factors that govern farmers’ decisions to use climate change adaptations and the impact that conveys action on food production and to provide estimates of the determinants of adaptation to climate change and the implications of these strategies on farm productivity using farm-household data from 541 farmer-respondents within the Southern Philippines. The author used the stochastic frontier estimation in the production function which not only looks at how the climate change adaptations affect farm productivity but also reveals the technical efficiency of each farm household.
The following points can be inferred based on the results and analyses made in the study: Based on the probit results of the adaptation regression, information about future climate change condition, number of relatives in a barangay, access to farmer-to-farmer extension, number of years in schooling, household size and access to formal credit tended to strongly govern each household’s adaptation decisions in Region XI. For Region XII, access to future climatic condition and access to formal extension tended to strongly govern each household’s adaptation decisions. For the pooled data, the factors which strongly govern each household’s adaptation decisions were access to future climatic condition, access to formal extension, household size and number of years in schooling. This result underlines the need to provide appropriate and timely information on future climate changes to farmers to increase their level of awareness and preparedness and to alert them to take appropriate averting actions. The fact that access to credit markets, social ties and networks, government or formal extension and farmer-to-farmer extension were significant in the probit model indicated the role of both formal and informal institutions in addressing the issues of climate change adaptations in the study sites. Strengthening of the Department of Agriculture extension program to the farmers in the study sites and strengthening the social network or capital will be very helpful in equipping the farmers in the study sites against the adverse effects of climate change.
The estimated parameters of the production function of maize, banana and durian in Southern Philippines using the stochastic frontier estimation method showed that the estimated coefficient for adaptation was positive and statistically significant. This implies that farmers who adopted climate change adaptation strategies had higher production than those who did not. It helps in coping the adverse effects and risk of climate change while increasing agricultural productivities of the small farm households. Finally, though the author hypothesized that the mean technical efficiency of farmers who adopted the adaptation measures against climate change (adopters) is higher than the farmers who did not adopt the adaptation measures against climate change (non-adopters), the results of the study revealed that the technical efficiency of the adopter farmers is not drastically different from non-adopter farmers. This implies that, in general, technical efficiency is homogeneous among farmers. Future empirical research may pay more attention to the probit results of the adaptation regression by segregating the farmers by the specific crop raised rather than aggregating the data. It is also noteworthy to verify why the mean technical efficiency of adopters and non-adopters is homogeneous. It may be worth attempting to verify the homogeneity of the mean technical efficiency of adopters and non-adopters by replicating the research in other study sites through the combination of cash crops alone or plantation crops alone.




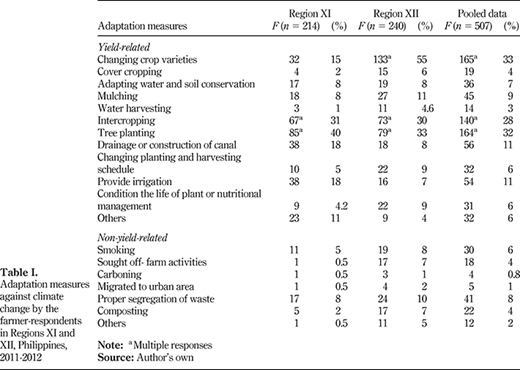
Adaptation measures against climate change by the farmer-respondents in Regions XI and XII, Philippines, 2011-2012
Adaptation measures against climate change by the farmer-respondents in Regions XI and XII, Philippines, 2011-2012
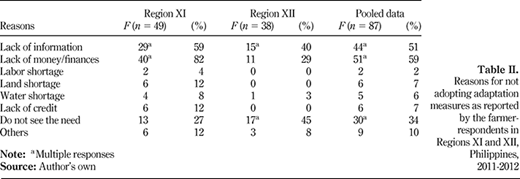
Reasons for not adopting adaptation measures as reported by the farmer-respondents in Regions XI and XII, Philippines, 2011-2012
Reasons for not adopting adaptation measures as reported by the farmer-respondents in Regions XI and XII, Philippines, 2011-2012
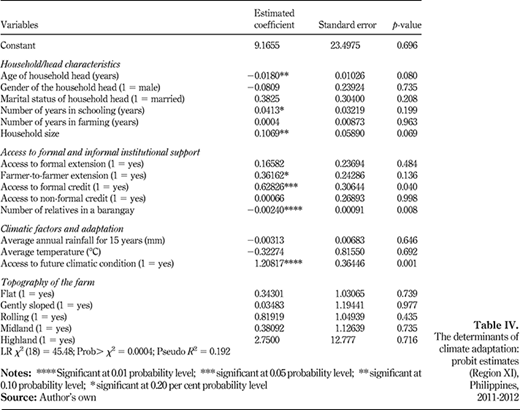
The determinants of climate adaptation: probit estimates (Region XI), Philippines, 2011-2012
The determinants of climate adaptation: probit estimates (Region XI), Philippines, 2011-2012
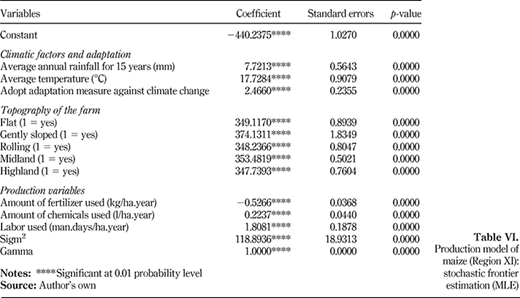
Production model of maize (Region XI): stochastic frontier estimation (MLE)
Production model of maize (Region XI): stochastic frontier estimation (MLE)
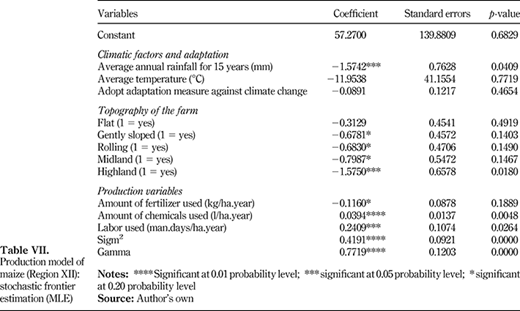
Production model of maize (Region XII): stochastic frontier estimation (MLE)
Production model of maize (Region XII): stochastic frontier estimation (MLE)
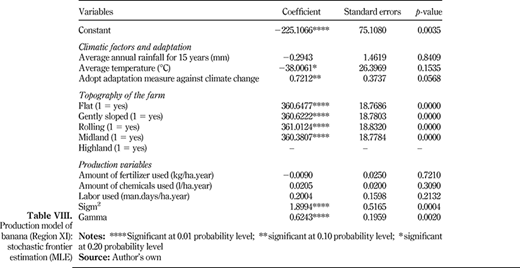
Production model of banana (Region XI): stochastic frontier estimation (MLE)
Production model of banana (Region XI): stochastic frontier estimation (MLE)
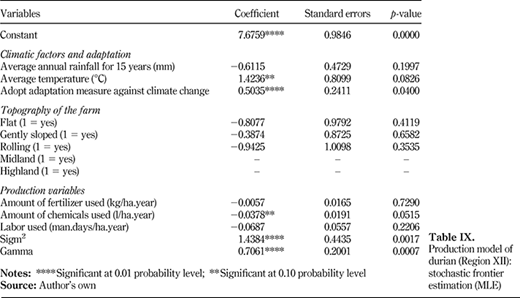
Production model of durian (Region XII): stochastic frontier estimation (MLE)
Production model of durian (Region XII): stochastic frontier estimation (MLE)
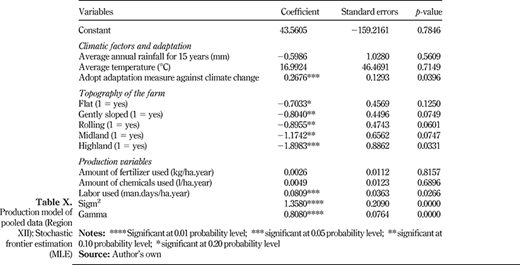
Production model of pooled data (Region XII): Stochastic frontier estimation (MLE)
Production model of pooled data (Region XII): Stochastic frontier estimation (MLE)
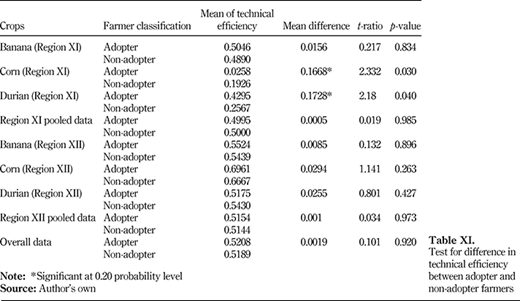
Test for difference in technical efficiency between adopter and non-adopter farmers
Test for difference in technical efficiency between adopter and non-adopter farmers
References
Further reading
The helpful comments of the anonymous reviewers are fully acknowledged. Funding for this research was provided by the Philippine Department of Agriculture – Bureau of Agricultural Research (DA-BAR).

