


This study aimed to determine factors that increase resilience and cause smallholder farmers to adapt better to climate change and vulnerability.
In this study, the authors used the vulnerability to resilience model and binary logit model to analyse the factors influencing household decisions to adapt.
Households with increased access to climate information through extension services were likely to have better adaptation abilities. It was also shown that younger farmers were likely to adapt to climate change given their flexibility to adopt new techniques and their access and use of modern information and technology. Larger households were found to have higher probability of adapting as most adaptation strategies are labour intensive. Household’s possession of livestock and access to credit significantly enhanced adaptation. However, households with higher farm income have lesser incentives to adapt to because their current farming practices might already be optimum.
Given that most of the smallholder farmers are vulnerable, such as women-headed households and the elderly, who are labour constrained, there is need for research and development of labour saving technologies to increase resilience to climate change and vulnerability.
These findings underscore the importance of enabling farmer access to information and better technologies which enable them to increase adaptive capacity and resilience.
1. Introduction
Scientific evidence suggests that global climatic conditions are changing mostly for the worst (CGIAR, 2012; Marin, 2010). Climate change has been regarded as a silent crisis because the effects of climate change are not immediately visible (Maponya, 2010). However, climate change has changed weather patterns (onset of seasons and rainfall distribution) and increased the intensity and frequency of extreme weather events such as droughts and floods, which impact particularly on the poor in developing countries (Läderach et al., 2011).
High variability in rainfall and temperature that have come as a result of climate change exposes farmers to climate risks and affects agricultural production on which their livelihoods are dependent (Shiferaw et al., 2014). In Zimbabwe, 70 per cent of the local population depends on rain fed agriculture, which is also subsistence-based; yet, agriculture is the backbone of the economy. This means that rainfall and temperature variations have severe implications on production and food security (Unganai and Murwira, 2010). Using the 1961-1990 baselines, it is suggested that by 2050, average temperatures in Zimbabwe will be 2-4°C higher and rainfall 10-20 per cent less, and this will consequently significantly reduce maize yields (Lobell et al., 2008; Unganai and Murwira, 2010). Climate models predict that Zimbabwe agriculture production levels might drop by around 30 per cent because of climate change (Mano and Nhemachena, 2007).
Farming communities have used various copping and adaptation strategies to counter climate change and variability. Nhemachena and Hassan (2010) underscored that adaptation measures help smallholder farming communities develop adaptive capacity and resilience to climate change (Klein et al., 2014). Smallholder farmers use both scientific (meteorological) and indigenous knowledge systems to make adaptation decisions (Jiri et al., 2015b; Mapira and Mazambara, 2013). These adaptation decisions would assist smallholder farmers attain better livelihoods in the face of climate change and variability (Dube and Sekhwela, 2007). This helps farmers guard against the effects of increasing temperatures and decreasing rainfalls moderating vulnerability (Hassan and Nhemachena, 2008; Wilhite et al., 2014). Understanding adaptation to climate change, therefore, is important so as to develop and implement effective adaptation measures which lead to improved adaptive capacity and resilience at the household level. This is critical, as the velocity of current climate change and variability may outpace adaptation in many parts of the world (Adger and Barnett, 2009), unless serious consideration is given to local-level adaptation strategies that increase resilience in the short term and increase adaptive capacity for future impacts. In smallholder farming communities, climate smart agricultural options such as conservation agriculture and use of drought-tolerant crops are some of the adaptation strategies being encouraged (Pye-Smith, 2011).
Resilience is a key concept used in various disciplines such as ecology and sociology. In ecology, the concept of resilience is used in ecosystem management and in analysis of population ecology of fauna and flora. In sociology, resilience is conceptualised in socio-ecological systems (United Nations, 2011). Empirical observations of ecosystem dynamics interpreted in mathematical models was generally used to determine resilience (Folke, 2004). However, there has been a shift from such conceptualisation, and resilience has increasingly been used in human-environment interaction analysis to understand how humans affect the resilience of ecosystems (van Leeuwen et al., 2013). In some studies, resilience is regarded as the antithesis of vulnerability (Folke, 2004), but some scholars do not make such a clear distinction (Shiferaw et al., 2014). However, in some cases, a resilience factor may lead to more vulnerability to climate change and variability. For example, livestock farming can be a resilience strategy when there is no drought, as livestock can be sold for income. However, under drought conditions, holding onto livestock increases vulnerability to climate impacts (Ifejika, 2010). This study evaluated adaptation options as a means to increasing resilience to climate change and variability and, thus, increases adaptive capacity. This was done through analysis of socioeconomic factors influencing smallholder farmers’ decisions to adapt to climate change and variability.
2. Methodology
2.1 Site description
The study was conducted in Chiredzi District which is located south east of Zimbabwe. Chiredzi District lies in Masvingo province. Chiredzi town is located about 400 km from the capital of Zimbabwe, Harare. The district is found in natural agroecological region five of Zimbabwe (Zimbabwe Meteorological Department, 2006). In Zimbabwe, natural region five is characterised by aridity and uncertain rainfall patterns. Chiredzi receives mean annual rainfall of 450-600 mm with mean annual evaporation exceeding 1,800 mm. Historical data show that surface temperatures in the district have warmed by 0.6°C from 1966 to 2005 and is projected to rise to 1.5-3.5°C by about 2050 (Davis, 2011; Zimbabwe Meteorological Department, 2006). Despite the aridity of the district, the main source of livelihood for households in Chiredzi is agriculture.
2.2 Resilience analysis data collection
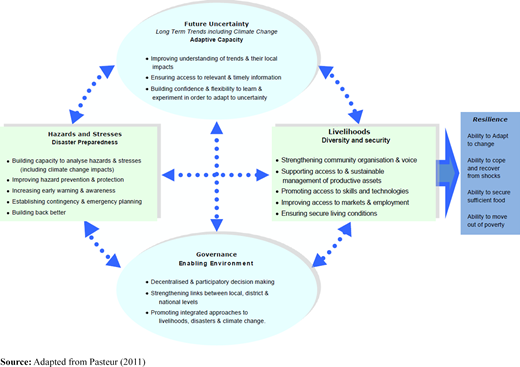
Data collection was based on guidance of the vulnerability to resilience framework (Pasteur, 2011) and the climate vulnerability and capacity analysis framework (Care, 2009). The tools generally recognize that individuals and communities are vulnerable in different ways. A summary of the tool is represented in Figure 1. However, the governance component was beyond the scope to of this study. Both qualitative and quantitative techniques were used to collect data. Data were collected using a structured questionnaire, focus group discussions and key informant interviews and literature surveys. Sampling of the study area was achieved through the help of government agricultural extension (AGRITEX) officials in the area who assisted in the identification of suitable wards in which to carry out the study. A ward, in this case, consisted of an average of 15 villages of about 40 households each. Four wards, two on either side of the Runde River, were chosen for this study. Farmer lists were produced for each village by the respective AGRITEX officers for each ward. Five villages were then randomly chosen from each ward so as to have a sample representing the whole ward. Within the randomly selected villages, 5 farmers were also randomly selected using the farmer lists in each village to give 25 respondents per ward. The respondents identified for this study were all dry land smallholder farmers. A total of 100 respondents were included in the study. Quantitative data collected were analysed using the Statistical Package for Social Sciences (SPSS).
2.3 Binary logit model
The study used a binomial logit model to analyse the socioeconomic factors affecting the households’ decision to adapt to climate change or not to adapt. This method has been used by several authors to study household decision to adapt to climate change (Charles et al., 2014). The dependent variable is dichotomous, i.e. households’ decision to adapt or not adapt to climate change. The binary logit model in this case is appropriate because it considers the relationship between a binary-dependent variable and a set of independent variables.
The model uses a logit curve to transform binary responses into probabilities within the 0-1 interval. In the logit model, the parameter estimates are linear and assume a normally distributed error term (μ). The logit model is specified in equation (1) as:
Where βj is a vector of coefficients on each of the independent variables Xi. equation (1) can be normalised to remove indeterminacy in the model by assuming that β0 = 0, and the probabilities can be estimated as:
The general form of the logit model is presented below:
The binary logit estimate is expressed in its implicit form as follows:
Where Y is the adaptation status (1 = farmers who adapted, 0 = farmers who did not adapt); X1 is age of household head; X2 is access to extension (1 =accessed extension, 0 = no access to extension); X3 is the number of individuals fit to work; X4 is access to credit (1 = access to credit, 0 = no access to credit); X5 is farm income; X6 is livestock holding; X7 is total dryland area; X8 is employment status (1 =full time, 0 = otherwise); X9 is literacy level (1 = literate, 0 = otherwise). The a priori-expected relationship between the dependent and explanatory variables is given in Table I.
Description of variables and expected signs
| Variable | Relationship with dependent variable (and the influence on farmer and household resilience) | Expected sign |
|---|---|---|
| Age of household head | Young farmers are quick to understand and accept new ideas and are more likely to be willing to adapt to climate change than older farmers (better resilience) | Negative |
| Education level of the household head | Education increases the probability of adapting to climate change as it is associated with being open minded and the ability to embrace positive change (better resilience) | Positive |
| Number of people fit to work in the household | A larger household is expected to have a better labour endowment, enabling achievement of farm activities (better resilience) | Negative or positive |
| The consumption pressure as a result of a large household size may result in diversion to off-farm activities to generate more income, crippling ability to adapt (less resilience) | ||
| Access to credit finance | Use of credit facilities enables farmer to fund farm operations therefore enhancing the probability of a farmer to adapt strategies (better resilience) | Positive |
| Employment status or time awarded to farming | A fulltime farmer primarily seeks to be productive in his farm activity and thus more likely to adapt (better resilience) | Positive |
| Household total dryland farm area | The larger the farm size, the greater the proportion of land allocated to other crop varieties (Feder et al, 1985) (better resilience, if climate smart technologies are adapted) | Positive |
| Total farm income | High income enables farmer to be able to finance different activities (better resilience) | Positive |
| Total livestock owned by the household | Livestock ownership represent wealth, households with better livestock endowment adapt better (better resilience) | Positive |
| Access to extension advice (dummy variable 1 = yes 0 = no) | Access to extension advice is expected to increase one’s choice to adapt. Extension increase access to useful knowledge meant to bring change and growth (better resilience) | Positive |
| Access to information | Access to information via technology such as mobile phones and radio is expected to increase the awareness and choices to adapt (better resilience) | Positive |
3. Results
3.1 Adaptation determinants for resilience
A comparative analysis of socioeconomic variables of households according to their adaptation status is given in Table II. The results show that 71 per cent of the farmers interviewed adapted to climate change and variability. From the sample, 61.9 per cent farmers who have adapted to climate change were males, whereas 38.1 per cent were females. On the other hand, 67.6 per cent of non-adapters were males, and 32.4 per cent were females. However, the chi-square test showed no significant association between the gender concentration for adapters and non-adapters. Instead, there was a significant difference in the mean age of adapters (43 years) and non-adapters (57 years) (p < 0.05). Households adapting to climate change tended to be younger. Incomes of adapters were significantly higher, and adapters had access to credit. A significant difference was also noted between the literacy status of farmers; 74.6 per cent of the farmers who adapted to climate change were literate, whereas 55.9 per cent of the households that did not adapt were literate (p < 0.05). The chi-square analysis showed the presence of systematic association between the literacy status of farmers and adaptation to climate change.
Household characteristics influencing adaptation to climate change and variability
| Characteristics | Adapters to climate change N = 100 | Non-adapters to climate change N = 100 |
|---|---|---|
| Proportion of adapters to non-adapters | 71 | 29 |
| Age of household head (mean) | 43 | 57 |
| Gender | ||
| Male | 61.9 | 67.6 |
| Female | 38.1 | 32.4 |
| Level of education of the household head | ||
| Literate | 74.6 | 55.9 |
| Illiterate | 25.4 | 44.1 |
| Number of people fit to work (mean) | 6 | 3 |
| Credit finance | ||
| Access to credit | 41.3 | 6 |
| Lack of access to credit | 58.7 | 94 |
| Extension advice | ||
| Accessed extension | 63.5 | |
| No access to extension | 36.5 | |
| Farm income per household (mean) | US$154 | US$27 |
| Livestock holding per household (mean) | 4 | 2.5 |
3.2 Development of resilience
Table III summarises the key strategies that could be used by smallholder farmers to develop resilience and adaptive capacity to climate change and variability. These results shown in Table III are based on information provided through focus group discussions and interviews with key community people. Success and continued adaptation could be defined by these factors. The key informants, interviewees and focus group discussants emphasised the nature, pathways and stakeholders for obtaining measurable outcomes on each strategy (Table III).
Farmer suggestions on building smallholder farmer resilience at local level
| Resilience building strategy | What can be measured as enabling information | Pathways and stakeholders for building resilience | Measurable outcomes |
|---|---|---|---|
| Access to localised information on local seasonal quality and | Downscaled climate modelling and up-to-date climate change scenarios and use of indigenous knowledge systems for disaster risk reduction | Scientific and academic community and stakeholders consolidate and downscale research; integration of scientific knowledge with indigenous knowledge systems for adapters, organisations working in the local area and extension workers | Availability of relevant climate information, services and products |
| A compendium of adaptation options as a result of climate change and variability | Vulnerability and risk assessments | Institutional capacity to support adaptation; social capital and safety nets; provision of services such as research, extension and credit; emergency response services by government and local community | Improved long-term resilience against shocks and stressors; early warning systems operational at local level using scientific and indigenous knowledge systems |
| Relevant downscaled climate modelling, weather and seasonal forecasts and use of indigenous knowledge systems | |||
| Informed decision-making by communities | Simple local and temporal maps by farmers and other stakeholders on hazards prevalence and vulnerability indices; timely and relevant supply of climatic information | Engagement with climate information producers and knowledge brokers to discuss needs and availability of information and resilience building options | Useable and reliable climate change information available for use by policy makers and planners at the local and national level |
| Promotion of innovation and local research | Scenarios of future agro-climatic conditions | Research programmes specifically targeting climate resilient crops for expected climatic conditions | Climate resilient cropping options developed and being experimented with farmers |
| Principles, practice and case studies of resilient options available for farmers | |||
| Extension workers with proper training in climate change and variability | Key skills required for climate resilient systems by farmers and extension workers | In-service training to fill skills gaps in current agricultural extension workers | Courses that support climate resilience building |
| Agronomic and socioeconomic conditions which build food security | Promotion of climate smart agricultural practices | Training in climate smart agricultural practices; demonstration of climate smart options at farm level; financial and other support available for climate smart agriculture | Number of farmers adopting climate smart agriculture; institutionalisation of climate smart agriculture and its mainstreaming in agricultural policies |
3.3 Development of resilience, farmer adaptation strategies
To cope with recurrent droughts, farmers used adaptation strategies that included dry planting, planting short-season crop varieties, planting drought-tolerant crops such as sorghum and millets, moisture-preserving techniques such as conservation agriculture, holding prayers and religious festivals and crop diversification (Table IV). Of these adaptation techniques, the most commonly used was dry planting (26.8 per cent) followed by conservation agriculture (17.5 per cent) and planting short season varieties.
3.4 The likelihood of farmers adapting, developing resilience and adaptive capacity
The results of the binary logit regression are shown in Table V. The model had a 91.4 per cent correct prediction value denoting the accuracy of prediction of compared variables. The likelihood ratio chi-square value was 85.5, implying that the model is very well fit to the data, that is, the likelihood of the null hypothesis which states that the coefficients are equal to zero (i.e. farmers not adapting) being correct is extremely low. Most of the variables tested had the expected hypothesised signs (Table I). From the logit regression results, draught power, access to credit, extension education and number of members fit to work positively and significantly influence farmers’ decision to adapt to climate variability (Table V). Thus, the development of resilience to climate change is positively affected by these factors. At the same time, age of household head and farm income negatively and significantly influence farmers’ decision to adapt. Thus, these factors had a negative correlation to development of adaptive capacity and resilience.
Adaptation to climate change (binomial logit regression model)
| Variable | β | SE | p-value | Exp (β) |
|---|---|---|---|---|
| Age of household head | −0.205 | 0.075 | 0.006*** | 0.815 |
| Extension advice | 5.347 | 1.963 | 0.006*** | 210.044 |
| Members fit to work | 0.986 | 0.385 | 0.010** | 2.682 |
| Access to credit | 2.572 | 1.377 | 0.062* | 13.098 |
| Total farm income | −0.011 | 0.006 | 0.085* | 0.989 |
| Total livestock holding | 0.553 | 0.287 | 0.054* | 1.739 |
| Total dryland area | 0.240 | 0.308 | 0.437 | 1.271 |
| Employment status | 0.998 | 1.968 | 0.612 | 2.713 |
| Literacy level | 1.692 | 1.272 | 0.183 | 5.433 |
| Constant | −0.686 | 2.936 | 0.815 | 0.504 |
| Number of observations = 100 | ||||
| Pseudo R2 = 0.835 | ||||
| Log likelihood = 32.828 | ||||
| LR χ2 = 85.564 | ||||
| Probability > χ2 = 0.0000 | ||||
| Overall per cent correct 91.4% | ||||
Notes:
Significant at 1%;
significant at 5% level;
significant at 10% level
3.4.1 Influence of age of household head on adaptation and resilience development.
The estimated parameter for age of the household head is a negative sign and is statistically significant at 1 per cent showing that the age of the household head has a strong influence on farmers’ decision to adapt to climate change. In other words, the older the household head is, the lower is the adaptation and resilience capacity of the household. The Exp (β) value shows that the odds of adapting to climate change decreases by a factor of 0.815 for a unit increase in age. Young farmers were more likely to take up adaptation to climate change and variability than older farmers. In general, as people grow older, they are reluctant to adopt new techniques and let go of the conventional way of doing things.
3.4.2 Influence of members fit to work in the household on adaptation and resilience development.
The number of household members fit to work (those members who are not sick or too old to engage in manual agricultural work) positively and significantly influenced adaptation. Members too old for work were those above 65 years of age. For a unit increase in farm household size, the odds that farmers will adapt to climate change are expected to rise by a factor of 2.68 (Table V). This implies that the bigger the family size, the higher is the probability of adapting to climate change.
3.4.3 Influence of access to credit on adaptation and resilience development.
The results show that access to credit increased the adaptation capacity of the farmer. The odds of a farmer adapting to climate change is expected to increase by a factor of 13 if a farmer gains access to credit (Table V).
3.4.4 Influence of total livestock holding of household on adaptation and resilience development.
As per expectation, livestock holding had a positive relationship with adaptation to climate change. An increase in total livestock holding by one unit is likely to give an increase in the odds of adaptation to climate change by a factor of 1.74 (Table V).
3.4.5 Influence of household access to extension services on adaptation and resilience development.
Access to extension services on climate change adaptation positively influenced a household’s decision to adapt to climate change (Table V). It is expected that with increased information on climate change and adaptation techniques, farmers would choose to adapt.
3.4.6 Influence of total household farm income on adaptation and resilience development.
Contrary to a priori expectation and empirical evidence, the results show a negative relationship between farm income and the choice to adapt to climate change. The most probable reason is that farmers who engage in the conventional agricultural system realise that high-farm incomes may not be willing to take up new activities, as they could be comfortable with what they were getting. The education level of the household head, farm size and employment status of the household had no significant influence of adaptation to climate change (Table V).
4. Discussion
The conclusions on the influence of age on adaptation and development of farmer resilience have been mixed with some studies showing no influence and others showing positive or negative influence (Charles et al., 2014). The results in this study showed that the younger farmers would adapt better, developing resilience better than the older farmers. This is in contrast to results from a study by Bryan et al. (2009) which showed a positive relationship between age of household head and adaptation to climate change, with more mature and experienced farmers adapting to climate. However, Mano and Nhemachena (2007) and Fosu-Mensah et al. (2012) concluded that age did not significantly influence adaptation. The results of our study agree with a study by Shiferaw et al. (2014) who also found that the head of the household age negatively influenced adaptation. Nyong et al. (2007a, 2007b) also suggested the possibility that older farmers may be less amenable to change from their old practices.
The size of the household was found to have a significant influence on resilience development. Considering that some of the agronomic adaptation strategies such as conservation agriculture and dry planting are labour-intensive, households with large families would be able to take up labour-intensive adaptive measures compared with smaller households (Vincent and Cull, 2013). These results are consistent with findings of studies by Gbetibouo (2009) and Nhemachena and Hassan (2010), in South Africa and Zimbabwe, respectively. On the other hand, Apata et al. (2009) found that an increase in household size negatively influenced farmers’ adaptation to climate change. In support, Mano et al. (2006) postulated that as household size increased, households are inclined to divert part of its labour force toward off-farm activities. Adaptation strategies such as use of drought-tolerant crop varieties have been one of the major strategies for managing water scarcity in agriculture (Rurinda et al., 2014), and long years of plant-breeding activities have led to yield increase in drought affected environments for many crop plants (Mutekwa, 2009). Drought tolerance in crops such as maize, pearl millet, cowpea, groundnut and sorghum played an important role in fighting the worst droughts in the last half of the nineteenth century in the Sahel (Mertz et al., 2009). By exploiting drought-tolerance genes, several national and international research institutions have scored important gains in improving the drought tolerance of major grain crops in Africa. Legume crops are vital sources of low-cost protein for smallholder farmers, and they generate farm income, serve as quality livestock feed and restore soil fertility. Groundnut, followed by cowpea, is the most widely grown grain legume in the dry areas of Africa, and several countries have released improved cowpea varieties with support from the International Institute of Tropical Agriculture (IITA) (CGIAR, 2012). Drought-tolerant varieties of common bean, groundnut, Bambara nut and pigeon pea are also grown in highly variable rainfall areas of Africa (Verchot et al., 2007). The choice of these drought-tolerant crops is against the background that most farmers in Africa rely on rainfall to grow maize. Dry conditions often have disastrous consequences, often leading to more vulnerability.
Several studies conducted on the determinants of adaptation show a positive relationship between adaptation and credit (Gbetibouo, 2009; Fosu-Mensah et al., 2012; Hassan and Nhemachena, 2008). With access to credit, farmers are able to purchase appropriate crop seed varieties and fertilisers, plant early and incorporate other farming practices such as crop diversification, in response to changes in climate. In addition to financial resources, households can make use of the available information and the numerous adaptation options to respond to climate variability. Therefore, access to credit is a very important factor in determining whether a household adapts to the adverse effects of climate change and variability.
An increase in total livestock holding by one unit is likely to give an increase in the odds of adaptation to climate change by a factor of 1.74 (Table V). Thornton et al. (2007) found livestock endowment to positively affect farmers choice to adapt to climate change or not. Possession of livestock in a rural setting in Zimbabwe signifies better endowed households or in other words wealthy households. This implies that households that are better off are likely to adapt to climate change because they have resources to enable them to adopt other means of livelihoods than those households without or with few resources at their disposal.
The positive influence of extension information to adaptation decision-making is consistent with findings by Mano and Nhemachena (2007) who found that access to extension strongly and significantly influenced farmers’ adaptation to climate change. Gbetibouo (2009) noted that with access to extension, households would be aware of the climatic conditions and the various management practices to adapt to climate change. Soil nutrient depletion has become one of the major constraints to food security in sub-Saharan Africa because of low crop productivity that causes declining per-capita food production (Sanchez et al., 2004; Stocking, 2003). One of the reasons for under-investment in soil fertility inputs in rain-fed production systems in Africa is the uncertainty and risks associated with climate variability (IAC, 2004), mainly because nutrients are not used efficiently when water availability is inadequate which results in considerable variability in profitability of fertilizer use and optimal application rates from year to year and season to season (Whitbread et al., 2004). One of the options for addressing this problem lies in seasonal climate forecasting which presents opportunity for increasing the efficiency of both water and nutrients through adaptive fertilizer management (Jiri et al., 2015a; Vanlauwe et al., 2013). Improved drought management and preparedness depends on access to climate information and early warning systems. The value of climate information lies in its ability to provide evidence of risk of a major climate shock in advance which help in anticipating the costs and the scale of measures that may be needed at the national and regional level (Jost et al., 2015). Climate information systems can contribute to strengthening institutional capacity and coordination to support generation, communication and application of early warning systems. As a component of disaster risk reduction, early warning systems in Africa have provided the information necessary to allow for early action that can reduce or mitigate potential disaster risks.
The negative influence of farm income’s choice of adaptation is contrary to studies by Deressa (2010) and Gbetibouo (2009), where income positively influenced household decision to adapt to climate change, as availability of income would allow farmers to purchase enough inputs and better varieties. Farmers with more farm income indicate farmers who are already have better income from farming. This means these farmers with higher farm incomes have no incentives of adapting than those farmers with falling or lower farm incomes. In other words, lower farm income is an incentive to adapt and need to develop resilience. Those households are realizing already that higher farm incomes have lesser incentives to adapt to newer ways of farming because their current farming practices might already be optimum. This means that if the available methods promise no better off incentives, farmers are not willing to adopt or adapt.
For communities to escape chronic poverty, they must increase their resilience to withstand shocks and hazards associated with climate change and variability (Table III). By building resilience between and throughout hazard cycles, livelihoods would be improved, and the cost and scale of future adaptation reduced. Analysis of adaptation and the need to build resilience indicated that there is a need for agriculture and structural changes in livelihood strategies in response to climate change and variability. The need for local climate information, informed by local indigenous knowledge and exogenous scientific data, has been emphasised (UNISDR, 2011). Locally researched climate smart cropping options are key to building resilience and enhancing food security at the local level (Food and Agriculture Organization, 2013).
5. Conclusion
The results from this study showed that action can be taken to build resilience to hazards and strengthen adaptive capacity to further climatic shocks. There is need to target the younger generation to increase resilience in communities. These results also showed that there is need to provide climate adaptation information through various extension services to increase resilience. Farmers have traditionally adapted to climate risk by diversifying across crops and risk management options. Farmers generally diversify their production systems by using activities that are less sensitive to drought and/or temperature stresses and activities that take full advantage of beneficial climatic conditions. For example, farmers plan their planting and inputs based on their best estimates of the cropping season, and they reduce risk exposure by diversifying their livelihoods. Farmers diversify their cropping practices using a mix of crop species both in space and time, growing different cultivars at different sowing dates and farm plots, combining less-productive drought-resistant cultivars with high-yielding but water-sensitive crops. Nevertheless, managing droughts effectively in vulnerable areas requires diversifying livelihood strategies and income generating options within and outside agriculture, especially into income generating options through non-farm enterprises and employment opportunities. This will require greater investments in infrastructure, road networks, electricity, communication and market development. Resilience can be strengthened through economic, sociological and technological interventions. The steps that need to be taken to build resilience include the anticipation of the hazard at the local level, the prevention, recovery and restoration from a hazard, balancing agricultural productivity against reducing the risk exposure.
Funding: This study was funded by the National Research Foundation of South Africa through the Research Chair: Agronomy and Rural Development, University of KwaZulu-Natal.
Conflict of interest: The authors declare that they have no conflict of interest.

