
This paper aims to dismantle the idea that sex per se explains entrepreneurial outcomes and demonstrates the influence of a gendered motivation on forging and shaping new venture teams, which is a disruptive choice affecting the future of start-ups.
A two-level research model is validated on data from the Panel Study of Entrepreneurial Dynamics II (PSED II), with a system of simultaneous equations. First, if team features affect the performance of new ventures is tested; then, the study investigates determinants of team features with a focus on sex and motivation of nascent entrepreneurs.
Human capital (HC) in terms of education and experience of team members consistently explains venture evolution only when considering the larger team of affiliates. The HC gathered by nascent entrepreneurs is not because of the simplistic sex condition, but rather to a gendered motivation related to the inferior need of achievement of women.
Limitations of discretionary scoring assigned to items of the PSED II survey are present, but unavoidable when processing qualitative data.
Women need to be (culturally) educated on how to re-balance their personal motivation towards entrepreneurship by fostering their incentives for achievement. Political and educational programmes could trigger success in the creation of new businesses led by women.
This paper contributes to the literature on nascent entrepreneurship, focusing on the entrepreneurial teams in the initial phase of business creation, and provides the basis for further studies aimed at eradicating the stereotypes of gender roles that lead women to self-exclusion and organizational errors.
Introduction
Entrepreneurial success has been frequently related to the type of actors committed to venture and the literature seems to emphasize business creation as often resulting from groups of individuals (Ben-Hafaïedh, 2017). In the words of Gartner et al. (1994), the “entrepreneur” is more likely to be plural, rather than singular (Gartner et al., 1994, p. 6).
The need for a deeper understanding of the role of entrepreneurial team is considered to be urgent, especially in terms of its contribution to the life of a business (Davidsson and Gordon, 2012; Aldrich and Kim, 2007; Zhou and Rosini, 2015; Box and Larsson Segerlind, 2018). This paper specifically studies how female nascent entrepreneurs build their start-up teams when creating new ventures and how the resulting characteristics affect successful business creation. Actually, women’s attitude in entrepreneurship and business has been confirmed as a prominent issue over the years (Berglund et al., 2018; Hisrich and Brush, 1984; Kwapisz and Hechavarría, 2018; Scott, 2009). The initial formation process of entrepreneurial team is one of the critical factors (Prytherch et al., 2012). The size of the group involved, and the quality of human capital in terms of education and entrepreneurial experience of teammates are both necessary to attract resources needed to support the initial performance, which is to become a new firm (Davidsson and Gordon, 2012). Indeed, larger and more equipped teams increase the likelihood of access to both tangible assets (e.g. financial capital) and intangible ones (e.g. social capital, skills of opportunity exploration/exploitation), as well as of being better able to cope with the complexity and uncertainty that new businesses face (Beckman and Burton, 2008; Jin et al., 2017; Schjoedt and Kraus, 2009; Zhao et al., 2013; Vissa and Chacar, 2009; Zhou and Rosini, 2015; Lee, 2019). In this sense, team formation is confirmed to be a strategic choice affecting the future of nascent firms.
One of the premises of our study is the idea that being women entails not only an obvious biological sex condition, but also a wider concept of gender. In fact, sex and gender are different constructs (Ahl, 2006). Sex distinguishes between biological characteristics of men and women, whereas gender relates to a concurring frame of environment and personal motivations constructed through social, cultural and psychological means (Bullough et al., 2014; de Bruin et al., 2006; Brush et al., 2009; Hughes and Jennings, 2012). From this perspective, motivations towards business may significantly differ between men and women (Manolova et al., 2012) and may have an impact on the decision to set up a new business as a team.
We develop a research model based on two levels of analysis, interconnected in a logical sense and coherently validated. First, we investigate if team features affect venture outcome, in terms of transition from the start-up status into the new firm condition; or, on the contrary, to a choice of quitting the project. Actually, team building behaviour is worthy of investigation if the initial start-up team does matter in achieving the entrepreneurial goal. Then, by simultaneously controlling the connection with venture outcome, we explore the determinants of team features, with a specific focus on sex and motivation. For empirical validation, we use the Panel Study of Entrepreneurial Dynamics II (PSED II), in its six-year longitudinal complete dataset, contributing with our evidence to two streams of existing literature.
First, regarding the literature on the entrepreneurial team, our paper adds focus on the very first phase of business creation, by filling the gap of knowledge on the role of founding teams to facilitate, or brake, the transition from the (informal) idea of a nascent entrepreneur into a condition of being a firm. In fact, existent entrepreneurial team research tends to consider business results of developed firms (Ben-Hafaïedh, 2017; Box and Larsson Segerlind, 2018), or it tends to offer partial and often contradictory findings motivating the call for further exploration (Davidsson and Gordon, 2012). Moreover, this paper enlarges the perspective of entrepreneurial team research by also providing new evidence on the relevance of the larger team of affiliates that we use instead of the restricted and more conventional definition of teammates.
Second, we also contribute to the literature on female entrepreneurship by exploring entrepreneurial motivations as a function of sex and we advance by deepening the gender moderation effect in the process of team formation (Held et al., 2018; Davidsson and Gordon, 2012). This paper contributes to overcome crude deductions related to sex, associated with harsh shortcuts in terms of women’s attitudes towards entrepreneurial profession, even supported by (partial) empirical evidence, such as that related to the female underperformance hypothesis (Du Rietz and Henrekson, 2000; Watson, 2002; Rosa et al., 1996; Box and Larsson Segerlind, 2018; Gatewood et al., 2009; Marlow and Patton, 2005; Klapper and Parker’s, 2011; Yang and del Carmen Triana, 2019; Hechavarria et al., 2019). Gender identities are developed consistently to biological sex, leading men and women to behave according to stereotypes (Hmieleski and Sheppard, 2019) that end up by underestimating feminine qualities in the process of new venture creation (Chamorro-Premuzic, 2014) and overestimating masculine ones (Ahl, 2004; Hmieleski and Sheppard, 2019). Self-stereotypes lead women to experience negative effects and repress self-esteem, behaving in gender-congruent ways (Cliff et al. (2005) for gender-stereotypic management styles, or Lucarelli and Brighetti (2015) for a self-attributed risk aversion of women not corresponding to their effective risk tolerance).
Studies on the differences between male and female entrepreneurs frequently fail to capture the underlying factors, linked only indirectly to sex, such as the different expectations towards business that motivate women and men. Different motivations may lead to divergent strategic choices, which can be beneficial or detrimental to venture success. Implications of our findings are relevant because we highlight the influence of a gendered motivation on forging and shaping new venture teams, which is a disruptive choice affecting the future of the venture. These results might help develop a stronger basis for managerial and policy decisions addressed to overcome gender differences in entrepreneurship, by investing, as an example, in educational programmes addressed to remove obstacles that lead women to underestimation of and/or self-exclusion from entrepreneurial professions.
The paper is organized as follows. First, we illustrate our conceptual premises on teams, performance and gender, with research questions and development of hypotheses. Then, we describe the dataset and methodological instruments. The results are presented followed by the discussion of our two-level conceptual design. Policy and educational implications conclude with future research plans.
Teams and new venture performance
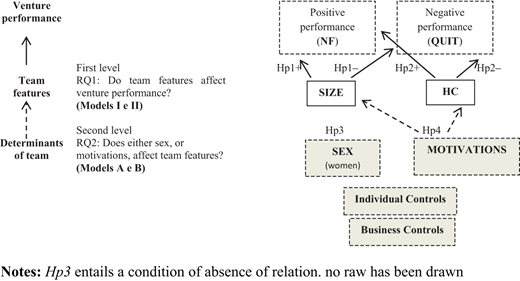
As anticipated, the research model of the paper is based on two interconnected levels of analysis (see Figure 1): first, we try to understand if the team features affect venture outcome, in terms of either transition to new firm formation, or quitting the project (first research question – RQ1). The pre-startup phase is afflicted by uncertainty and obstacles (Hopp and Stephan, 2012) and we analyze if the nascent entrepreneurs, organized in a team, have a higher probability to effectively start up a new business. After, and conditioned by this evidence, the determinants of the features of teams are explored, with a specific focus on sex and motivation (second research question – RQ2). Team features, here, are twofold: the size of the group involved, and the quality of human capital (HC) in terms of education and entrepreneurial experience of teammates.
A large proportion (around 50 per cent) of nascent entrepreneurs work in entrepreneurial teams. Researchers have examined the relationships between entrepreneurial team characteristics and outcomes (Lazar et al., 2019; Agarwal et al., 2016), but findings may appear ambiguous. On the one hand, several authors highlighted how team composition influences motivational and cognitive processes, which have a significant impact on entrepreneurial performance (de Mol et al., 2015; Delgado García et al., 2015; Jin et al., 2017; Klotz et al., 2014; Xing et al., 2019). Some empirical evidence shows a positive effect of founding team size, and the human capital of teammates on firm performance (Delmar and Shane, 2006). Box and Larsson Segerlind (2018), in particular, confirm that firms with an entrepreneurial founding team had a significantly increased survival probability, also because a team can provide faster access to resources because of the larger network (Witt, 2004). Entrepreneurs learn about and gather useful information on the environment also from other individuals committed to their venture, tapping into their experience and through them into their social network (Jack et al., 2008). Firms started by teams enjoy considerably greater success in overcoming some of the obstacles linked to mobilization of tangible and intangible resources (Cooper et al., 1994; Carter et al., 2004; Beckman and Burton, 2008). Moreover, prior founding team experience should help a new venture to overcome liabilities of newness (Delmar and Shane, 2006).
On the other hand, the entrepreneurial team can create organization and coordination problems (Parker and Belghitar, 2006) or may not have any effect (van Gelderen et al., 2005) or can be a source of conflict and uncertainty which may lead to the dissolution of the venture (Khan et al., 2014).
Moving towards specific team features, the quantitative side in our study is its size, i.e. the number of members. Research on the relationship between entrepreneurial team size and the performance of new ventures is not just hearsay: some authors suggest a positive relationship between large teams and performance (Hmieleski and Ensley, 2007), because of the fact that larger teams can guarantee more access to information and resources and it is associated with higher firm growth (Feeser and Willard, 2006; Colombo and Grilli, 2005; Haleblian and Finkelstein, 1993) . Venture capitalists and banks are more likely to provide support for teams of entrepreneurs (Beckman et al., 2007). Moreover, team size increases the impact of specialization and, in turn, the performance (Sine et al., 2006).
Individuals in teams collaborate more as team size increases (Mao et al., 2016), and when the size is an inevitable passage that induces diversity of the team, or leads to its heterogeneity (Cui et al., 2019), size can represent a trigger for business performance (Bass, 2019).
However, the literature is not unequivocal on the role of team size for firm performance. Many studies on team processes show that large teams are more likely to have disagreements on firm strategy with higher coordination costs for resolving these disagreements. Large teams require greater monitoring and coordination to maintain productivity (Liang et al., 2008). Large teams may experience conflicts and become ineffective (Chowdhury, 2005). This results in an inverted U-shaped relationship between effort and team-size (Backes-Gellner et al., 2004).
All things considered, based on the majority (but not unanimous) of evidence, we present the first hypothesis of the paper in response to the first research question:
The larger the size of the team, the higher the probability of a positive evolution into a new firm, and the lower the probability of a negative evolution into disbandment.
The qualitative feature of the team here is the underlying human capital given by members of the team itself, with their expected ability to gauge the environment and capture critical resources. The specific individual education, skills and experience that each actor brings to the venture constitute the HC embedded in the team (Unger et al., 2011; Jin et al., 2017). Members of the team with a high level of education can have a better capability of managing the business and are more able to take important decisions compared to those who know nothing of business and economy.
Davis et al. (2009) report that the unique contributions provided by team members is a good predictor of subsequent start-up outcomes; others find significant influence in terms of team background and experience (Larson and Starr, 1993; Beckman and Burton, 2008). Prior industry experience provides entrepreneurial teams with knowledge of markets, suppliers and industry conditions and this holds a significant relationship with new venture success (Delmar and Shane, 2003). Klotz et al. (2014), in their review of literature on venture team, show that teams with members that share the same prior experience make quick and unified decisions and this creates an advantage for the start-up in a turbulent industry context (Baum and Wally, 2003; Kor, 2003) or can be positively related to the strategic choice of market entry (Fern et al., 2012).
Here, we present the second hypothesis:
The stronger the HC underlying the team, the higher the probability of a positive evolution into a new firm, and the lower the probability of a negative evolution into disbandment.
How do women behave in forging their start-up teams?
The second level of analysis is the investigation of whether the sex of nascent entrepreneurs, and/or associated factors, such as business motivation, influence the features of teams being forged by them (second research question – RQ2; see Figure 1). Recent papers try to assess the role of gender in composition of founding teams. However, existing studies do not really provide evidence on the process through which gender impacts on team formation and new venture performance (Ben-Hafaïedh, 2017). Box and Larsson Segerlind (2018) show that the analysis of the effect of different gender compositions leads to mixed results: the hypothesis of a lower survival probability for all-female teams only receives weak support, whereas the authors find the strongest negative effect only for female solo start-ups.
Weakness of expectations related to sex per se has been shown, among others, by Cesarini et al. (2010) and by Cesarini et al. (2009), who use identical twins as a proxy of genetic similarity to partition risk-behaviour variance and covariance into genetic and environmental sources. They find that genetic differences can explain about 20 per cent of individual variations in risk preference. Conversely, 80 per cent of the variation in individual economic and financial decisions are found to be because of other non-genetic (hence, non-sex-based) factors. Limited relevance of the biological condition of sex, especially in economic and financial decisional domains, leads to the third hypothesis of our analysis:
Sex, as a purely biological condition, does not significantly affect start-up team features.
We intentionally (and provocatively) propose H3 in contrast to empirical evidence on lower participation of women in the entrepreneurial profession, or their weak business success (Rosa et al., 1996; Du Rietz and Henrekson, 2000). Evidence from the last Global Entrepreneurship Monitor report (Bosma and Kelley, 2019) shows that, globally, there are seven women entrepreneurs for every ten men entrepreneurs, and highlights that Europe and North America have many economies with a strong lack of gender equality in terms of Total early-stage Entrepreneurial Activity (TEA) Rates (number of nascent entrepreneurs/adult population). One potential reason for the underrepresentation of women among entrepreneurs could be the fact that women might be less likely to act on their entrepreneurial intentions (Haus et al., 2013). Among others, Krueger et al. (2000) argue that entrepreneurial activities can be predicted more precisely by analyzing intentions rather than personal characteristics because of the fact that intentions predict start-up behaviours. Studying the impact of intention on action is important in the context of women entrepreneurship because of the fact that the intention–behaviour link is moderated by sex (Shinnar et al., 2018; Haus et al., 2013). Generally, woman have strong entrepreneurial intention in industries considered feminine (Gupta et al., 2009; Kelley et al., 2017) or women can have the same intention as men but less propensity to carry out this intention (Henry et al., 2016).
Literature suggests that the personal motivation to entrepreneurship is a dominant drive because of the link between intention and action (Bird and Schjoedt, 2009), as motivation guides a person to adopt certain behaviour in view of a specific goal (Aldrich and Martinez, 2001; Carsrud and Brännback, 2011; Fayolle and Linan, 2014). Motivation regarding business may significantly differ, in particular, between men and women (Maes et al., 2014; Manolova et al., 2012). Indeed, gender differences are more likely in the preference stage (intentions) than in the action stage (entrepreneurial activity), as reported in Verheul and Thurik (2001).
Hughes (2006) categorizes women’s start-up motivations into classic motivations (financial opportunity, challenging work, independence); forced motivations, such as unemployment, job loss or lack of work opportunities; and work–family motivations, such as the need to balance family and work, and to have a more flexible work-schedule. Women exhibit more family-related motivations than men, particularly when they have children (DeMartino et al., 2006).
In the same vein, Maes et al. (2014) suggest that men are more concerned with achievement attributes(income, challenge, etc.), whereas women are more prone to balance attributes related to getting organized (autonomy, work–life balance). Considering the gender aspect of motivation towards entrepreneurship, we propose the fourth, and conclusive, hypothesis of the paper:
Motivations significantly affect start-up team features.
Methods
The dataset
The PSED II offers data for the empirical analysis. PSED II contains information on 1,214 nascent entrepreneurs[1] and this initial pool was longitudinally followed through their venture progression for five years since the initial questionnaire (initial Wave A and following Waves B, C, D, E, F); the original number of entrepreneurs drops in the subsequent waves because of non-response (Gartner and Shaver, 2012).
PSED II identifies three groups of actors participating in the start-up team:
owners, that is, people or other businesses sharing ownership of the new venture;
key not-owners, that is, people or other businesses making a distinctive contribution to the founding of the new venture (without sharing ownership); and
helpers[2], that is, people or other businesses providing regular support to the new business (without sharing ownership).
Data on teams and their evolution over time come from the respondents, considered as the nascent entrepreneurs and excluded from team measures. Coherently, “solo” entrepreneurs have been excluded (according to Brannon et al., 2013), leaving 663 respondents relying on teams, i.e. nascent entrepreneurs with at least one co-owner/key not-owner/helper.
For the assessment of the start-up outcome, PSED II asks respondents to categorize the status of their new venture in each follow-up wave, according to criteria outlined in Reynolds and Curtin (2008): new firm, if the firm is up and running; start-up, if the new venture is still in the start-up process; quit, if the respondent self-identifies as disengaging from the process[3]. Summary statistics of the performance of these ventures, across years, are reported in Table I, distinguishing male and female nascent entrepreneurs.
Venture’s performance across years
| Time (year) | Wave 1 | Wave 2 | Wave 3 | Wave 4 | Wave 5 | Wave 6 |
|---|---|---|---|---|---|---|
| NF | 72 | 90 | 87 | 95 | 91 | |
| (% on Total) | 10.9% | 19.1% | 25.9% | 35.8% | 38.6% | |
| Women | 25 | 29 | 28 | 35 | 35 | |
| (% on NF) | 34.7% | 32.2% | 32.2% | 36.8% | 38.5% | |
| QUIT | 193 | 134 | 71 | 29 | 31 | |
| (% on Total) | 29.1% | 28.5% | 21.1% | 10.9% | 13.1% | |
| Women | 90 | 55 | 29 | 9 | 8 | |
| (% on QUIT) | 46.6% | 41.0% | 40.8% | 31.0% | 25.8% | |
| Total | 663 | 663 | 470 | 336 | 265 | 236 |
| Women | 264 | 264 | 174 | 119 | 90 | 81 |
| 39.8% | 66.3% | 70.7% | 66.9% | 63.8% | 71.1% |
Notes:
Information on venture’s performance is available from the second year of the PSED (Wave/Time 2). At Wave/time 1, the sample includes 663 ventures, with 264 of them belonging to women’ project
In the initial sample of 663 ventures, women are 264 corresponding to 39.6 per cent of the total, supporting the knowledge of the inferior participation of women in new venture creation; the percentage of women quitting ventures is much higher (from 46.6 per cent in Time 2 to 40.8 per cent in Time 4) than the percentage of those who have led their venture into a new firm (from 34.7 per cent in Time 2 to 32.2 per cent in Time 4, see Table I).
Definition of team and criteria for calculations
The literature contains numerous differing definitions of entrepreneurial teams (Schjoedt and Kraus, 2009). Typically, literature adopts a restrictive definition of entrepreneurial team, as the group of founders who frequently share the ownership of the new venture (teammates).
In this paper, consistently with Gartner et al. (1994), Klotz et al. (2014) and Schjoedt and Kraus (2009), we innovate by introducing also a more extensive definition of a start-up team, which includes various supporters of the owners (called affiliates), such as organizational decision makers, family members and advisors (not only owners, but also key not-owners and helpers, using PDES II categories). Affiliates may provide critical resources for successfully developing the new business, in terms of tangible resources (financial capital) and intangible resources (social capital, human capital, technical and managerial competences, skills of opportunities’ exploration/exploitation).
Consider the start-up having Nown owners, Nkno key not-owners and Nhelp helpers. The size of the team is equal to Nown (number of owners) for the limited definition of team (teammates); for the extensive team of affiliates, it is:
The qualitative features of the team depend on its underlying HC, in terms of education and experience. In assigning a value to the HC variable, we follow the definition put forth in previous studies on aggregate team HC (Delmar and Shane, 2003; Dimov, 2017; Unger et al., 2011) complementing their approach with information from the PSED II dataset. Each actor of the team exhibits some specific characteristics, which represent the level of HC provided by the actors themselves. As a consequence, we obtain the measure HC of the human capital provided.
The j-th generic characteristic of an owner will be denoted by Oj. Analogously, Kh and Hm are the generic characteristics of a key not-owner and a helper, respectively. Each characteristic varies within a range of values, and each actor is associated to a specific value for each characteristic. The value of the characteristics Oj, Kh and Hm for the n-th actor will be denoted by oj(n), kh(n) and hm(n), respectively.
In line with the assumption that the more resources are provided, the better it is for the business (Stewart, 2006), the HC of the start-up is defined as the sum of the values of all the HC characteristics of the actors of the start-up. Therefore,
Appendix displays the variables used to calculate SIZE (Table AI) and HC (Table AII), in line with equations (1) and (2) formula, respectively, starting from raw data of the PSED II questionnaire; winsorization copes with response distribution. Table AII, specifically, indicates the list of variables involved in equation (2). The rationale for selection of PSED II questions refers to their capacity to indicate the HC of affiliates, i.e. their ability to bring resources, such as information or tacit knowledge, into the new business.
PSED variables used to calculate SIZE
| Variable | Description | PSED II – All waves |
|---|---|---|
| Nown | Total number of other owners (excluding the respondent) | *g2 |
| Nkno | Total number of key not owners | *g13 |
| Nhelp | Total number of helpers | ag18 |
Notes:
^1: because of the presence of outliers featuring a considerable number of owners, variables are winsorized at 0.01; *stands for the given wave; e.g. for Wave a, we refer to question ag2; for Wave b, question bg2; and so on
PSED variables used to calculate HC
| Variable | Description | PSED II – All waves |
|---|---|---|
| Legal entity | Dummy variable: it takes the value of one if the owner, key not-owner or helper represents a business, financial institution, government agency or other legal entity | |
| Education | Highest level of education of the owner, key not-owner or helper (1 = up to eighth grade, 2 = some high school, 3 = high school degree/tech. or voc. degree, 4 = some college/comm. college degree, 5 = bachelors degree, 6 = some graduate training, 7 = masters degree, 8 = law, Md, Phd, Edd degree) | |
| Industry experience | Years of work experience of owner, key not-owner or helper in the industry where the new business is going to compete. Categorical variable from 0 to 6, by year (Y): 0 for 0Y; 1 for 0 < Y < 1; 2 for 1< | |
| Business helped | Number of other businesses helped to start by the owner, key not-owner or helper | |
| Manager experience | Years of owner#’s work experience as a manager or supervisor. Categorial variable from 0 to 6, by year (Y): 0 for 0Y; 1 for 0 < Y < 1; 2 for 1< | |
| Owners | ||
| O_Legalentity | *g5_O# | |
| O_Education | *h6_O# | |
| O_Industryexperience | *h11_O# | |
| O_Business helped | *h12_O# | |
| O_Manager experience | *h21_O# | |
| Key Not Own. | ||
| K_Legalentity | *g15_k# | |
| K_Education | *m7_k# | |
| K_Industryexperience | *m11_k# | |
| K_Business helped | *m12_k# | |
| Helpers | ||
| H_Legalentity | ag20_h# | |
| H_Education | an7_h# | |
| H_Industryexperience | an11_h# | |
| H_Business helped | an12_h# | |
Notes:
^1: because of the presence of outliers, variables other than dummy or categories are winsorized at 0.01; *stands for the given wave; e.g. for Wave a, we refer to question ag5_O#; for Wave b, question bg5_O#; and so on
Team-building behaviour is necessarily dynamic as new relations may be continuously created or dissolved. For this reason, we calculate both team features (SIZE and HC) at the beginning of the process (Wave A) and then update them yearly based on new information provided by the respondents in the following five waves (Waves B, C, D, E, F).
Definition and calculations of motivation variables
Motivation is widely recognized by literature as one of several factors with impact on the behaviour of nascent entrepreneurs and on the development of the business creation process. Based on existing motivation theories, motivational factors can be divided into pull and push factors (Maes et al., 2014; Carter et al., 2003).
We opt for a data-driven classification of motivations, based on Section W: Respondents’ motivation of the PSED II dataset. We use exploratory principal component analysis (PCA) to identify the underlying structure of entrepreneurial motives and determine which indicators are associated with each factor. We retain all factors with an eigenvalue greater than unity. This results in four factors that retain 62 per cent of the total variance in the original data. The reliability of the procedure is computed using the Kaiser–Meyer–Olkin measure of sampling adequacy that returns a value of 0.8223. We then associate each factor with those variables that have a loading that exceeds 0.40 in absolute value (see Table II).
Factor analysis on PSED II motives for starting a new business
| PSED question (Section W) | Motivation | |||
|---|---|---|---|---|
| Money | Social Recognition | Achievement | Freedom | |
| Factor1 | Factor2 | Factor3 | Factor4 | |
| aw1: higher position in society | ||||
| aw2: flexibility for personal and family life | 0.6226 | |||
| aw3: continue a family tradition | 0.6237 | |||
| aw4: respected by friends | 0.4107 | |||
| aw5: freedom to adapt your own approach | 0.7220 | |||
| aw6: financial security | 0.4308 | |||
| aw7: follow the example of a person you admire | 0.4308 | |||
| aw8: build a business for children | 0.4127 | |||
| aw9: larger personal income | 0.5769 | |||
| aw10: achieve and be recognized | 0.4818 | |||
| aw11: develop an idea for a product | 0.5433 | |||
| aw12: great wealth/high income | 0.5509 | |||
| aw13: power to greatly influence an organization | 0.4931 | |||
Notes:
This table indicates the loading values on motivation variables for each of the four factors identified from the principal component analysis. We retain variables where the absolute value of the loading exceeds 0.4
The first component is related to an underlying motivation linked to Money (“aw9: larger personal income”, load of 0.5769; “aw12: great wealth/high income”, load of 0.5509; “aw6: financial security”, load of 0.4308). The second component includes motivations related to the social environment of entrepreneurs and the role models in the family; therefore, it has been named social recognition (“aw3: continue a family tradition”, load of 0.6; the other three variables, “aw4: respected by friends”, “aw7: follow the example of a person you admire”, “aw8: build a business for children”, loads around 0.40). The third factor is related to motivations linked to striving for power, recognition, self-representation and development of own ideas; this factor has been referred to need for achievement (“aw11: develop an idea for a product”, load of 0.5433; “aw13: power to greatly influence an organization”, load of 0.4931; and “aw10: achieve and be recognized”, load of 0.4818). Finally, the fourth factor is referred to desire for freedom and independence; thus, it is, namely, Freedom (“aw2: flexibility for personal and family life”, load of 0.6226; “aw5: freedom to adapt your own approach”, load of 0.7220).
In a further multivariate frame, the four motivational score-variables (MONEY, SOCIAL RECOGNITION, ACHIEVEMENT AND FREEDOM) are summarized in the vector M.
Control variables
A first control refers to the presence of team members belonging to the same family of respondents, as this aspect could have some influence on venture performance (Chell and Baines, 1998). Thus, the FAMILY TEAM (binary) variable is added, capturing whether at least one member of the team is a relative.
The further set of variables represents standard controls (see Table III). Indeed, as discussed in Robb and Watson (2012), gender differences may be misrepresented if demographic controls are neglected, causing gender to be merely a proxy for unobserved characteristics.
Descriptive statistics
| Whole sample | Women sample | |||||||||
|---|---|---|---|---|---|---|---|---|---|---|
| Variables | Obs | Mean | SD | Minimum | Maximum | Obs | Mean | SD | Sign | |
| Restricted team (teammates) | ||||||||||
| SIZE | 1,970a | 0.892 | 1.426 | 0 | 10 | 728a | 0.712 | 0.979 | *** | Total number of teammates |
| HC | 1,970a | 1.300 | 1.702 | 0 | 10.183 | 728a | 1.163 | 1.611 | *** | Score for HC of teammates |
| Family team | 2,175a | 0.416 | 0.493 | 0 | 1 | 801a | 0.398 | 0.490 | Dummy = 1 if there is any relative in the team | |
| Wide team (affiliates) | ||||||||||
| SIZE | 1,970a | 3.582 | 3.494 | 0 | 27 | 728a | 3.400 | 3.616 | ** | Total number of affiliates |
| HC | 1,970a | 3.636 | 2.904 | 0 | 18.653 | 728a | 3.392 | 2.892 | *** | Score for HC of affiliates |
| Family team | 2,175a | 0.676 | 0.468 | 0 | 1 | 801a | 0.695 | 0.461 | * | Dummy = 1 if there is any relative in the team |
| Correlation SIZE-HC teammates | 75.41 | |||||||||
| Correlation SIZE-HC affiliates | 66.64 | |||||||||
| Motivations | ||||||||||
| Money | 655 | 0.042 | 1.531 | −3.61907 | 3.523176 | 260 | −0.083 | 1.601 | ** | Factor 1 score using PCA on PSED II -Sect. W |
| Social recognition | 655 | 0.018 | 1.462 | −2.039372 | 5.178822 | 260 | −0.089 | 1.387 | * | Factor 2 |
| Achievement | 655 | −0.036 | 1.317 | −3.216376 | 3.895823 | 260 | −0.109 | 1.329 | * | Factor 3 |
| Freedom | 655 | 0.026 | 1.218 | −3.685922 | 2.185493 | 260 | 0.174 | 1.172 | *** | Factor 4 |
| Individual controls | ||||||||||
| Education | 663 | 0.568 | 0.180 | 0 | 1 | 264 | 0.562 | 0.161 | Level of formal education of the startupper | |
| White | 663 | 0.852 | 0.355 | 0 | 1 | 264 | 0.845 | 0.363 | Dummy = 1 if the start-upper is white | |
| Black | 663 | 0.100 | 0.300 | 0 | 1 | 264 | 0.129 | 0.336 | ** | Dummy = 1 if the start-upper is black |
| Indian | 663 | 0.054 | 0.227 | 0 | 1 | 264 | 0.045 | 0.209 | Dummy = 1 if the start-upper is indian | |
| Business controls | ||||||||||
| Freq. | (%) | Freq. | (%) | |||||||
| Retail store | 84 | 12.67 | 47 | 17.8 | *** | |||||
| Restaurant | 24 | 3.62 | 8 | 3.03 | ||||||
| Consumer service | 237 | 35.75 | 107 | 40.53 | *** | |||||
| Health service | 43 | 6.49 | 25 | 9.47 | *** | |||||
| Manufacturing | 39 | 5.88 | 13 | 4.92 | *** | |||||
| Construction | 36 | 5.43 | 5 | 1.89 | *** | |||||
| Agriculture | 34 | 5.13 | 9 | 3.41 | *** | |||||
| Mining | 1 | 0.15 | 0 | 0 | * | |||||
| Wholesale distribution | 27 | 4.07 | 8 | 3.03 | * | |||||
| Transportation | 11 | 1.66 | 3 | 1.14 | ||||||
| Utilities | 1 | 0.15 | ||||||||
| Communications | 15 | 2.26 | 7 | 2.65 | ||||||
| Finance | 12 | 1.81 | 4 | 1.52 | ||||||
| Insurance | 6 | 0.9 | 4 | 1.52 | *** | |||||
| Real estate | 40 | 6.03 | 16 | 6.06 | ||||||
| Business consulting services | 53 | 7.99 | 8 | 3.03 | *** | |||||
| Total | 663 | 100 | 264 | 100 | ||||||
Notes:
aNumber of observations refers to number of entrepreneurs for all the waves observed. Selection of variables included in the multivariate analysis. For computation of Team variables, see Appendix AI. *p < 0.1; **p < 0.05; ***p ≤ 0.01
Individual controls (IK) refer to characteristics of the entrepreneur, such as education or racial background, and may reflect the extent to which the entrepreneur has had the opportunity to develop relevant skills and contacts (Cooper et al., 1994). This may influence the social environment of the nascent entrepreneur and in turn the possibility to reach people, and gather teams, to contribute to the business creation process.
Business controls (BK) related to business demographics are finally added. In line with Ahl (2006), controlling for industry is essential in any gender-based comparison, because of the fact that female business ownership is concentrated primarily in the retail and service industries and these businesses are relatively small in terms of employment and may require a different (smaller) start-up team configuration.
Analysis
The two interconnected levels of analysis have been jointly considered by estimations, within a system of simultaneous equations. Precisely, the two research questions of Figure 1 have been answered by means of a system of two sets of equations, where the dependent variables of the first set are then included as independent variables in the second set. Specifically, team features (SIZE and HC) are variables tested to predict venture performance that can be either NEW FIRM (NF) in Model I, or venture abandonment (QUIT) in Model II. Moreover, team features become dependent variables in Models A (for SIZE) and B (for HC). Business controls (BK) and Year controls (YK) are introduced in all the equations. In the second level of analysis (i.e. models A and B), besides controlling for the presence of any familiar component in the team (FT), individual control (IK) is added. Moreover, Models A and B alternatively consider only the variable “women” to indicate the sex of the respondents (Models A.1 and B.1) or in addition the vector M indicating motivation and resulting from the preceding PCA.
Results
Descriptive statistics
Table III contains descriptive statistics and bivariate gender comparison for the full set of variables of the study sample. The original 663 nascent entrepreneurs holding a team in Wave A are then tracked in subsequent years, corresponding to Waves from B to F, resulting in a final dataset of 1970 individual-year observations.
With respect to the team features, on average, women-led nascent ventures rely on smaller teams than men’s ones, in terms of SIZE, and are under-equipped in terms of HC. This holds true when considering both teammates (mean values of SIZE 0.892[4] and HC 1.300 for teams of the whole sample, SIZE 0.712 and HC 1.163 for teams of female nascent entrepreneurs) and affiliates (SIZE 3.582 and HC 3.636 for the whole sample, SIZE 3.400 and HC 3.392 for women), given the statistical significance of bivariate mean comparisons (always p < 0.001; p < 0.05 for SIZE of affiliates).
SIZE and HC appear strongly correlated, both in the restricted team of teammates (correlation coefficient equals 75.41) and in the wider team of affiliates (correlation coefficient equals 66.64). This is mainly because of the additive approach used in their calculation, and motivates the choice of using these variables alternatively in the first level of analysis, resulting in the split of Models A and B. Remaining correlations of descriptive variables are well within acceptable ranges[5].
As far as the business is concerned, it is noticeable from Table III that some sectors show a statistically higher participation of women (precisely, retail store, consumer and health service and insurance); others show an opposite situation of inferior female participation (manufacturing, construction, agriculture, mining, whole sale distribution and business consulting).
Among motivation variables, FREEDOM Factor 4 of PCA is significantly higher (1.172) for female nascent entrepreneurs than for the whole sample for which it is 0.026 (p < 0.01). Conversely, MONEY, SOCIAL RECOGNITION and ACHIEVMENT are statistically lower for women: −0.083, −0.089 and −0.109, respectively, for women, against 0.042 (p < 0.05), 0.018 (p < 0.1) and −0.036 (p < 0.1) for the whole sample.
Results of hypothesis testing
A system of simultaneous equations is carried out to test hypothesis; for the first level of analysis, we used probit regressions because the dependent variables are binomial (NF, in Model I and QUIT in Model II – Table IV).
Team features and venture’s performance – first level
| Dependent var | Panel a (teammates) | Panel b (affiliates) | ||||||
|---|---|---|---|---|---|---|---|---|
| NF | NF | QUIT | QUIT | NF | NF | QUIT | QUIT | |
| Model | (I.A) | (I.B) | (II.A) | (II.B) | (I.A) | (I.B) | (II.A) | (II.B) |
| SIZE | −0.0026 | 0.0143 | 0.0133 | −0.0188* | ||||
| HC | 0.0165 | 0.0015 | 0.0319*** | −0.0697*** | ||||
| Business controls | Yes | Yes | Yes | Yes | Yes | Yes | Yes | Yes |
| Year controls | Yes | Yes | Yes | Yes | Yes | Yes | Yes | Yes |
| Constant | −0.4064*** | −0.4294*** | −0.9152*** | −0.9081*** | −0.4671*** | −0.5496*** | −0.8300*** | −0.6168*** |
| N | 1,978 | 1,978 | 1,978 | 1,978 | 1,978 | 1,978 | 1,978 | 1,978 |
| Log-likelihood | −2,865.77 | −2,816.992 | −2,934.89 | −2,886.112 | −4,973.77 | −4,913.069 | −5,042.305 | −4,981.604 |
| AIC | 5,823.54 | 5,733.984 | 5,961.78 | 5,872.223 | 10,039.54 | 9,926.138 | 10,176.61 | 10,063.21 |
| BIC | 6,080.673 | 6,013.476 | 6,218.913 | 6,151.715 | 10,296.67 | 10,205.63 | 10,433.74 | 10,342.7 |
Notes:
AIC: Akaike’s information criterion; BIC: Bayesian information criterion; N. = Obs used in calculating BIC. *p < 0.1; **p < 0.05; ***p ≤ 0.01
In the second level of analysis (Table V), determinants of SIZE (Model A) are obtained through estimations of a Poisson function, because the dependent variable is a discrete number (of teammates or affiliates); conversely, determinants of HC (Model B) derive from an ordinary least square regression, as the dependent variable is a continuous measure. Determinants of team features are explored with attention to sex of the nascent entrepreneurs. Note that the WOMEN variable is used, both singularly, with the remaining controls (Model 0.1 of Table V), and together with the MOTIVATION scores (Model 0.2 of Table V). The overall set of models has been estimated for teammates (Panel a) and for affiliates (Panel b).
Determinants of team features – second level
| Dependent var | Panel a (teammates) | Panel b (affiliates) | ||||||
|---|---|---|---|---|---|---|---|---|
| SIZE | SIZE | HC | HC | SIZE | SIZE | HC | HC | |
| Model | A.1 | A.2 | B.1 | B.2 | A.1 | A.2 | B.1 | B.2 |
| Woman | −0.3141*** | −0.2658*** | −0.1368 | −0.0643 | −0.1193*** | −0.0984*** | −0.3030* | −0.2327 |
| Family team | 0.9004*** | 0.8648*** | 1.4801*** | 1.4651*** | 0.0159 | 0.0069 | 0.2924* | 0.3006* |
| Education | 1.2627*** | 1.1007*** | 1.5091*** | 1.5113*** | 0.2905*** | 0.3448*** | 2.7457*** | 2.8698*** |
| White | −0.0239 | −0.0017 | 0.1235 | 0.1566 | −0.1197** | −0.1000* | −0.2943 | −0.2258 |
| Black | −0.2721* | −0.18 | −0.2458 | −0.2231 | 0.1095* | 0.074 | −0.156 | −0.3739 |
| Indian | −0.0022 | 0.0156 | −0.0783 | −0.018 | −0.1053* | −0.0986 | 0.2717 | 0.2943 |
| Money | −0.0135 | 0.0652** | 0.0064 | 0.0721 | ||||
| Social Recognition | −0.0501** | −0.0472 | 0.0445*** | 0.087 | ||||
| Achievement | 0.0484** | 0.0348 | 0.0483*** | 0.2480*** | ||||
| Freedom | −0.1614*** | −0.1725*** | −0.0315** | −0.0552 | ||||
| Business controls | Yes | Yes | Yes | Yes | Yes | Yes | Yes | Yes |
| Year controls | Yes | Yes | Yes | Yes | Yes | Yes | Yes | Yes |
| constant | −1.6765*** | −1.5217*** | −0.4901* | −0.5176* | 1.4649*** | 1.3928*** | 2.9537*** | 2.6359*** |
| N | 1,978 | 1,978 | 1,978 | 1,978 | 1,978 | 1,978 | 1,978 | 1,978 |
| Log-likelihood | −3,692.142 | −3,651.922 | −3,761.819 | −3,721.599 | −4,637.277 | −4,585.453 | −4,696.388 | −4,644.564 |
| AIC | 7,478.284 | 7,405.843 | 7,617.638 | 7,545.198 | 9,368.554 | 9,272.907 | 9,486.776 | 9,391.128 |
| BIC | 7,741.007 | 7,690.925 | 7,880.361 | 7,830.28 | 9,631.277 | 9,557.988 | 9,749.498 | 9,676.21 |
Notes:
AIC: Akaike’s information criterion; BIC: Bayesian information criterion; N. = Obs used in calculating BIC. *p < 0.1; **p < 0.05; ***p ≤ 0.01
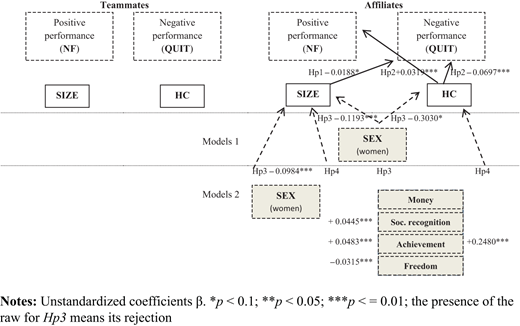
Figure 2 shows the comprehensive results for the two-level research model of the paper.
Team features and start-up evolutions
Table IV indicates that team features are not predictors of venture performance when considering the limited group of owners (Panel a): neither the number of teammates, nor their qualification in terms of education and experience, is shown to significantly affect the probability that a start-up develops into a new firm, or that it is abandoned. For teammates, H1 is rejected (no relation in Figure 2, left chart).
Opposite results are obtained when considering the wider definition of team (Panel b), which includes also key not-owners and helpers: HC, meaning a qualified team of affiliates, significantly increases the probability that the venture develops into a new firm (coeff. 0.0319, p < 0.01), and decreases the probability of disbandment (coeff. −0.0697, p < 0.01). The SIZE of affiliates team holds a limited influence, only reducing the probability of quitting the venture (coeff. −0.0188, p < 0.01). Summing up, for affiliates, H1 is accepted only when considering the case to disbandment; conversely, a consistent support is obtained in favour of H2, as HC endowments of the wide set of owners, key not-owners and helpers favour both the development of the start-up into a new firm, and reduce quits (relations in Figure 2, upper right side).
Determinants of team features
The relation between team features and venture outcomes is the foundation of the research model of this paper. Thus, absence in the first level of analysis of significant relationships for teammates imposes to disregard results of Table V – Panel a. Results to test H3 and H4 are limited to estimates exposed in Panel b (affiliates, right side of Table V), and coherently drawn in Figure 2, lower right side.
When excluding the MOTIVATION scores, that is in Model 0.1, the WOMEN variable is significant and negative, both in Specification A (dependent variable SIZE, coeff. −0.1193, p < 0.01) and in Specification B (dependent variable HC, coeff. −0.3030, p < 0.10). Thus, the hypothesis of absence of influence of sex on shaping size and qualification of start-up teams (H3) is rejected.
Nevertheless, when the WOMEN variable is included together with the vector of motivations M, evidence for testing H3 is contradictory: the sex of the nascent entrepreneur continues to be significant when related to the SIZE of the team (coeff. −0.0984, p < 0.01, Specification A.2). On the contrary, its statistical significance disappears when referring to HC of the team (i.e. in Specification B.2), in favour of the strong significance of the motivation variable ACHIEVEMENT (coeff. 0.2480, p < 0.01). Therefore, H3 is accepted when, and because, H4 is accepted. This means that the qualification of the wide team of affiliates recruited in the venture does not depend on the sex per se of the nascent entrepreneur, but on her personal motivations. That is, on her desire for achievement.
Marginally, three out of the four motivation scores affect the SIZE (Specification A.2) of the team of affiliates: two of them with a positive sign, i.e. SOCIAL RECOGNITION (0.0445, p < 0.01) and ACHIEVEMENT (0.0483, p < 0.01); the latter, with a negative one, i.e. FREEDOM (−0.0315, p < 0.01)[6].
Discussion
The analysis of factors affecting the probability that nascent entrepreneurs are successful in starting up their new business is of considerable academic and political interest (Lichtenstein et al., 2007). Answering the call of Davidsson and Gordon (2012) of deeply investigating the new business formation at team level, with this paper, we focus on the moderator effect of gender on team formation during the specific pre-startup phase.
Summary statistics of PSED II data show that teams forged by female nascent entrepreneurs appear smaller and less equipped in terms of education and experience. This paper aims to overcome raw deductions related to sex, because simplified associations cause a socially constructed “gendered behaviour” that reinforces the accumulation of socially constructed stereotypes (Stedham and Wieland, 2017; Ahl, 2006). Gender stereotypes may distort women’s inclination towards entrepreneurial professions, with self-exclusion and a perceived inferior entrepreneurial orientation (Fellnhofer et al., 2016). According to Hmieleski and Sheppard (2019), entrepreneurship cannot be easily reduced into traditional stereotypes, even if entrepreneurship has been considered a stereotyped activity across many cultures. This has reinforced a bias in which women are viewed as less equipped in terms of personal characteristics to have success as entrepreneurs.
To dismantle simplistic sex associations, the paper investigates the team-building behaviour of female nascent entrepreneurs (RQ2), after proving that the forging of teams is an initial disruptive choice for new venture performance (RQ1).
Does a team affect start-up evolution?
Empirical evidence offers a puzzled response to RQ1: teams limited to owners have no effect on start-up evolution, depending neither on how many their components are, nor on how qualified they are. Regardless of the strong impact, this result confirms the outcomes shown by Arenius et al. (2017), based on a comparable dataset, which included the start-up team organization among the individual gestation activities that were shown not to be a necessary condition for firm emergence.
On the contrary, our empirical analysis shows that the wider team of affiliates influences the future development of the start-up. The numerosity of the team decreases the probability of quitting and is in favour of the positive role of size on outcome, supporting the majority, but not unanimous, of evidence of previous literature (among other, Bass, 2019). Even better, the experience and qualification of team members both increase the transition of ventures into new firms and decrease disbandment from business projects. This importance of human capital is definitively in line with previous findings in the literature (among other, Kim et al., 2006; Lee, 2019; Unger et al., 2011).
Concise deductions are twofold: first, multiple owners of a start-up do not influence its future if simply represented by “how many” or “how much they are qualified”. It is reasonable to deduce that the formal agreement to share ownership is valuable if related to “how much money” owners put on the business idea. Numerosity of owners is not necessarily related to the amount of money raised (consider crowdfunding, with thousands of owners with a very small investment each); nor does the owners’ education and experience necessarily give their expected valuable contribution to the business.
On the contrary, the wide group of affiliates, including key non-owners and helpers, provides inherently intangible contributions, and results show that these teams hold a strategic role for the new venture’s future. HC endowments of a large set of affiliates favour the development of the start-up into a new firm and reduce the probability of quitting. It is not surprising to find evidence that the “number” of actors does not exert per se a positive influence on the continuation of the start-up, unless specific human capital contributions, such as higher industry and business experience or higher education, are in place. These results appear substantially in line with Levie and de Borst (2017) and Jin et al. (2017), mainly when they find higher growth expectation where teammates have higher education levels, even if our findings are in favour of this relationship being supported by the wider team of affiliates.
Which are the drivers of the quantitative and qualitative features of teams?
Sex is important for influencing the size of teams, besides a list of motivations with an opposite influence: a positive one, for social recognition and achievement, and a negative one, for freedom. Nevertheless, team size uniquely affects (specifically reduces) the probability of quitting.
On the contrary, sex ceases to be relevant when focusing on what is most relevant, namely, enrolling highly educated and experienced team members. The provocation proposed with H3 can be responded. The nascent entrepreneurs, regardless of their gender, when they are motivated by a strong need for success, demonstrate being able to assemble their affiliates with high standards of HC, as this team quality is crucial for the initial performance of the start-up, by both increasing probability of development into a viable firm, and decreasing abandonments. Thus, motivations of nascent entrepreneurs have a significant and positive impact on venture success (Baum and Silverman, 2004; Hechavarria et al., 2012; Zhao et al., 2013). Results are also in line with Maes et al. (2014), and the concept that motivation is helpful in explaining the direction, effort and persistence of action, from the initial decision of self-employment (Segal et al., 2005). In line with McClelland and Boyatzis (1982), results suggest that people with a high desire for achievement take on a high degree of responsibility towards the result and are more likely to engage in activities that are strategic for the business, increasing the chance of the venture developing into a new firm, independently of the sex of the entrepreneur.
Descriptive statistics clearly indicate gendered motivations: female entrepreneurs appear significantly more likely than male ones to have a motivation towards the business related to freedom, which means flexibility for balancing family and work, with a family-based role (Maes et al., 2014; DeMartino et al., 2006): women are more prone to choose entrepreneurship as a means of simultaneously satisfying their own career needs and those of their children/family (Clain, 2000; Kirks and Belovics, 2006). Unfortunately, the desire for independence and freedom may lead (female) entrepreneurs to focus on their life, and not entirely on the business, thus avoiding tough choices, such as the complexity of dealing with larger group of teammates (Maes et al., 2014). On the other hand, women are less motivated by money (Cromie, 1987), social recognition, and – the most important motivation – achievement incentives. This paper demonstrates that an inferior need of achievement affects the entrepreneurs’ initial and disruptive decision of gathering a qualified group of people who will drive the start-up to success. An inevitable deduction is that women, more pushed by request for freedom and less by need of achievement, tend to gather smaller teams and to pay less attention to the human capital that is collected with them, thus making a fatal organizational choice (mistake).
As a whole, the gender stereotypes that starting a business is culturally associated with masculine characteristics (Ahl, 2006; Gupta et al., 2009) lead to family and occupational roles for women (Brush et al., 2009) and create a social environment where men are seen as entrepreneurs (Baron et al., 2001). Moreover, gender stereotypes impact on women’s high-growth entrepreneurial intention (Henry et al., 2013). Not marginally, masculine entrepreneurial stereotypes may explain the choice of sector of activities as resulting from summary univariate statistics: high-technology industries and manufacturing sector are dominated by men, whereas women are concentrated in low-growth sectors such as retail store, consumer and health services.
Conclusions
The findings of this paper can be summarized in a list of what is not statistically relevant and what, on the contrary, is statistically relevant. First, the features of the restricted team of owners are not relevant for the venture’s evolution. This is true, instead, for the larger team of affiliates, including key not-owners and helpers. Second, the size of the team does not affect, per se, the evolution of the start-up into a new firm, but only in relation to the human capital that underlies the team. Third, the mere biological condition of being women (sex) is insufficient to explain the underlying human capital of team. Rather, sex seems to have an impact insofar as it is indirectly associated with different motivations towards business, deeply gendered. The findings of this paper demonstrate that the reason for which nascent women entrepreneurs are less keen on developing solid start-up teams is not related to the mere biological condition of being a female (Brush et al., 2006; Manolova et al., 2007). Rather it is a motivation towards the business that mediates the relationship between sex and the recruitment of a qualified team, which is vital for the evolution of the start-up into a new firm. The desire for success has a significant and positive impact on the recruitment of highly qualified people in terms of education and experience. Women seem to lack this desire, being driven by motivations related to the role that they expect society to assign to them, such as reconciliation between family and work. Unfortunately, this motivation leads females to build smaller teams, thus increasing the probability of disbandment.
In line with Hmieleski and Sheppard (2019), this paper offers indications for policy measures and educational programmes aimed at fostering entrepreneurial inclinations among women. The idea that businesses run by women have a higher failure rate than men’s should be eradicated (Baycan Levent et al., 2003; Watson, 2002), as well as that women’s prevailing task in society is a family-based role. Stereotypes of gender roles leads women to self-exclusion (Stedham and Wieland, 2017; Fellnhofer et al., 2016) and to make organizational mistakes. Women need to be taught to pursue the need for achievement and to carry on business ideas with an appropriate effort in terms of a large and qualified team of supporters.
Women need to be (culturally) educated on how to re-balance their personal motivation towards entrepreneurship by fostering their incentives for achievement. Political and educational programmes could trigger success in the creation of new businesses led by women. According to Bullough et al. (2014), to stimulate a more entrepreneurial attitude among women, it is necessary to create the environment and tools for this scope. Thus, at the level of social culture, programmes and courses to stimulate the birth and growth of firms founded by women are essential in a political and institutional framework, as well as education on gender equality and women’s rights. In line with Hmieleski and Sheppard (2019), our findings emphasize the need for a “more balanced perspective of entrepreneurship”, focusing on specific characteristics of women that can create the condition to become entrepreneurs and on factors that can have an impact on women’s intention to engage in entrepreneurship.
We acknowledge limitations of the computation’s aspect of our paper, such as the discretionary scoring assigned to the HC measure, but this is unavoidable when processing data of qualitative surveys. Nevertheless, publicity and width of the PSED II statistics help to overcome this concern because our computations are easily verified, allowing comparisons with similar surveys in other countries.
In fact, given that the results of this paper strongly rely on socially constructed motivations, the same analysis may be replicated by comparing culturally different countries and leveraging on comparable datasets, based on similar design protocol (so-called PSED protocol), such as the Comprehensive Australian Study of Entrepreneurial Emergence (CAUSEE 2007-2013), the Swedish Panel Study of Entrepreneurial Dynamics and the Norwegian PSED study.
Notes
Operationally, nascent entrepreneurs (1) consider themselves as starting a business, (2) have engaged in start-up activities within the past year, (3) expect to own all or part of the new business, and (4) have not experienced more than three months positive cash flow (Reynolds et al., 2004).
Differences between helpers and key not owner are not great. “Key not owners are more involved than helpers, due to the fact that they are more likely to have personally accepted responsibility for critical component of the start-up process than helpers and are more likely to expect to participate in day-to-day operations than helpers and are more likely to be employees or exclusive subcontractors” (Burton, Anderson and Aldrich, 2009, p. 122).
Note that in the PSED II design, entrepreneurial exit is characterized as the process by which firm founders leave the new venture they created, and not as the entrepreneurial exit of the business from the marketplace.
Remember that the nascent entrepreneur has been excluded from team measures, and it is likely that, over time, she lost members, remaining alone.
Evidence available upon request.
With respect to business controls, we mention the role of the health service sector which is the only one to consistently reach a significant and beneficial role, in terms of both increasing the probability of transition to a new firm and decreasing the probability of quitting. Concerning the influence on team features, when statistically significant, all the business sectors have a positive effect on them (restaurants, manufacturing, agriculture, insurance, real estate and business consulting); the unique exception is for the finance sector, which is negatively related to the size of the team, when it is simultaneously estimated with the transition to new firm.
Special gratitude goes to Tatiana Monolova, for relevant insights on preliminary ideas on this research; the authors are grateful to Enrico Cori and Fabio Fraticelli, who supported us with detailed observations and comments on the paper. We are finally grateful to Gabriele Poole for language revisions.
