The textile and apparel (T&A) industry is one of the most prominent waste-generating industries and is criticized for environmental and social sustainability. This research work aims to demonstrate the crucial enablers for implementing circular economy (CE) in Bangladesh’s T&A industry.
This research work followed a purposive sampling method in three stages of data collection from a small expert focus group. This study employed two integrated Fuzzy methods: fuzzy total interpretive structural modeling (TISM) and fuzzy decision-making and trial evaluation laboratory (DEMATEL) to evaluate the CE enablers.
The TISM model discovered that stakeholder involvement is the most impactful enabler for implementing CE practices in the Bangladeshi T&A industry. Consequently, the DEMATEL method revealed the causal relationships among the enablers and identified the effective reverse logistic process as the most impactful enabler.
For the first time, this study attempts to ascertain the inter-influential relationship and the causal relationship among the enablers precisely in Bangladesh. The influential relationships among the enablers were illustrated in a modelling-based hierarchical framework and causal relationships were demonstrated in the degree of effect diagram.
1. Introduction
According to the recently published report by the CE Foundation, 90% of the globally consumed materials are either wasted, lost, or unavailable, which may alarmingly create 170–184 Gigatons (Gt) of materials being extracted by 2050 in the context of current Linear Economy (LE) (CGRi, 2023). The 4R principles of CE, “Reduce-Reuse-Recycle-Refurbish,” can restart the earth cycle by reducing material extraction by one-third (Morseletto, 2023). The transformation from traditional LE to CE is vulnerably witnessed by major industries like steel, chemicals, papers, T&A, plastics etc. as they are responsible for one-third of global Green House Gas (GHG) emissions while the T&A industry accounts for 6–8% of global carbon emission (Imran et al., 2023). The CE demands no waste, less extraction of natural resources, increased value and extended life cycle of products, regenerative design and innovation, etc., which indicate the roots of sustainability in the CE tree (Song et al., 2015). The carbon footprint and GHG emissions from the heavy manufacturing industries like steel, chemical, paper, textile and apparel (T&A), cement, plastics etc. and consumer waste generation have forced world leaders to think of reshaping the infrastructure of industrial arrangements so that three pillars of sustainability: Economic, Social, and Environmental protection can be ensured and sustained.
CE implementation in industrial sectors has gained prominent attention from academic researchers, industry stakeholders, environmental organizations along end product consumers in the last decade. CE enablers have been identified and causal relationships have been ascertained in the automobile industry (Manoharan et al., 2022). Key enablers for SMEs in the emerging economies of Estonia have been investigated by Gerstlberger et al. (2023). CE enablers, awareness, and attitudes in the building sector of Saudi Arabia have been identified and ranked by AlJaber et al. (2024). CE enablers concerned with the Pakistani textile industry have been identified by Farrukh and Sajjad (2024). Along with other emerging industries, some remarkable research works have been performed in the T&A industry of Bangladesh. Challenges and opportunities towards CE in the Textile industry of Bangladesh have been explored by Saha et al. (2021). Scenario analysis of CE towards sustainable development in the Bangladesh textile industry has been performed by Ahmed et al. (2022). Challenges for smart waste management systems (SWMS) adhering to CE in the textile industry of Bangladesh have been investigated by Chowdhury et al. (2023). The potential benefits of establishing a CE framework in Bangladesh’s textile sector have been examined by Faisal-E-Alam et al. (2024). CE implantation challenges in the apparel accessories industry have been explored by Rashid et al. (2025). From this literature investigation, it is evident that recent works have mostly concentrated on delivering the general overview of CE implementation in the T&A industry of Bangladesh but have lacked in providing a robust approach to evaluate the enablers of CE for the entire T&A industry and mapping the influential and causal relationship among the key enablers. This study emphasizes three major research questions-
What are the significant enablers for CE implementation in the Bangladeshi T&A industry?
How are the enablers interrelated in the hierarchical model?
How will the causal relationship among the enablers be in the causal diagram?
To address aforesaid research questions, this study used Pareto analysis to identify the most significant CE enablers, the Fuzzy TISM method to formulate hierarchical relationships and the Fuzzy DEMATEL method to unveil the causal relationship among the CE enablers.
This research work aims to justify and quantitatively analyse the enablers that may lead the T&A industry to a new height of circularity achievement. The outcomes from this study may pave the way for innovative thinking and effective strategic planning for the industry stakeholders and foreign fashion retailer brands to modify their traditional sourcing, manufacturing and consumption through integrating CE practices. This research work can lead to a robust practical contribution by amplifying consumer awareness of clothing products usage and disposal focusing on CE practices and environmental sustainability.
2. Literature review
2.1 CE in the T&A industry
With an intensive focus on environmental hazards, the world’s environmental organizations have urged the importance of terminology like “Sustainability” and “CE” (Geissdoerfer et al., 2023). The integration of fast fashion and constantly changing fashion habits have forced the T&A industry stakeholders and fashion brands to focus on more production rather than thinking about the community and environment. The pre-consumer wastes from fibre production to manufacturing and heavy landfill pollution by used clothing pose a great threat to the ecosystem and human life (Niinimäki et al., 2020). The materials wastage generated from distinct production sectors of the T&A industry and economic losses due to these massive wastages have been investigated by Khairul Akter et al. (2022) through a case study in the Bangladeshi T&A industry. Textile-to-textile recycling of post-consumer textiles has been demonstrated by Charnley et al. (2024) to measure its magnificence throughout the entire textile value chain.
2.2 Enablers of CE implementation
The enablers act as an accelerating wave in implementing CE as they exhibit the path of positive growth and profit in the business to drive the industry’s top management and leaders. The inter-departmental collaboration plays a vital role as it will assist in creating a network to assess the costs against benefits from CE implementation and propose a strategic long-term plan for the organization (Karuppiah et al., 2021). Environmental sustainability can be improved with the settings of robust research and development along with technological engagement (Paul et al., 2022). Financial support from the government can ease the pressure of unstable global trade and the mounting of raw materials prices (Van Opstal and Borms, 2023). The work of Nath et al. (2025) has credited long-term benefits, awareness, and collaboration chances as enabling factors for T&A suppliers in Bangladesh. Similarly, the effort of a green supply chain in T&A requires supportive legislation, potential revenue, and team coordination for positive outcomes (Dohale et al., 2023). Based on Pakistan’s T&A industry, a qualitative theoretical study revealed internal and external enablers' importance in transitioning industry mindset (Farrukh and Sajjad, 2024). One step ahead, (Faisal-E-Alam et al., 2024) considered a survey on textile and leather industries to support a significant correlation between individual and organizational factors in CE transitioning. Recently, environmental cooperation has been a critical enabler, and consumers play an essential role by putting pressure on the stakeholders (Ki et al., 2020). Some of the studies connected the role of business, organizational, operational, social, and environmental factors in mediating the born-sustainable fashion industry (Ostermann et al., 2021).
2.3 Multi-criteria decision-making (MCDM) approach
MCDM-based approaches such as ISM, MICMAC, TISM, DEMATEL, Delphi, Analytical Hierarchy Process (AHP), Analytical Network Process (ANP), etc., are getting prominent attention for academic research works for analysing broad situations with a small focus group of the sample (Manoharan et al., 2022). The MCDM models integrate simple symbolic terms to obtain responses from experts (Dhiman and Deb, 2020). In this research work, Fuzzy TISM and Fuzzy DEMATEL methods have been employed though traditional TISM and DEMATEL methods could also provide closer outcomes. The reason behind this Fuzzy logic integration denotes that, the combination of fuzzy logic with MCDMs facilitates researchers to reduce errors through more conveniently understandable linguistic terms for making a comparison in matrix format, lower biases in the data collection from respondents and increase the wide acceptability of formulated decision models (Karuppiah and Sankaranarayanan, 2022). Moreover, fuzzy responses can be reliably converted to triangular fuzzy numbers and facilitate crisp value calculation for factors individually (Akhtar and Asim, 2024). Some recent literatures have been enlisted in Table 1.
3. Methodology
3.1 Data collection
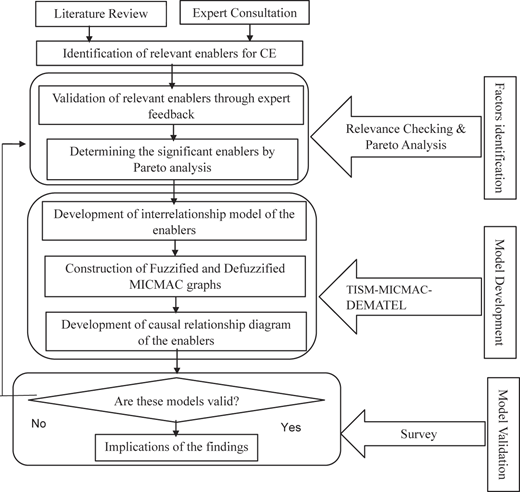
Figure 1 illustrates the entire research flowchart. At first, data collection started by sending the primarily identified twenty (20) enablers to 40 experts from academia and T&A professionals to check the relevancy of the enablers in a questionnaire (Table A1; Appendix). However, 32 experts provided opinions in this relevancy checking step, resulting in an 80% response rate. All of the enablers were selected as relevant as per the expert validation. To choose the most prominent variables through Pareto analysis (80/20 rule), another questionnaire (Table A2; Appendix) containing a rating scale of 1–9 (1 = least priority, 9 = most priority) was sent to the same 32 respondents from previous survey experience.
According to this concept, another 80% of enablers will have minimal influence on CE implementation (Gani et al., 2021). However, the study received 25 complete responses (78% response rate). Pareto analysis has been illustrated in (Figure A1; Appendix). The finalized 14 enablers have been provided in tabular format with proper source in-text citations in Table 2. In the last stage of response collection, 25 experts who responded in the second stage were invited to develop the structural self-interaction matrix (SSIM) through a Fuzzy linguistic scale. However, 17 experts responded (68% response rate). Demographic information of the respondents has been provided in (Table A3; Appendix). Major CE enablers with basic descriptions have been enlisted in (Table A4; Appendix).
3.2 Fuzzy TISM
Zadeh (1965) proposed the Fuzzy set theory that consists of qualitative responses to denote some specific degree of comparisons, thus facilitating multi-criteria decision-making among the variables. A well-known triangular fuzzy number (TFN) was used to find the interrelationships among the variables. De-fuzzification has been done for crisp values through a collaborative fuzzy control strategy (CFCS) using equations (1)-(3). Then left and right normalized values are calculated by equations (4) and (5). Later, total normalized crisp values are determined through driving and dependence power calculation by performing equations (6) and (7). The analysis follows the following steps-
Step 1: Perform normalization
Where ; is the lower limit.
Step 2: Compute the left (ws) and right (us) normalized scores
Step 3: Calculate total normalized crisp values
Step 4: Compute crisp values for each variable of interest
3.2.1 Defuzzification
Step 1: Defining fuzzy scale for contextual relationships.
To define the contextual relationships among the variables, a 5-point Fuzzy linguistic scale was used. The symbolic values and corresponding Triangular Fuzzy Numbers (TFNs) have been provided in Table 3.
Step 2: Development of aggregated structural self-interaction matrix (SSIM).
In this step, feedback from the respondents converted to the following four symbols to disclose the impact of one variable i on another j.
V: Factor i affects factor j; {very high (VH), high (H), low (L), very low (VL)}
A: Factor i is affected by factor j; {very high (VH), high (H), low (L), very low (VL)}
X: Factors i and j affect each other; {very high (VH), high (H), low (L), very low (VL)}
O: Factors i and j are unrelated; {no influence (N)}
An aggregated fuzzy SSIM is developed by aggregating the experts' responses.
Step 3: Development of final reachability matrix.
The final reachability matrix is obtained by connecting the enablers through transitive links. Transitive links are ascertained from the indirect impact between the variables.
Step 4: Calculation of crisp values, driving, and dependence power for MICMAC analysis.
Final crisp values are determined from the final reachability matrix by properly calculating the driving and dependence power of the individual variable.
Step 5: Performing level partitioning from the reachability matrix.
Following all the direct and transitive links the enablers are then distributed in different levels by performing the intersection of reachability set and antecedent set of variables.
Step 6: Construction of the hierarchical model.
Finally, the hierarchical model is constructed following the level-wise distribution of the variables from level partition.
3.3 Fuzzy MICMAC
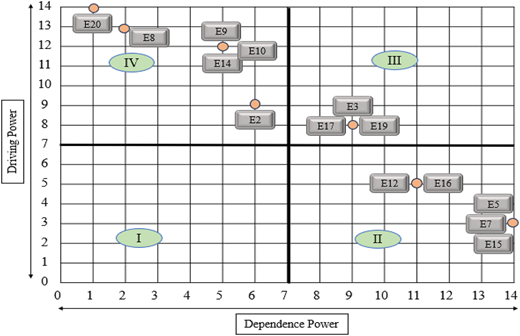
MICMAC analysis groups the variables in different portions (four distinct clusters) based on their driving and dependence power (Palit et al., 2022). The driving and dependence power or sensitivity is determined by response matrix analysis. In the MICMAC matrix, the vertical axis stands for driving power, and the horizontal axis denotes dependent power. Variables are classified into the following four distinct clusters (Chen and Lin, 2021). Autonomous cluster of variables with low driving power and low dependence power.
A dependent cluster of variables with low driving power and high dependence power
Linkage cluster of variables with high driving power and high dependence power
Independent cluster of variables with high driving power and low dependence power
Independent cluster of variables with high driving power and low dependence power
3.4 Fuzzy DEMATEL
DEMATEL is an MCDM (multi-criteria decision-making) technique for indicating causal relationships among factors that illustrate which factors are causes and which factors are affected (Chen and Lin, 2021). The reason behind choosing the DEMATEL method in a study is that this unique method alone can demonstrate the prominence of one variable over others by indicating the degree of impact (Karuppiah, 2024).
Step 1: Obtaining the initial direct impact matrix from expert judgements. Experts have been asked to rate the variables in a matrix format in some symbolic values to compare pairwise variables. The symbolic terms are VH (Very High Influence), H (High Influence), NO (No Influence), L (Low Influence) and VL (Very Low Influence).
Step 2: Conversion of the expressions into the corresponding triangular fuzzy numbers (TFNs) through the semantic conversion as Fuzzy TISM methods as stated in Table 3.
Step 3: Applying the CSCF technique for defuzzification of the fuzzy numbers and obtaining the weighted average as per the normalized left and right scores to get the overall normalized crisp values as TISM methodology.
Step 4: Direct and total relationship matrix development
Obtaining the direct influential matrix:
Calculating the comprehensive influential matrix. The element indicates the indirect influence relationship of factors i and j. The impact matrix T reflects the overall influential relationship between factors.
Determining the centrality degree is (Di + Rj), which indicates the severity of factors in the system. The cause degree is (Di – Rj) (when [Di – Rj] is positive, the factor goes to the cause group; when [Di – Rj] is negative, the factor belongs to the effect group). These degrees are calculated as follows:
the centre degree
the cause degree
4. Analysis and results
4.1 Model development for fuzzy TISM
4.1.1 Defuzzified MICMAC analysis
An aggregated fuzzy Structural Self-Interaction Matrix (SSIM) was developed for CE enablers (Table A5; Appendix A). The average response rate was considered by aggregating the responses. Then, the fuzzy SSIM was converted to a fuzzy initial reachability matrix (Table A6; Appendix A). Crisp values determination has been given in (Table A7.1 and A7.2; Appendix A). Enablers fuzzified MICMAC has been illustrated in (Figure A2; Appendix A). The driving and dependence power of the enablers were determined based on the CFCS technique and equations (1) – (5). Crisp values for the enablers were determined by performing equation (6) and (7). Enablers were also ranked based on dependence power and driving power. The aggregated fuzzy SSIM matrix was then turned into an aggregated defuzzified SSIM matrix, as depicted in Step 2 of the Fuzzy TISM method section (Table A8; Appendix A). Here, all the V, A, X, and O signs had been converted into an initial defuzzified reachability matrix by changing with the corresponding terms with binary values as V (1,0), A (0,1), X (1,1) and O (0,0) (Table A9; Appendix A). In the following part of this defuzzification analysis, the transitivity links among the enablers were indicated, and transitivity links were verified to formulate a defuzzified final reachability matrix (Table A10; Appendix A). This study utilized an online software version named SmartISM to determine the rest of the calculation and modelling. Driving and dependence power from both the fuzzified and defuzzified matrices were then plotted in the MICMAC graph (Figure 2) to visualize the interconnected enablers in distinct clusters. From the defuzzified final reachability matrix, it is noted that the enablers “Stakeholder involvement (E20)”, “CE skills and capabilities (E8)”, “Global pressure for CE setup (E9)”, “Job creation opportunity in CE business (E10)” and “Supply configuration (E14)” occupied very high driving power along with very low dependence power, whereas the enablers “Environmental concerns and safety lifestyle (E5)”, “Effective reverse logistics processes (E7)”, and “Innovation and R&D (E15)” having very high dependence values with least driving power.
4.1.2 Construction of the TISM hierarchical model
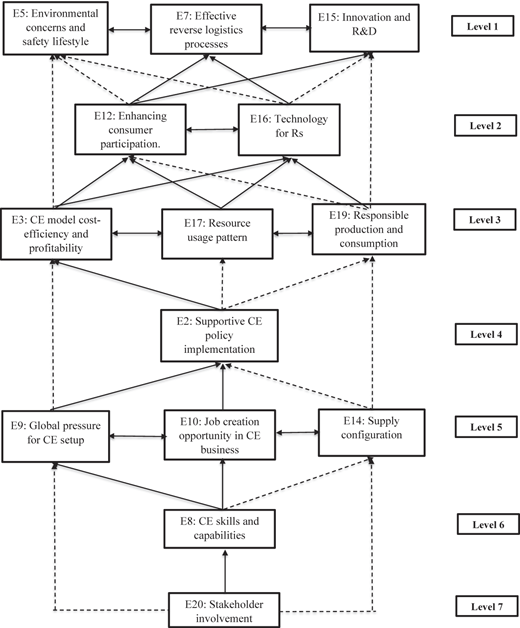
The defuzzified final reachability matrix with transitivity links was then utilized to perform level portioning to demonstrate the level-wise distribution of enablers. The reachability, antecedent, and interaction sets were used to perform level partitioning. Level portioning for CE enablers has been provided in Table A11 (Appendix A). The direct and transitive links between the enablers are illustrated as level partitioning in Figure 3. The TISM model can be validated through a rating score with a 5-point Likert Scale for each link from the experts who joined in SSIM development. The threshold value signifies more than 3 (60%) for the acceptance of each link. From the link’s judgement value, it has been assured that all the direct and transitive links have been validated with an average value of more than 5, hence TISM model is accepted. Validation data has been provided in Table A12 (Appendix A).
4.2 Fuzzy DEMATEL analysis
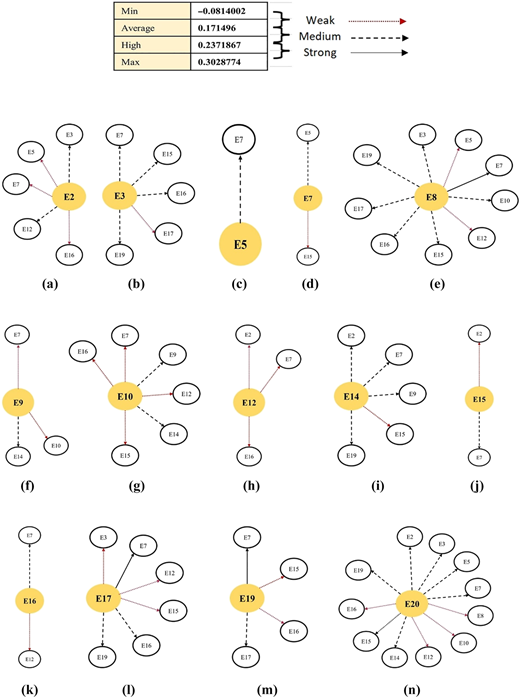
For fuzzy DEMATEL analysis, this study utilized the same decision matrix obtained from the experts for Fuzzy TISM modelling. Then, fuzzy values have been converted to fuzzy triangular numbers. As like TISM method, Fuzzy numbers were converted to defuzzified values (Table B1; Appendix B), and normalized left and right values were calculated (Table B2; Appendix B). Standard normalized crisp values were calculated using these left and right normal values (Table B3; Appendix B). The overall standard normalized crisp values were determined (Table B4; Appendix B). Aggregating these standard normalized crisp values, the maximum value was calculated from the summation values of the enabler column. Then, using Equation (8) and (9), a Direct relation matrix (X) for the enablers was developed (Table B5; Appendix B). This direct relation matrix (X) was further processed to the Total relation matrix (T), performing Equation (10) (Table B6; Appendix B). Consequently, the causal relationships among the enablers have been illustrated in Table 4, and the degree of effect diagram has been demonstrated in Figure 4, indicating weak, medium, and strong impactful connections between the enablers based on the calculated threshold value from the total relationship matrix (Table B7; Appendix B). Table B7 shows the degree of effect relationship among the enablers. Enablers have three types of effects (weak, medium and strong) based on their average threshold value as indicated in Figure 4. The enabler “Stakeholder involvement (E20)” affects most of the other enablers.
5. Discussion and implications
The TISM modelling framework reveals that “Stakeholder involvement (E20)” is the most influential enabler in CE practices, with the highest driving power and lowest dependence power. This finding is supported by MICMAC analysis and highlights the importance of stakeholders in CE practices. Stakeholders can play a vital role in the case of CE practices as in the case of the T&A industry as they are the dominating parties (Hina et al., 2022; Russell et al., 2020). The enabler “Supportive CE policy implementation (E2)” ranked alone in level 4 having direct influence from “Global pressure for CE setup (E9)” and “Job creation opportunity in CE business (E10)” and transitive link (indirect influence) from “Supply configuration (E14)”. Proper circular textile practices cannot be adopted effectively unless supportive CE policies, laws, and regulatory frameworks have been redesigned (Munaro and Tavares, 2023). At level 2, the two enablers “Enhancing consumer participation (E12)” and “Technology for Rs (E16)” are also interconnected to each other. Similar to Level 3 and Level 5, three interlinked enablers altogether exist in Level 1 namely “Environmental concern and safety lifestyle (E5)”, “Effective reverse logistics processes (E7)” and “Innovation and R&D (E15)”. New technology inventions can play a role as a catalyst in the CE transition process in the background (Qu et al., 2022; Rizos and Bryhn, 2022; Sopha et al., 2022). “Innovation and R&D (E15)” is directly influenced by “Enhancing consumer participation (E12)” but indirectly impacted by “Technology for Rs (E16)”. DEMATEL analysis provides the most important enablers by ranking the (Di + Rj) summation values (Feng and Ma, 2020). Table 4 remarkably shows that the enabler “Effective reverse logistics processes (E7)” is the most important enabler for implementing CE practices in the T&A industry. The study also found from the affected group that, “Effective reverse logistics processes (E7)” is the most affected enabler and for this reason, this enabler must get extreme attention from the stakeholders and fashion retailers (Dissanayake and Weerasinghe, 2022). In the case of the cause degree (Di-Rj) group, eight enablers secured positive values indicating the cause group and the rest six enablers got negative values for (Di-Rj) and were assigned as the effect group. Recycling and remanufacturing activities will create more job opportunities and help to develop more technical expertise among the operators (Munaro and Tavares, 2023).
5.1 Theoretical implications
In the T&A industry, CE standards entail changing manufacturing procedures from conventional linear methods to recycling. The stakeholders must accommodate suitable infrastructure and ensure that the related operators and employees possess a sufficient level of expertise to align with CE practices. Furthermore, CE inclusion necessitates dismantling the stakeholders' hesitancy towards LE to CE transition due to their rigidity and uncertainty regarding the initial high start-up financing. To make CE efforts profitable and provide long-term benefits for society and stakeholders, recycled products need to be promoted similarly to virgin items. For the benefit of environmental sustainability, industry participants and international fashion retailers might launch a campaign program to raise end users' understanding of how to dispose of worn clothing products. Maintaining CE regulations requires a regular recycling business setup; otherwise, used clothes items won’t be disposed of and recycled properly. To help usher in a new age for the recycling industry, scientists and technicians should continue their research efforts to develop new recycling technologies using cutting-edge machinery. Additionally, the government can play a significant role in encouraging industries to adopt CE standards by offering both monetary and non-monetary incentives as well as auditing and certification tools to guarantee appropriate quality in recycled goods.
5.2 Practical implications
The implementation of CE standards in the T&A industry in Bangladesh can be significantly altered by stakeholders’ negligence due to inadequate facility infrastructure. Facilities that are suitable for the collection, sorting, and separation of virgin materials from worn apparel items are required. However not all apparel can be recycled, and research is still ongoing to invent more efficient technology to recover all sorts of textile fibres. The government of Bangladesh may undoubtedly implement tax refund programs to encourage the CE. The management needs to give operators access to adequate training facilities for recycling technologies and cutting-edge, high-performance equipment. It is vital to make the end consumers aware of environmental pollution and encourage them to adopt recycled products. To streamline the constant delivery of recycled items to international end users, stakeholders might present them to fashion galleries. For the sake of social, economic, and environmental sustainability, the government, fashion industry stakeholders, and international fashion retailers should collaborate to successfully implement CE practices in the present traditional linear method. By altering import and export regulations in a favourable way that encourages and supports industry participants to participate in recycling, even with zero- or low-interest loans for the establishment of new recycling businesses, the government should support and encourage the recycling industry. Therefore, a standard level of circularity in the T&A business and community may undoubtedly be initiated and maintained through united tripartite efforts.
6. Conclusion
Two MCDM approaches were integrated in this study to investigate CE enablers in the T&A industry. The participation of industry stakeholders has emerged as a crucial element. However, the implementation of CE has given significant weight to technical skills associated with circular technologies, pressure from fashion retailers, and job openings in the recycling industry. The reverse logistics process is gaining prominent attention in the CE transition. Initiating CE practices, companies in the T&A industry must adhere to the guidelines for setting up efficient infrastructure for recycling procedures. To grab the ultimate benefit from CE, the government, industry stakeholders and fashion retailers have to work on the same ground to ensure proper environmental standards along with responsible production and consumption leading to SDGs attainment. This T&A industry comprises a set of sub-industries like spinning, knitting/weaving, dyeing, printing, trims, and accessories. These sub-sectors play as a backward linkage for the forward-moving clothing industry. Hence, these supportive sectors were out of this study framework. The study can be regarded as a basement for development in the context of CE in Bangladesh’s T&A industry. Future works may implement the outcomes practically in the industries and make a comparison to reveal the actual scenario of sub-sectors of the T & A industry.
References
The supplementary material for this article can be found online.