

This study aims to identify the key explanatory indicators and their consistency in facilitating various types of innovation in five consecutive waves of the Community Innovation Survey (CIS) from 2010 to 2018. Approximately 2,000 Lithuanian companies were observed in each wave. The authors identify the determinants affecting different types of innovation in each wave, such as product innovation (i.e. goods and services), process innovation (production, logistics, marketing, human resource management [HRM] and management), and any type of innovation (companies adopting at least one type of innovation).
The authors use a two-step approach involving naive Bayes and probit regression models. Explanatory variables are taken from the CIS and grouped into 12 types: strategy, work organization, customers and suppliers, external collaboration, innovation activity, technology, financial incentives, turnover, market scope, marketing, company characteristics and other expenditure.
Work organization, external collaboration-related practices and company characteristics (i.e. sector, size) are the most important determinants of innovation, affecting seven or more types. In addition, some determinants consistently impact certain types of innovation across multiple measurement waves. Specifically, technology-related indicators are crucial for production innovation; work organization–related indicators are the mainstay of HRM and management innovations; and external collaboration indicators are essential determinants of service innovation.
The ability to predict innovativeness is relevant because its measurement by the CIS is performed every two years, with the results made publicly available after a considerable delay. The results of this study suggest a way of predicting whether a company innovates and provide a means of tracking innovation trends in a country at any time.
Introduction
Innovation is one of the top priorities for organizations and countries, playing an essential role in growth and competitiveness. A key issue in innovation research is identifying and understanding the determinants of innovation (Dziallas and Blind, 2019). Innovation does not occur in isolation. It is influenced by a complex interplay of internal factors, such as organizational structure, leadership, R&D investments and employee skills (Terziovski, 2010), as well as external factors, including market competition, regulatory environments, public funding and technological advancements (Laursen and Salter, 2006). Understanding the determinants of innovation not only advances theoretical understanding but also provides practical insights into how businesses and governments can enhance their innovativeness and competitiveness.
Understanding these determinants favors quantitative approaches. Unlike qualitative approaches, which are often exploratory and descriptive, they enable researchers to systematically test which factors contribute to innovation outputs, identify their effect size and develop predictive models. Survey, statistical and Web mining data are three major data sources for identifying the determinants of innovation and the innovativeness of firms (Rammer and Es-Sadki, 2023). In addition, surveys such as the Community Innovation Survey (CIS) are widely used quantitative tools for comparing innovation patterns between companies and countries (Arundel and Smith, 2013). The CIS can be used to identify the determinants of innovation, as it provides comprehensive and standardized data on firms’ innovation activities. In recent years, numerous studies on innovation have leveraged data from the CIS due to its alignment with the Oslo Manual guidelines. This enables the use of standardized indicators, facilitating the analysis of cross-country and longitudinal differences in innovation metrics and supporting the development of robust empirical findings (Hashi and Stojčić, 2013; Horbach, 2016).
In the economic literature, CIS survey data have frequently been used to assess firms’ innovativeness, focusing on dimensions such as products, management, marketing and production. Most studies used CIS data to investigate the relationship between variables derived from the survey and other variables, such as productivity (Bartelsman et al., 2018; Baum, Lööf and Nabavi, 2018; Masso and Tiwari, 2023), firm growth (Colombelli et al., 2013; Coad et al., 2015), financing constraints (Canepa and Stoneman, 2008; Czarnitzki and Hottenrott, 2011), R&D spending (Doran, Jordan and O’Leary, 2013) and public funding (Beck et al., 2017; Barbieri et al., 2019; Costa, 2020).
Despite the important knowledge on innovation determinants provided by such studies, several under-researched areas remain. First, most studies focused on the determinants of a particular type of innovation. Although they rigorously evaluated these determinants, such studies did not reveal generic determinants that facilitate different types of innovation (Dziallas and Blind, 2019). Knowing the universality of determinants would help identify factors that simultaneously influence multiple forms of innovation, providing broader insights into firms’ innovation strategies. Such knowledge could help policymakers and business leaders design integrated frameworks that foster holistic innovation development rather than targeting isolated types of innovation. To address this gap, we simultaneously assess the determinants of the following innovation types: product innovation (i.e. goods and services), process innovation (production, logistics, marketing, human resource management [HRM] and management) and any type of innovation (companies adopting at least one type of innovation).
A second under-researched area is the lack of systematic investigation into the stability of innovation determinants across multiple waves of the CIS. Although many studies employ data from individual waves, there has been limited investigation of whether the predictors of innovation remain consistent over time (Roper and Arvanitis, 2012). This gap is significant, as innovation processes and determinants may evolve due to technological advancements, regulatory developments or economic changes. Addressing this gap is essential to determine whether the same indicators can reliably predict innovation in different periods, thus enhancing the robustness and generalizability of previous findings. This study therefore analyzed CIS data from 2010 to 2018 to identify stable predictors of innovation and evaluate their consistency over time. Specifically, we aimed to identify key explanatory indicators and their consistency in facilitating product and process innovations in five consecutive waves of the CIS. In particular, we separately identified the determinants affecting product innovation (that is goods and service innovation), process innovation (production, logistics, marketing, HRM and management innovation), and at least one (any) type of innovation in each wave.
We used a sample of 11,581 companies from multiple CIS surveys of Lithuania, with the number of observations varying from 2,175 to 2,421 in the five waves. A two-step approach involving the naive Bayes model (Eibe et al., 2000) and the probit model (Aldrich, 1984) was used to identify determinants and their universality across innovation types and survey waves. First, we employed naive Bayes to quickly identify patterns and predictors of different types of innovation. We then used the probit model to refine the analysis by estimating the marginal effects of individual determinants and testing their statistical significance. Unlike the Bayesian approach, the probit model accounts for correlations between predictors, allowing for more precise causal inference. This two-step approach incorporates the strengths of both methods, naive Bayes for rapid classification and probit for deeper interpretation, providing robust insights into the universality and consistency of innovation determinants across CIS waves.
The two-step approach successfully identified the determinants affecting product innovation, process innovation and any type of innovation. The determinants were grouped into 12 types: strategy, work organization, customers and suppliers, external collaboration, innovation activity, technology, financial incentives, turnover, market scope, marketing, company characteristics and other expenditure. Work organization and external collaboration, along with company characteristics (i.e. sector, size), were found to be the most important determinants, affecting seven or more innovation types. Notably, these determinants were more influential than those related to innovation activities, including R&D, which affected five types of innovation. Certain determinants consistently affected innovation outcomes in all five waves. Technology-related indicators consistently determined production innovation; work organization–related indicators were the mainstay of HRM and management innovations; and external collaboration indicators repeatedly determined service innovation, except in the 2014 wave. These results revealed both the generic determinants affecting multiple types of innovation and the indicators with consistent effects on specific innovation types across the multiple measurements spanning eight years.
This study extends existing innovation research in three ways. First, it integrates multiple innovation types (product, process and any type) within a single analytical framework, allowing identification of generic determinants that are not confined to specific innovation forms. Second, it introduces a time dimension by evaluating the stability of innovation determinants across five CIS waves (2010–2018), thus testing the consistency and robustness of these determinants over time, an aspect largely overlooked in prior CIS-based studies. Third, it combines predictive modeling (naive Bayes) with econometric inference (probit), offering a methodological bridge between machine learning and traditional econometrics, which enhances both predictive power and interpretability. These contributions expand the empirical and methodological boundaries of prior CIS research, offering new insights into the universality and temporal persistence of innovation determinants.
The remainder of the paper is organized as follows. Section one reviews the literature on the CIS and the major avenues of innovation research that rely on its cross-country data collection. Section two presents the research methodology and the data used to identify determinants of innovation, their universality and their consistency. Section three presents the results of the research, followed by a discussion and conclusions.
Literature review
Innovation refers to the ability of an organization to develop and implement new ideas, products or processes. A business innovation “is a new or improved product or business process that differs significantly from the firm’s previous products or business processes and that has been introduced on the market or brought into use by the firm” (OECD/Eurostat, 2018). The ability to predict the innovations of companies is of considerable importance, as understanding their determinants allows organizations to maintain a competitive edge and supports resilience in the face of market disruptions and technological advances. The challenge of accurately predicting the product and process innovations of companies has persisted for decades. Early research efforts primarily relied on R&D investment and patent data, as these indicators are readily available from financial records or publicly accessible patent databases (Bottazzi and Peri, 2003; Artz et al., 2010). However, this approach presents potential biases, as not all innovations stem directly from R&D investments or are patented (Rammer et al., 2009; Som, 2012). A comprehensive prediction of innovation requires measuring activities that facilitate innovations and innovation outputs. This encompasses the introduction of new or improved products to the market or the implementation of novel or enhanced processes within the firm. This issue has been partially addressed through the development and widespread adoption of standardized surveys on firms’ innovation activities and outputs, designed as an alternative approach to measuring innovation.
In 1992, the European Commission launched the CIS, a large-scale, harmonized survey of firms across multiple European countries. Numerous non-European countries have also implemented regular innovation surveys based on the CIS model, including countries in Latin America and Asia. Its alignment with the Oslo and Frascati Manual guidelines ensures consistency in measuring innovation inputs, outputs and organizational practices, allowing both cross-country and longitudinal comparisons. It also collects data on the impact of innovation on firm performance, such as sales growth, productivity and market expansion. The survey is conducted every two years, making it a valuable resource for researchers, policymakers and analysts to study innovation trends, evaluate policy impacts and investigate the determinants of innovation across different industries and countries. In total, 13 distinct waves of CIS have been conducted since the early 1990s, with the most recent survey covering the period from 2020 to 2022.
Scholars have extensively used the CIS to measure innovation performance (including product innovation and process innovation) and examine their internal and external determinants and barriers. Roper and Hewitt-Dundas (2008) investigated the determinants of innovation and the adoption of different innovation modes using CIS data. They identified key internal and external factors that influence firms’ innovation activities, including R&D investment and collaboration with external partners. Their findings emphasize the role of external knowledge sources and networks in driving innovation, particularly for firms with limited internal R&D capacity.
CIS data have been employed to investigate various types of innovation, dominating the measurement of product and process innovations, whereas technological and green innovations rely more extensively on statistical data (Stundziene et al., 2024). Laursen and Salter (2006) used CIS data to reveal the effect of external collaborations on product innovation. Doran and Ryan (2012) explored the impact of regulation and resource availability on process innovations. Schmidt and Rammer (2007) studied the drivers of marketing innovations and their complementarities with technological innovation. Horbach (2008) revealed the role of regulatory pressure, customer demands and R&D activities in driving eco-innovation. Tether (2002) examined how cooperation with suppliers, customers and universities promote innovation.
In addition to identifying determinants of innovation, CIS data have been used to study constraints, such as financial limitations, regulatory hurdles and skill shortages, helping policymakers address barriers to innovation. Canepa and Stoneman (2008) demonstrated that small and medium-sized enterprises (SMEs) experience greater financing constraints than larger firms, limiting their capacity for R&D investment. Addressing similar issues, Czarnitzki and Hottenrott (2011) supplemented CIS data with financial information, revealing that firms with restricted access to external financing invest less in R&D. They found this constraint to be particularly detrimental to high-tech and young firms, which generally have fewer internal funds and are perceived as higher risk by lenders. However, the limited scope of financial data in the CIS makes it challenging to isolate the effects of specific financing types (such as bank loans versus venture capital) on R&D investment. Furthermore, the CIS data do not fully capture dynamic factors, such as changes in financing constraints over time, restricting the capacity for longitudinal analysis. Nevertheless, the above studies illustrate the breadth of innovation research using CIS data, highlighting determinants and barriers across various types of innovation.
CIS data are used to study the effects of product and process innovations on firm growth, competitiveness and performance. Baum et al. (2018) used CIS data to assess how innovation input and output measures (R&D expenditure and product innovations) correlate with productivity and found that innovation positively impacts productivity. They also highlighted heterogeneity between sectors, suggesting that high-tech sectors benefit more from R&D investments than low-tech ones. Bartelsman et al. (2018) found that productivity gains are significantly linked to firms’ ability to adopt new technologies and engage in continuous innovation, a trait more prevalent in firms with strong external connections. Masso and Tiwari (2023) revealed that companies that engage in international R&D collaborations report higher productivity than those with purely domestic collaborations. Their analysis of the CIS illustrated how productivity benefits from partnerships that improve knowledge transfer and innovation capacity, underscoring the importance of global networks for productivity improvements. Colombelli et al. (2013) and Coad et al. (2015) provided perspectives on how innovative activities influence growth trajectories across firms, particularly in terms of size, employment and revenue growth. Peters (2008) demonstrated how different types of innovation positively impacted firm profitability, growth and market performance based on data from the German CIS survey. Griffith et al. (2006) used CIS data to compare the productivity impacts of innovation in multiple European countries. Horbach (2008) provided evidence of the impact of eco-innovation on sustainability. Hall and Mairesse (2006) explored the role of R&D intensity and innovation outputs in improving financial performance and competitive positioning. Drawing on CIS data, Cassiman and Golovko (2011) showed how product innovation enhanced firm export performance and international competitiveness. These studies reveal a broad consensus on the positive effects of innovation on firm performance.
CIS data across multiple waves allow scholars to monitor innovation trends, the stability of determinants and structural changes in innovation systems over time. The above-mentioned studies provide cost-effective measures of firms’ innovation, along with their determinants and outcomes. However, identifying consistent patterns in firms’ innovation trajectories over time remains challenging. Specifically, it can be difficult to distinguish firms with sustained innovation practices from those with irregular or isolated efforts. Furthermore, investments in R&D, patents and new product development usually take years to impact firm performance and innovation outcomes. As a result, researchers can only partially capture these delayed effects, instead focusing on how early innovation activities influence future innovation. Employing multiple waves of CIS data can address these limitations by enabling longitudinal comparisons of indicators of firms’ innovative activities, thus enhancing the reliability and robustness of research. Colombelli et al. (2013) analyzed three waves of CIS data for the French industrial sector (1992–2004) and showed that innovative firms experienced higher growth rates than noninnovative firms. Their quantile regression results also demonstrated that the effect of innovation on growth is greater among firms with the highest growth rates, a finding observed across various dependent variables. Using data for more than 29,000 firms over five CIS waves (2008–2018), Stojcic (2024) analyzed how innovative companies are reducing innovation failures. The study confirmed that a combination of training in innovative activities and European Union (EU) innovation support helps firms reduce the likelihood of innovation failure. Similarly, Tavassoli and Karlsson (2015) analyzed five waves of CIS data (2002–2012) for Sweden. They found a consistent pattern in firms’ innovation activities, with different types of innovation showing varying levels of persistence over time. Product innovation demonstrated the greatest persistence, followed by process and organizational innovations, while marketing innovation showed the least persistence.
Research based on CIS data remains a crucial foundation for measuring innovation, offering systematic and comparable data across countries and over time. Yet, recent developments in the field demonstrate a clear shift toward integrating predictive analytics and AI-driven approaches to complement traditional survey-based methods. Studies such as Braaksma et al. (2021), Krüger et al. (2020) and Rammer and Es-Sadki (2023) have expanded innovation measurement by using alternative data sources, particularly firms’ websites, to improve the timeliness and scope of innovation indicators. Earlier works using website-derived data (Gökk et al., 2015; Baudry et al., 2016) already revealed the potential of online information to capture innovation-related activities beyond conventional R&D or patent metrics. More recently, Kinne and Lenz (2021) applied neural networks trained on CIS data to predict firms’ likelihood of being product innovators, while Bottai et al. (2022) used website source code as a large-scale proxy for innovativeness. Collectively, these studies signal an important methodological shift, i.e. from descriptive survey analysis toward integrated approaches that link traditional data sources with predictive and digital indicators, enriching the understanding of firm-level innovation processes.
Building on these developments, this study contributes to this methodological trend by combining predictive classification with interpretive econometric modeling. Employing multiple waves of CIS data enables the identification of consistent patterns in firms’ innovation activities and allows for more robust longitudinal comparisons of innovation determinants over time.
In summary, CIS data have been extensively used to identify innovation determinants and barriers, evaluate the effects of innovation on company performance and monitor innovation trends. However, previous research has not revealed common determinants that facilitate different types of innovation. As shown by Stundziene et al. (2024), no particular indicators are exclusive to specific types of innovation and many commonly used variables lack close alignment with distinct innovation categories. Moreover, limited attention has been given to whether the predictors of innovation remain consistent across time. Addressing these gaps, the present study extends the existing literature by integrating machine learning with econometric interpretation to uncover stable and cross-cutting determinants of firms’ innovative performance.
Methodology
This study analyzed data from 2010, 2012, 2014, 2016 and 2018. More than 2,000 Lithuanian companies were observed in each wave, with the number of observations varying from 2,175 to 2,421 depending on the year. The questionnaire has not been consistent over time, with different waves including different questions and even different types of innovation. Twelve questions (statements) related to the type of innovation were included in 2010–2016, which were reduced to nine in 2018. The 2010–2016 surveys classified these questions into four groups:
product innovation;
process innovation;
organizational innovation; and
marketing innovation.
In contrast, the 2018 survey was based on the 2018 Oslo Manual (4th edition), which distinguishes just two major types of innovations: those that change firms’ products (product innovations) and those that change their business processes (business process innovations). Product innovations were then divided into two main types, while business process innovations were divided into six broad types.
Table 1 presents the types of innovation measured in the CIS and their names in this study. Innovation variables were coded dichotomously (1 = innovation occurred; 0 = no innovation) based on respondents’ answers to relevant questions. Since there were four statements related to marketing innovation (packaging, promotion, sales channels and pricing) in 2010–2016, but only one aggregated marketing innovation variable in 2018, we used an aggregated marketing innovation variable for 2010–2016. The same approach was taken for management innovation, with the variables ORGBUP and ORGEXR aggregated in 2010–2016. Innovation in supporting activities was included in 2010–2016 but not in 2018. Meanwhile, communication and administrative innovations appeared in CIS 2018 but were not included earlier. Thus, predictors were not sought for these three types of innovation. This research was supplemented by an additional variable that represents any type of innovation, which was assigned a value of 1 if any type of innovation occurs and 0 otherwise.
Innovation indicators
| Type of innovation based on Oslo Manual (OECD/Eurostat, 2018) | Statement in CIS (2010–2016) | Name of variable in CIS (2010–2016) | Statement in CIS (2018) | Name of variable in CIS (2018) | Names of innovation types used in this study |
|---|---|---|---|---|---|
| Goods | Introduced onto the market a new or significantly improved good | INPDGD | Introduction of new or improved goods | INNO_PRD_GD | Goods |
| Services | Introduced onto the market a new or significantly improved service | INPDSV | Introduction of new or improved services | INNO_PRD_ SERV | Services |
| Production of goods or services | Introduced onto the market a new or significantly improved method of production | INPSPD | Introduction of new methods for producing goods or providing services | INNO_PCS_ PRD | Production |
| Introduced a new or significantly improved supporting activity | INPSSU | Supporting activities | |||
| Distribution and logistics | Introduced onto the market a new or significantly improved logistic, delivery or distribution system | INPSLG | Introduction of new logistics, delivery or distribution methods | INNO_PCS_ LOG | Logistics |
| Marketing and sales | Significant changes to the aesthetic design or packaging | MKTDGP | Introduction of new marketing methods for promotion, packaging, pricing, product placement or after-sales service | INNO_PCS_ SLS_SERV | Marketing |
| New media or techniques for product promotion | MKTPDP | ||||
| New methods for product placement or sales channels | MKTPDL | ||||
| New methods of pricing goods or services | MKTPRI | ||||
| Information and communi-cation systems | Introduction of new methods for information processing or communication | INNO_PCS_ COMM | Communi-cation | ||
| Administration and management | Introduction of new methods for accounting or other administrative operations | INNO_PCS_ ACCT | Administrative | ||
| New methods of organizing work responsibilities and decision-making | ORGWKP | Introduction of new methods for organizing work responsibility, decision-making or HRM | INNO_PCS_ WR_DEC_ HRM | HRM | |
| New business practices for organizing procedures | ORGBUP | Introduction of new business practices for organizing procedures or external relations | INNO_PCS_ OPROC_ EXTREL | Management | |
| New methods of organizing external relations | ORGEXR | ||||
| Any type of innovation | INNO_ANY | Any type of innovation | INNO_ANY | Any type |
Various CIS questions (statements) were considered as potential explanatory variables that can predict whether a company is innovative. They were assigned to 12 groups related to strategy, work organization, customers and suppliers, external collaboration, innovation activity, technology, financial incentives, turnover, market scope, marketing, company characteristics and other expenditure (Table 2). Since the questionnaire varied over the study period, the number of explanatory variables differed for each year. For example, questions related to company strategy were only included in the questionnaire in 2012 and 2018, while questions related to market scope were excluded in 2018. Even if the number of explanatory variables in a group is the same across the years, the questions may differ. The description of the variables, including related CIS questions (statements), is presented in supplementary material.
Number of explanatory variables in each group
| Group of explanatory variables | 2018 | 2016 | 2014 | 2012 | 2010 | No. of common variables in 2010–2018 |
|---|---|---|---|---|---|---|
| Strategy | 16 | 12 | ||||
| Work organization | 5 | 1 | 1 | 2 | 2 | |
| Customers and suppliers | 1 | 1 | 3 | 2 | ||
| External collaboration | 11 | 3 | 3 | 10 | 10 | |
| Innovation activity | 5 | 5 | 5 | 5 | 5 | 4 |
| Technology | 6 | 2 | 2 | 2 | 2 | 1 |
| Financial incentives | 6 | 4 | 4 | 4 | 4 | 2 |
| Turnover | 5 | 2 | 4 | 2 | 2 | 2 |
| Market scope | 8 | 10 | 10 | 8 | ||
| Marketing | 2 | 2 | 2 | 2 | 2 | |
| Company characteristics | 21 | 20 | 20 | 22 | 18 | 17 |
| Other expenditure | 2 | 2 | 2 | 2 | 1 |
Only a few questions in the questionnaire are repeated every year: four indicators that are related to innovation activity (R&D), one related to technology, two related to financial incentives (financial support received from local or regional authorities and financial support received from national [central] governments) and turnover (turnover and expenditure on capital goods for innovation as a share of real turnover). In addition, the company characteristics (economic activity, size, country of the head office and others) can be found in each wave.
A two-stage analytical framework was used to determine which explanatory variables best predict whether a company is innovative. First, the naive Bayes model was used to find the best predictors. The naive Bayes classifier was chosen because of its ability to handle high-dimensional data and its minimal assumptions about the relationship between predictors and the outcome. This model is well-suited for binary classification problems, such as predicting whether a firm is innovative, especially when the predictors may have nonlinear or complex relationships with the outcome. It also facilitates variable selection by identifying predictors that minimize the pseudo-Bayesian Information Criterion, thereby balancing model fit and complexity. This step is critical given the varying availability of explanatory variables across years.
While naive Bayes effectively identifies relevant predictors, it does not provide estimates of the direction and magnitude of their effects. Therefore, in the second stage, the selected predictors were subsequently incorporated into a probit regression model:
Here, y is the dependent variable, which represents different types of innovation (see Table 1). It has a value of 1 if innovation was implemented and 0 otherwise. xi, i = 1, …, k, are explanatory variables identified as the best predictors of innovation using the naive Bayes model. bi, i = 0, …, k, are parameters of the model, and e is an error term.
The probit model estimates the probability of innovation as a function of the predictors, allowing for interpretation of the effects through estimated coefficients. This approach enhances interpretability and enables testing the statistical significance of each predictor. Variables not significant at conventional levels were excluded from the final model to improve robustness.
The classification results obtained by both models were analyzed and compared to draw inferences about the main predictors of innovative companies. This combined methodological approach provides a rigorous framework for identifying and interpreting key drivers of innovation in Lithuanian firms. It balances predictive accuracy with interpretability, while acknowledging the inherent limitations posed by data variability and measurement issues.
Results
The CIS data show that the percentage of innovative companies in Lithuania slightly increased over the study period. Almost 43% of companies exhibited any type of innovation in 2010, which increased to more than 56% in 2018, with the largest increase of 10% observed from 2012 to 2014 (Figure 1). Production innovations were also a major source of innovation between 2014 and 2018, observed in about one in three companies. In contrast, they were implemented in only about one in six companies in 2010 and 2012. This type was overtaken by marketing innovation in 2010 and 2012, but it is still increased in 2014 and 2016. However, marketing was one of the least popular innovations in 2018. Innovations in management and HRM were implemented in approximately one in five companies. The proportions of companies innovating in goods, services and logistics showed the largest increases from 2010 to 2018, increasing from approximately 12% to 25%, from 11% to 20% and from 6% to 14%, respectively. However, logistics was the least commonly observed type in all years.
 The five bar charts for 2018, 2016, 2014, 2012, and 2010 showing percentages by category, in 2018 any type 56.4 per cent, production 36.1 per cent, goods 24.7 per cent, communication 24.4 per cent, administrative 21.6 per cent, services 20.3 per cent, H R M 18.7 per cent, marketing 18.6 per cent, management 15.7 per cent, logistics 13.6 per cent, in 2016 any type 57.3 per cent, marketing 29.7 per cent, production 29.7 per cent, H R M 23.4 per cent, management 23.2 per cent, goods 21.5 per cent, supporting activities 21.5 per cent, services 17.1 per cent, logistics 17.1 per cent, in 2014 any type 51.9 per cent, production 29.6 per cent, marketing 23.3 per cent, supporting activities 23.2 per cent, H R M 18.6 per cent, goods 18.5 per cent, management 17.9 per cent, services 14.9 per cent, logistics 6.7 per cent, in 2012 any type 42.0 per cent, marketing 22.3 per cent, H R M 20.9 per cent, management 18.6 per cent, production 16.1 per cent, supporting activities 13.0 per cent, goods 12.3 per cent, services 11.0 per cent, logistics 5.5 per cent, in 2010 any type 42.9 per cent, marketing 24.2 per cent, management 22.1 per cent, H R M 20.6 per cent, production 16.7 per cent, goods 12.2 per cent, supporting activities 11.8 per cent, services 10.5 per cent, logistics 5.7 per cent.
Percentage of companies that implemented innovation
The five bar charts for 2018, 2016, 2014, 2012, and 2010 showing percentages by category, in 2018 any type 56.4 per cent, production 36.1 per cent, goods 24.7 per cent, communication 24.4 per cent, administrative 21.6 per cent, services 20.3 per cent, H R M 18.7 per cent, marketing 18.6 per cent, management 15.7 per cent, logistics 13.6 per cent, in 2016 any type 57.3 per cent, marketing 29.7 per cent, production 29.7 per cent, H R M 23.4 per cent, management 23.2 per cent, goods 21.5 per cent, supporting activities 21.5 per cent, services 17.1 per cent, logistics 17.1 per cent, in 2014 any type 51.9 per cent, production 29.6 per cent, marketing 23.3 per cent, supporting activities 23.2 per cent, H R M 18.6 per cent, goods 18.5 per cent, management 17.9 per cent, services 14.9 per cent, logistics 6.7 per cent, in 2012 any type 42.0 per cent, marketing 22.3 per cent, H R M 20.9 per cent, management 18.6 per cent, production 16.1 per cent, supporting activities 13.0 per cent, goods 12.3 per cent, services 11.0 per cent, logistics 5.5 per cent, in 2010 any type 42.9 per cent, marketing 24.2 per cent, management 22.1 per cent, H R M 20.6 per cent, production 16.7 per cent, goods 12.2 per cent, supporting activities 11.8 per cent, services 10.5 per cent, logistics 5.7 per cent.Percentage of companies that implemented innovation
According to the CIS data, 20%–27% of innovators state that they implemented just one type of innovation, and about a third of all innovators implemented two or three different types. However, approximately 10% of innovators implemented seven or more types of innovation (Figure 2).
 The graph shows relative percentages for innovation types 1 to 12 across 2018, 2016, 2014, 2012, and 2010 with bars, and cumulative percentages with dashed lines, for type 1 values range about 20 to 27 per cent, type 2 about 19 to 24 per cent, type 3 about 14 to 17 per cent, type 4 about 10 to 13 per cent, type 5 about 8 to 9 per cent, type 6 about 6 to 7 per cent, type 7 about 4 to 6 per cent, type 8 about 3 to 6 per cent, type 9 about 2 to 4 per cent, type 10 about 1 to 3 per cent, type 11 about 1 to 2 per cent, type 12 below 1 per cent, cumulative curves increase steadily from about 5 to 10 per cent at type 1 to near 100 per cent by type 12 for all years.
Number of innovation types observed in the companies (relative and cumulative frequencies)
The graph shows relative percentages for innovation types 1 to 12 across 2018, 2016, 2014, 2012, and 2010 with bars, and cumulative percentages with dashed lines, for type 1 values range about 20 to 27 per cent, type 2 about 19 to 24 per cent, type 3 about 14 to 17 per cent, type 4 about 10 to 13 per cent, type 5 about 8 to 9 per cent, type 6 about 6 to 7 per cent, type 7 about 4 to 6 per cent, type 8 about 3 to 6 per cent, type 9 about 2 to 4 per cent, type 10 about 1 to 3 per cent, type 11 about 1 to 2 per cent, type 12 below 1 per cent, cumulative curves increase steadily from about 5 to 10 per cent at type 1 to near 100 per cent by type 12 for all years.Number of innovation types observed in the companies (relative and cumulative frequencies)
We next present the explanatory variables that predict whether the company will innovate in a particular area based on the results of the naive Bayes and probit models.
Goods innovation is best predicted by the innovation activity indicators distinguished as important predictors by the naive Bayes method in all CIS analyses except for 2012. One of the indicators of this group, participation in intramural R&D (RRDIN), is also significant in the probit model in 2014 and 2016. Indicators related to customers and suppliers also dominate but vary every year, making it unclear which is the most important indicator. Indeed, none of the indicators from this group were included in the questionnaire in 2014. Company activity is also an important predictor. Goods innovations are relatively common in the manufacturing industry (NACE_C) but are uncommon in transportation and storage (NACE_H). Table 3 presents the number of different predictors identified by the naive Bayes and probit models in each wave. Meanwhile Table A2 in supplementary material lists the exact predictors of goods innovation (note that the 2012 column in Table 3 corresponds to the 2012b column in Table A2).
Number of different predictors identified by the naive Bayes and probit models for goods innovation in 2010-2018
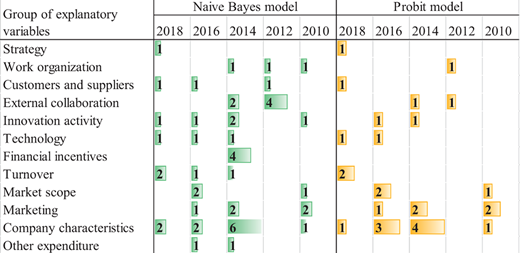 |
Marketing indicators can also help predict goods innovation, particularly design activities, which is significant in 2010, 2012 and 2016, while this indicator was not included in the 2018 survey. Indicators related to work organization were important until 2014, while technology-related indicators and turnover indicators, particularly export-related turnover, have been the main focus since 2014. The introduction of new goods or services (STRA_FNWGS) was also a key indicator in 2018, but its importance cannot be verified over a longer period, as it was included only in the 2018 CIS. Note, however, that external collaboration did not have a significant impact on goods innovation in 2016 and 2018.
The identified indicators predict goods innovation reasonably accurately. More than 70% of companies are correctly classified into innovators and noninnovators according to these indicators, with the exception of 2012, where they classified companies with approximately 60% accuracy (see Table A2). The naive Bayes model has the highest accuracy in 2010, which tends to decrease in later years, while the accuracy of the probit model tends to increase and is highest in 2018 (and similar to that of the naive Bayes method in that year). Based on this analysis of the CIS data, companies that introduce new goods or services, cocreate goods or services with users, have a significant proportion of their turnover from foreign customers and purchase new technology have the highest probability of being goods innovators.
Services innovation can be best predicted by indicators representing a company’s external collaboration (Table 4 and Table A3), with the acquisition of external knowledge (ROEK) being one of the most important indicators. Services innovation is more prevalent in companies focusing on financial, insurance, professional, scientific and technical activities. Work organization–related indicators are dominant until 2014, similarly to goods innovation and even the specific indicators are the same. Indicators related to customers and suppliers are also important, although their importance varies across survey waves.
Number of different predictors identified by the naive Bayes and probit models for services innovation in 2010-2018
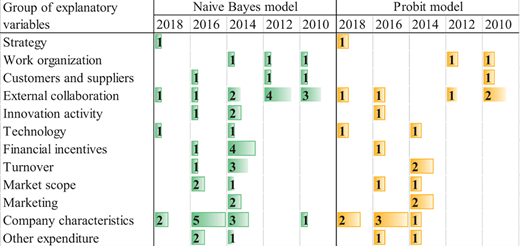 |
The identified indicators can also predict services innovation with reasonable accuracy. More than 70% of companies are correctly classified according to these indicators, with the exception of 2012, for which the accuracy is approximately 62% (Table A3). The naive Bayes model has the highest accuracy in 2010, which tends to decrease in later years, while the accuracy of the probit model tends to increase and is highest in 2018. In addition, all indicators identified by the naive Bayes model are also significant in the probit model for the 2018 CIS. Based on the analysis of the CIS data, companies involved in professional, scientific and technical activities, whose head office is located in the EU, EFTA or EU candidate countries and focus on improving existing goods or services, cooperating with other companies and buying new technology have the highest probability of being services innovators.
Technology, specifically the acquisition of machinery (RMAC), is a clear key driver of production innovation (Table 5 and Table A4). R&D activities and employment growth (EMP_GROWTH) also allow us to predict whether a company innovates in production. Turnover (TURN) was found to be significant in every second survey wave, while funding (particularly FUNGMT), external collaboration (particularly CO) and preparation activities (RPRE) are significant from 2012 to 2016. Work organization–related indicators are prevalent until 2014, as with the previously discussed types of innovation. Indicators related to customers and suppliers are also important, although they vary across the waves. In contrast, market scope indicators are not predictors of production innovation.
Number of different predictors identified by the naive Bayes and probit models for production innovation in 2010-2018
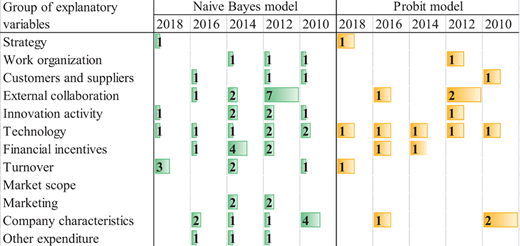 |
The classification accuracy for production innovation is slightly lower than for other innovations in most waves. However, more than 70% of companies are correctly classified using the naive Bayes model (Table A4). The accuracy is lower for the probit model but tends to increase over the examined period to a similar value to the naive Bayes model in 2018. This difference in accuracy may be related to the fact that many indicators distinguished by the naive Bayes model are not significant in the probit model and were excluded from the final model. According to our analysis of the CIS data, companies that improve existing goods or services; purchase machinery, equipment or software based on the same or improved technology; and generate turnover from customers outside Lithuania have the highest probability of being production innovators.
External collaboration (particularly ROEK), innovation activity, external support and turnover (TURN) are the most important predictors of logistics innovation according to the naive Bayes model (Table 6 and Table A5). However, financial incentives have an unclear influence. Public funding from the EU (FUNEU) has a negative effect on logistics innovation in 2014 and 2016 according to the probit model. Meanwhile, tax credits and allowances (TAX_CRED_OTH and TAX_CRED_RNDINN) have a positive impact on innovations. Employment growth (EMP_GROWTH) and work organization–related indicators also allow better prediction of logistics innovation. In contrast, strategy and market scope are not important predictors. The percentage of operating expenses dedicated to logistics (LGPC) is most closely related to innovation in logistics, and it is significant predictor according to both models. A higher percentage is found to increase the likelihood that a company innovates in logistics. However, only the 2016 survey included a question on this indicator.
Number of different predictors identified by the naive Bayes and probit models for logistics innovation in 2010-2018
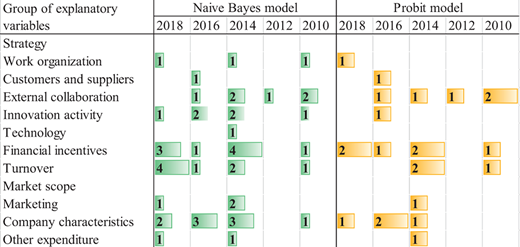 |
The classification accuracy for logistics innovation is higher than for other types of innovation. Classification accuracy exceeds 80%, with the exception of the probit model in 2016. The analysis of the CIS data reveals that large companies (employing 250 + people), as well as companies that receive tax credits or allowances for R&D or other innovation activities, and organize regular brainstorming sessions for staff to devise possible improvements within the business, have the highest probability of being innovators in logistics.
Although one would expect marketing innovation to be best predicted by marketing-related indicators, these indicators are only significant in 2010, 2014 and 2016 according to both the naive Bayes and probit models (Table 7 and Table A6). Engagement in design activities (RDSG) and participation in market introduction of innovation (RMAR) are dominant indicators in this group. External collaboration is even more important, particularly cooperation with other enterprises (COOP_OTH and CO) and acquisition of external knowledge (ROEK and ROEKX_RAT). These indicators, along with work organization–related indicators, were identified as predictors by the naive Bayes model in all waves except for 2016. Indicators related to technology, customers and suppliers can also help to predict marketing innovation.
Number of different predictors identified by the naive Bayes and probit models for marketing innovation in 2010-2018
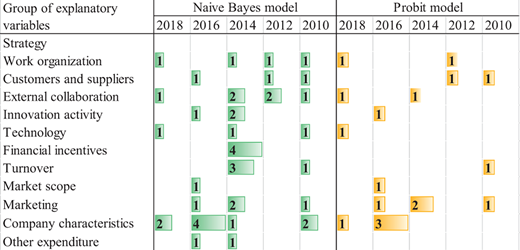 |
According to the CIS 2018 data, marketing innovation is typical for companies involved in professional, scientific and technical activities. Firms that attach importance to cross-functional work groups (teams working in different areas or functions); purchase machinery, equipment or software based on new technologies; and cooperate with other enterprises in business activities (excluding R&D) have a higher probability of being marketing innovators. These indicators predict marketing innovation with approximately 82% accuracy in 2018.
As expected, work organization–related indicators are the most important predictors for HRM innovation. However, the key variables vary among the survey waves (Table 8 and Table A7). External collaboration and turnover indicators (particularly TURN) are also important according to the naive Bayes model, but turnover (TURN) is not significant according to the probit model. There is clear evidence that companies that cooperate with other enterprises and acquire external knowledge are more likely to be HRM innovators. Engagement in design activities (RDSG) is also an important indicator for this type of innovation, whereas strategy and market scope are not important.
Number of different predictors identified by the naive Bayes and probit models for HRM innovation in 2010-2018
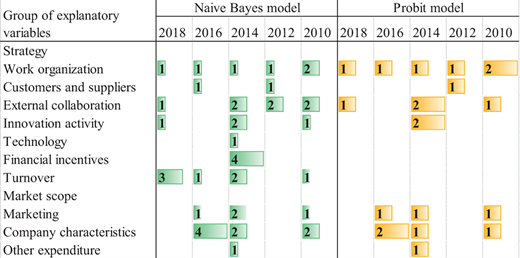 |
The classification accuracy of the naive Bayes model for HRM innovation is about 80%, except for 2012, while the accuracy of the probit model is slightly lower. According to the analysis of the 2018 data, companies that emphasize the importance of cross-functional work groups or teams and cooperate with other enterprises in innovation activities (excluding R&D) have the highest probability of implementing HRM innovation.
Work organization–related indicators, particularly participation in training for innovative activities (RTR) (not included in the 2018 questionnaire) and the importance of cross-functional work groups (MORG_CF_WG) (in 2018), are the most important predictors of management innovation. These results were also obtained for HRM innovation. However, management innovation can be better predicted by external collaboration indicators (Table 9 and Table A8). Specific indicators vary over time, although cooperation with other companies (CO) frequently appears. Similar to most other innovation types, employment growth (EMP_GROWTH) and company size also affect management innovation, while strategy-related indicators have little influence.
Number of different predictors identified by the naive Bayes and probit models for management innovation in 2010-2018
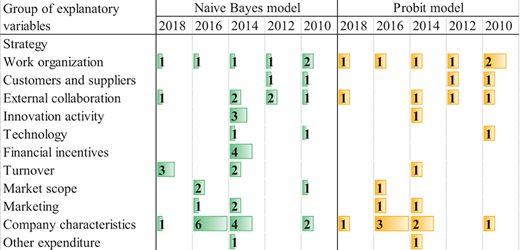 |
The classification accuracy of both the naive Bayes and probit models is high, with similar values of about 85% for the 2018 survey. According to the analysis of the 2018 data, companies with high employment growth, companies that emphasize the importance of cross-functional work groups and those that cooperate with other companies in innovation activities (excluding R&D) are most likely to implement management innovation.
In the case of any type of innovation, the acquisition or purchase of machinery (RMAC) is the dominant predictor (Table 10 and Table A9). According to the naive Bayes model, work organization–related indicators, such as participation in training for innovative activities (RTR), percentage of employees with a university degree (EMPUD) and sources of information for innovation within the enterprise or its group, are important for predicting innovation in all years except 2018. Financial incentives are also relevant. However, most of these indicators are not significant in the probit model, with EU funding even having a negative effect on innovativeness in 2010 and 2016. The naive Bayes model also identifies turnover (TURN), participation in R&D activities, external collaboration and customers and suppliers-related indicators as important predictors, whereas the probit model identifies only a few significant indicators related to external collaboration, as well as customers and suppliers (e.g. suppliers as a source of information for innovation [SSUP]).
Number of different predictors identified by the naive Bayes and probit models for any type of innovation in 2010-2018
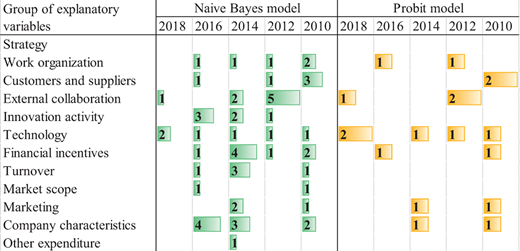 |
The classification accuracy of the naive Bayes method for any type of innovation is approximately 71% in 2010, 2014 and 2016, but less than 60% in 2012. The accuracy of the probit model is very high in these four years because some predictors in the model have many missing values for noninnovative companies, resulting in a small sample of noninnovative companies. Innovative companies are predicted very well by these indicators. Similar to the other types of innovation, the classification accuracy of both models is almost the same in 2018. According to the 2018 data, companies that purchase machinery, equipment or software and cooperate with other companies in innovation activities (excluding R&D) have the highest probability of being innovative.
Discussion
This research reveals that the predictors and their number differ for different types of innovation. It also shows that specific groups of explanatory variables are important in every wave of the survey. There is clear evidence that technology is crucial for production innovation, while work organization–related indicators are the main predictors for HRM and management innovations. These results align with well-established innovation theories, such as the Schumpeterian paradigm, which emphasizes technological change as a primary driver of product and process innovations. This confirms the notion that technological advancements, such as new equipment, software or manufacturing processes, directly facilitate improvements in production efficiency, quality and capacity. The organizational capacity theory posits that internal work practices, employee involvement and management structures are fundamental enablers of management and HRM innovations. Findings of this research reinforce the idea that changes in work organization are often the immediate antecedents of management innovations aimed at improving employee engagement, productivity or organizational agility.
External collaboration indicators are essential determinants of service innovation, although the probit model did not identify significant indicators in 2014. It aligns with the innovation systems approach, which emphasizes the importance of networks, partnerships and knowledge flows beyond organizational boundaries. Collaboration with customers, suppliers or research institutions often provides access to new ideas, technologies and markets, facilitating service innovations such as new service delivery models or customized solutions.
Figure 3 presents the main groups of predictors that were distinguished as important in at least three waves by the naive Bayes model. The largest numbers of indicators are required to predict production innovation (nine groups of explanatory variables), any type of innovation (eight groups) and goods innovation (seven groups).
 The diagram shows flows from innovation types including goods 7, services 4, production 9, logistics 6, marketing 6, H R M 6, management 3, and any type 8 to groups of explanatory variables, including work organization 8, customers and suppliers 5, innovation activity 5, technology 4, turnover 5, marketing 3, company characteristics 8, external collaboration 7, financial incentives 3, and other expenditure 1, with multiple bands indicating relationships between each innovation type and the corresponding explanatory variables.
Main predictors of innovation
The diagram shows flows from innovation types including goods 7, services 4, production 9, logistics 6, marketing 6, H R M 6, management 3, and any type 8 to groups of explanatory variables, including work organization 8, customers and suppliers 5, innovation activity 5, technology 4, turnover 5, marketing 3, company characteristics 8, external collaboration 7, financial incentives 3, and other expenditure 1, with multiple bands indicating relationships between each innovation type and the corresponding explanatory variables.Main predictors of innovation
Work organization–related indicators and company characteristics are crucial predictors for all types of innovation, while external collaboration is also important for all types of innovation except goods innovation. Training in innovative activities, percentage of employees with a university degree, cooperative arrangements for innovation activities, various sources of information on innovation (external sources, such as consultants, commercial labs, conferences, trade fairs, exhibitions and meetings, as well as internal sources) and acquisition of external knowledge are key indicators from these groups. This supports the findings of Tether (2002) and Laursen and Salter (2006), who argued that firms that are more open to external sources or search channels and have cooperative arrangements with external partners for innovation generally have higher innovative performance. The prominence of work organization and firm-specific characteristics aligns with the internal capabilities perspective, which posits that internal organizational routines, employee involvement and firm attributes are critical determinants of innovation. This universality suggests that regardless of the innovation type internal organizational factors fundamentally shape a firm’s capacity to innovate. This finding reinforces the resource-based view of the firm, emphasizing that internal resources, such as skilled human capital, organizational culture and management practices, are essential for innovation. It also refines earlier models by indicating that these internal factors are not only facilitators but are crucial predictors across diverse innovation domains, highlighting the importance of internal organizational health and structure.
Specific types of innovation are more typical for companies with different types of economic activity (according to NACE). For example, goods innovation is dominant in manufacturing but not in transportation and storage companies. Meanwhile, services innovation is more prevalent in companies involved in financial, insurance, professional, scientific and technical activities. Baum et al. (2018) also highlighted heterogeneity between sectors, suggesting that high-tech sectors benefit more from R&D investments than low-tech ones. Our study also shows that innovations are dominant in large companies, rather than small ones. Larger firms tend to be more innovative due to greater resource availability, economies of scale and broader market reach. The resource-based view of the firm explains that larger organizations generally possess more financial capital, human resources, R&D capabilities and technological infrastructure, which is critical assets for supporting sustained innovation activities. Furthermore, larger firms often have established formal innovation processes, dedicated R&D departments and stronger brand recognition, enabling them to invest in risky or long-term innovation projects that smaller firms might avoid. This pattern has been observed in numerous empirical studies, reinforcing the idea that size confers advantages in innovation capacity. Employment growth is also often an important predictor according to the naive Bayes model, but not significant according to the probit model. The best predictors that appeared in most waves and the direction of their impact on different types of innovation are summarized in Table 11.

Interestingly, innovation activity–related indicators are not important for all types of innovation. Traditionally, innovation measurement frameworks and performance models posit that innovation activity indicators are proxies for a firm’s innovative capacity and output. For example, R&D spending is often linked to product or process innovations and patent counts are used as indicators of inventive output. These models assume a relatively uniform relationship between activity indicators and innovation outcomes. However, the finding that these indicators are not important for all innovation types challenges this assumption, confirming that the relationship between activity and innovation is more complex and context-dependent. It refines the input–output paradigm by emphasizing that not all innovation types are adequately captured by conventional activity metrics. This finding is in line with Rammer et al. (2009) and Som (2012), who argue that not all innovations stem directly from R&D investment. Hirsch-Kreinsen (2008) also reported that innovation does not necessarily require R&D investment, contradicting many other studies that concluded the high importance of R&D for company innovation (e.g. Duarte et al., 2023; Roper and Hewitt-Dundas, 2008).
In addition, the scope of the market does not appear to be important in predicting the innovation of companies. Strategy-related indicators were also not observed among the most important ones. However, this can be explained by statements related to strategy only being included in the 2012 and 2018 surveys. Thus, there is insufficient evidence to conclude their importance. However, only 2 of the 16 statements about strategy in the 2018 survey were identified as important predictors, that is, a focus on improving existing goods or services, which is important for services innovation and production innovation, while a focus on introducing new goods or services is important for goods innovation. Finally, none of the 12 statements on strategy in the 2012 questionnaire was found to be significant predictor of innovation. Thus, we conclude that strategy-related indicators are of low importance.
Traditional economic and innovation theories posit that financial incentives lower the risks associated with innovation activities, encourage R&D investments and stimulate new product or process development. Accordingly, public funding from entities like the EU is often seen as a catalyst for innovation, especially in sectors with high R&D costs or market failures. However, this study refutes this notion, with public funding from the EU even having a negative effect on innovation in some cases. These results do not support the findings of Čučković and Vučković (2021), who presented significant empirical evidence of the positive impact of EU R&I funds on the innovation and economic performance of SMEs in new EU member states. However, they noted that their results should be interpreted with caution, as their impact assessment was limited in scope and duration. Crowding-out hypothesis suggests that government grants or subsidies might displace private investment or lead firms to become overly dependent on external support, reducing their own motivation to innovate independently. It also resonates with the innovation paradox, where well-intentioned policies may produce unintended consequences, such as reduced firm initiative, misallocation of resources or compliance burdens that stifle creativity. This finding refines existing theories by emphasizing that financial incentives are not a one-size-fits-all solution. The effectiveness of such incentives depends on contextual factors, such as the design of funding programs, the maturity of firms, sector characteristics and the innovation environment.
Finally, it is noteworthy that the naive Bayes model significantly outperformed the probit model in accuracy in 2010, the first year considered in this study. However, this difference tended to decrease during the study period, with both methods having similar accuracy in 2018. For most types of innovation, the accuracy of both models was about 80%, although it was about 73% for production innovation that year. Moreover, the probit model developed using the 2018 survey data requires fewer indicators than in previous waves to achieve effective prediction. Between two and six indicators are sufficient to predict innovativeness with approximately 80% accuracy.
Conclusions
By considering the different types of innovation observed in waves of the CIS between 2010 and 2018, this study identified the main explanatory indicators for predicting innovation in Lithuanian companies. The percentage of innovative companies increased slightly during this period. Production, goods and communication innovation were the most popular types in 2018. Explanatory variables were also extracted from the CIS and grouped into 12 types: strategy, work organization, customers and suppliers, external collaboration, innovation activity, technology, financial incentives, turnover, market scope, marketing, company characteristics and other expenditure.
It was difficult to identify particular indicators that predict specific types of innovation, as the questions in the survey varied over time. However, there is clear evidence that technology is crucial for production innovation, while work organization–related indicators are key determinants of HRM and management innovations. External collaboration indicators are important for services innovation.
The results show that innovation activity, customers and suppliers, company characteristics, marketing, turnover and technology-related indicators are important for predicting whether a company has implemented innovation in goods. Technology and R&D activities are most important for predicting production innovations. Work organization and external collaboration indicators are important for predicting marketing, HRM and management innovations. External collaboration (particularly the acquisition of external knowledge), innovation activity, financial incentives and turnover are the most important predictors of logistics innovation. For the case of any type of innovation, the acquisition or purchase of machinery is the most dominant predictor. Work organization–related indicators, financial incentives, turnover, participation in R&D activities, external collaboration, customers and supplier-related indicators are also important predictors.
The naive Bayes method significantly outperformed the probit model in 2010, but this difference tended to decrease during the survey period, with both methods having similar accuracy of about 80% in 2018. Only two to six indicators were sufficient to predict innovativeness when using the probit model.
The findings offer several insights for practitioners and policymakers. Since technology and R&D activities are closely linked to production innovations, policies could incentivize firms to invest more in technological upgrades and R&D. For instance, tailored grants or tax incentives for technological modernization could be effective. Policies promoting open innovation ecosystems and flexible work practices could stimulate service, HRM and management innovations.
Several limitations and potential biases of the survey could affect the accuracy and robustness of innovation measurement. First, changes in the questionnaire items across CIS waves can hinder comparability over time. Such variation may lead to inconsistent measurements of innovativeness and complicate longitudinal analyses. Second, companies self-report their innovation activities, which can lead to overestimation or underestimation due to social desirability bias, recall bias or strategic misreporting, affecting measurement reliability. Moreover, the sample of surveyed companies varies across waves. Firms that participate repeatedly may also experience survey fatigue, leading to less detailed or accurate responses over time. Inconsistent interpretation of questions may also introduce measurement errors affecting the robustness of analyses. Third, the survey typically captures whether firms innovate but provides limited information on the extent, intensity or success of innovation activities, increasing the difficulty of assessing true innovativeness. Finally, the endogeneity problem cannot be ruled out, as innovation activity may be correlated with unobserved firm characteristics, complicating causal inference.
All these aspects can lead to biases in the estimations, and the explanatory variables identified in this study require further validation using the latest data as they become available. A lack of external validation or benchmarking data makes it difficult to verify the accuracy of self-reported innovation data. Therefore, a comparison of innovation measurement using CIS and alternative techniques, such as learning methods based on company website data, could help create a more realistic picture of companies’ innovativeness. Future studies could employ longitudinal designs or causal inference techniques to better establish causal pathways between predictors and innovation outcomes. Extending the analysis to compare different sectors and countries could uncover sector-specific and country-specific drivers and barriers, enhancing the applicability of findings across diverse industries and countries. Addressing the limitations posed by variations in survey questions over time, future research could develop standardized measures, ensuring consistency and depth. Despite these limitations, this study highlights that information from the CIS is useful for predicting company innovation and determining its predictors.
References
Supplementary material
The supplementary material for this article can be found online.

