This study aims to examine the impact of the relationship between soft lean (SL) practices and diversity, equity and inclusion (DEI) practices on employees’ psychological safety (PS).
This study surveyed 271 middle and senior managers from manufacturing organizations in India and Brazil that have implemented both SL practices and DEI initiatives. This study used multivariate data analysis techniques to assess the practitioners’ responses.
The findings indicate that when both SL and DEI practices are poorly adopted, the frequency of organizations with lower PS is significantly greater than the ones with a higher level of PS. When SL and DEI practices are highly adopted, there seems to be a significant increase in PS levels. In other words, DEI practices adoption seemed to boost the effect of SL practices on PS.
To the best of the authors’ knowledge, this research is one of the first to provide empirical evidence about the synergistic effect of the relationship between Lean Production and DEI initiatives on employees’ psychological safety. Although Lean Production has already been a point of concern for most organizations, DEI has become more relevant in the past few years. Therefore, the proper understanding of such a relationship also offers valuable contributions to theory, practice and society.
1. Introduction
Lean production (LP) is widely known as a socio-technical system that encourages both sociocultural and technical elements for its successful implementation (Soliman and Saurin, 2017; Tortorella et al., 2019). The benefits from LP implementation have motivated its rapid deployment across several industry sectors as well as a significant number of academic studies (Furstenau et al., 2021). As a human-centric approach, LP fosters employees’ creativity and active involvement to continuously develop solutions that eliminate waste and improve quality of life toward customers’ satisfaction (Womack and Jones, 1997; Sawhney et al., 2020; Cusumano et al., 2021). The literature on how to support LP implementation has been prolific, suggesting several different frameworks for LP practices (e.g. Jasti and Kodali, 2015, 2016; Galeazzo et al., 2017). One of the most acknowledged combinations suggests a division between hard lean practices and soft lean (SL) practices (Bortolotti et al., 2015). Such a division is aligned with the socio-technical view of LP, emphasizing that not only the technical and tangible elements (i.e. hard lean practices, such as just-in-time, 5S, Productive maintenance) are important but also the behaviors, principles and culture (i.e. soft lean practices, such as leadership, teamwork, crossfunctionality) within the organization (Furlan et al., 2011; Mamat et al., 2015). Indeed, the integration of hard and soft practices enhances and accelerates the benefits of LP on operational performance, fostering a virtuous cycle (Gaiardelli et al., 2018). Nevertheless, research on SL practices has much less frequent than on hard lean practices (Januszek et al., 2023).
More recently, organizations have adopted practices that promote a more diverse, equal and inclusive work environment, reflecting their concerns about social sustainability (Gündemir et al., 2024). Diversity, equity and inclusion (DEI) can be regarded as a set of policies and practices that encourage a workplace environment that is inclusive and respectful of all employees (Sreedhar and Nayak, 2024). DEI initiatives have been developed to generate a more equitable and fair society by valuing differences and eliminating bias and discrimination (Kraus et al., 2022; Chukwudi and Eusebius, 2023). Although these initiatives are presumably aligned with the SL practices given that both of them focus on the human aspects (Hung et al., 2025), studies that approach their interaction are scarce, and little is known about whether there is a synergistic effect on organizations when both are concurrently implemented.
The relationship between SL practices and DEI initiatives may be particularly important to employees’ psychological safety (PS), which can be represented when employees feel safe to voice ideas, willingly seek feedback, provide honest feedback, collaborate, take risks and experiment (Carmeli, 2007). Although both approaches are expected to positively affect PS, there is poor empirical evidence to support this assumption. Moreover, the little evidence found in the literature in inconclusive (Kumar et al., 2023; Hung et al., 2025), misguiding practitioners and academics about the potential synergies of this relationship. Contradictory evidence also indicates that this relationship has been underexplored. For instance, while some studies (e.g. Kumar et al., 2023; Prashar et al., 2026) suggest a positive effect of the relationship between SL practices and DEI initiatives on employees’ PS, others (e.g. Xu et al., 2021; Dou et al., 2022) raise attention to negative implications on employees’ PS if either SL practices or DEI initiatives are at early stages of implementation of partially implemented. In addition, increasing organizational pressures for better performance may derail the effectiveness of the interaction between SL and DEI practices, leading to unexpected effects (Xu et al., 2021; Dou et al., 2022). All in all, these arguments support the existence of a theoretical gap that deserves further investigation. Against this backdrop, the following research question (RQ) arises:
How does the relationship between SL and DEI practices impact employees’ psychological safety?
To answer this question, this study examined the impact of the relationship between SL and DEI practices on employees’ psychological safety. For that, we surveyed 271 middle and senior managers from manufacturing organizations that have implemented both LP and DEI. We used multivariate data analysis techniques to assess practitioners’ responses. The study employs the Theory of emergent states (Marks et al., 2001) as a conceptual framework to comprehend how SL practices and DEI initiatives influence employees’ PS within an organization. Employees’ PS is an affective emergent state, which arises through open communication, knowledge sharing, trust-building and feedback mechanisms within a team (Edmondson, 1999; Newman et al., 2017). The adoption of SL practices may change the way teams are structured and work together (Fenner et al., 2023; Van Dun and Wilderom, 2012; Magnani et al., 2019). Thus, our study investigates the impact of SL practices and DEI on employees’ PS using the theory of emergent states as a theoretical lens.
Besides its theoretical contribution, this research raised empirical evidence about the synergistic effect of the relationship between LP and DEI. Although the former has already been a point of concern for most organizations, the latter has become more relevant in the past few years. Therefore, the proper understanding of such a relationship also offers valuable contributions to both practice and society as a whole.
The remainder of this paper is organized as follows: Section 2 brings the sate-of-the-art about the fundamental concepts investigated in this paper. Section 3 describes the applied method, whose results are presented in Section 4. Section 5 discusses our findings in light of the body of knowledge and Section 6 concludes the paper and indicates future research opportunities.
2. Background
2.1 Soft lean practices
Toyota (2001) indicated two main interrelated and interdependent principles that guide the Toyota Production System, which is the main reference for LP; they are:
continuous improvement, which represents the utilization of some practices to continuously look for and adopt improvements; and
respect for people, suggesting that employees are the most important resource of the organization.
These principles guide the implementation of SL practices, with particular notoriety for principle ii. SL practices represent the human-related elements (e.g. people and their intangible relationships) of LP, being essential to successfully implement change in the long run (Bortolotti et al., 2015).
Following the socio-technical view of LP (Shah and Ward, 2007), the impact of hard lean practices, which refer to the technical and analytical (tangible) elements of (LP), on operational performance can be reinforced by the adequate development of SL practices (Furlan et al., 2011; Mamat et al., 2015; Januszek et al., 2023). By fostering proactivity, openness and collaboration, SL practices cultivate a workplace more receptive to innovations that enhance efficiency and flexibility, driving a virtuous cycle toward operational excellence (Gaiardelli et al., 2018). In reality, SL practices highlight adaptability, collaboration and employees’ well-being, blending some LP principles with people-oriented strategies to promote a more innovative organizational culture. Nevertheless, SL practices have still been underestimated (Larteb et al., 2015; Lista et al., 2022), and academics and practitioners have just recently regarded them properly. Hence, their impact on organizational aspects may not be fully understood.
The classification of SL practices varies among researchers. Shah and Ward (2003) suggested a socially focused construct of practices named human resources management. Subsequently, the authors expanded it to different sets of practices such as involved employees, involved customers and suppliers partnership (Shah and Ward, 2007). Similarly, Bortolotti et al. (2015) proposed six constructs of soft lean practices; they are:
top management leadership for quality;
suppliers partnership;
small-groups problem solving;
continuous improvement;
training employees; and
customer involvement.
More recently, Januszek et al. (2023) provided a complementary perspective of these practices, relying on their relationship with the management of socio-technical systems and grouping them into six constructs. The authors incorporated new elements such as digital collaboration tools, employee psychological well-being and inclusive leadership as essential components of SL practices.
2.2 Diversity, equity and inclusion in organizations
DEI initiatives are commonly grouped together due to their interconnectedness and combined impact on organizations (Gündemir et al., 2024). Nevertheless, it is important to understand their individual meanings and implications. Diversity represents the presence of variety in an organization, such as in identity and identity politics, involving gender, ethnicity, sexual orientation, disability, age, culture, class, religion, or opinion (McKinsey and Company, 2022a). Equity is conceptualized by fairness and justice (e.g. fair compensation and substantive equality) (Kraus et al., 2022). Equity also refers to a focus on societal disparities, resource allocation and decision-making authority to groups that have historically been disadvantaged (Holcombe et al., 2024). Finally, inclusion is determined by the creation of an organizational culture that promotes an experience in which employees are truly heard, developing a sense of belonging and integration (Sreedhar and Nayak, 2024).
DEI initiatives are fundamental to promoting a positive organizational culture (Sabharwal, 2014; Creary et al., 2021). Via the exposure to diverse perspectives, organizations can improve employees’ morale, foster business ethics and drive creative problem solving and innovation (Morukian, 2022; Gündemir et al., 2024). Organizations that are diverse, equitable and inclusive are supposedly more capable of responding to challenges, winning top talent and meeting the needs of different customers (Beach and Segars, 2022; Waters et al., 2023). Based on the adoption of DEI initiatives, organizations are aware of the need to better support employees (Hamidullah et al., 2024). In the past few years, several organizations have initiated their efforts to build DEI, integrating their policies and hiring practices (McKinsey and Company, 2022a).
Despite the aforementioned benefits, some issues still prevent DEI from becoming more disseminated across organizations. For instance, according to McKinsey and Company’s (2022a) report, progress in building a diverse workforce remains slow. In addition, despite employees’ support for diversity, there seems to be high levels of negative sentiment on inclusion – namely, equality, openness and belonging – particularly around equality and fairness of opportunity. Another fact refers to the few women (and women of color in particular) playing key leadership roles in organizations (McKinsey and Company, 2022b). These issues undermine the full understanding of the impact of DEI initiatives adoption in the workplace, and corroborating organizational skepticism (Coleman et al., 2022; Labarca et al., 2024).
2.3 Employees’ psychological safety
PS in organizations can be represented by a workplace environment in which employees are comfortable expressing their perceptions, asking questions, admitting mistakes and taking risks without fear of negative implications (Carmeli, 2007; Higgins et al., 2022). It is worth noting that PS is not about avoiding challenges or criticism. Instead, some of the fundamental elements for establishing PS in organizations are open communication, active listening, error tolerance, an inclusive environment and a positive feedback culture (Newman et al., 2017). Whenever established, the most common benefits of PS are a growing level of innovation and team performance, higher levels of employees’ engagement and lower work-related stress levels (Frazier et al., 2017; Ge, 2020). In turn, existing research has indicated the drawbacks of lacking PS in the workplace, such as burnout, higher turnover and lower overall performance of the organization (Edmondson, 1999).
Although PS presents some overlap with trust, it conceptually differs since it approaches how group members perceive a group norm, whereas trust involves how one person perceives another (Edmondson and Bransby, 2023). Despite its importance, many organizations still struggle to create or maintain PS (Pacheco et al., 2015). Among the greatest barriers to PS establishment, there are fear of judgment or punishment, hierarchical and rigid leadership, lack of trust and transparency, resistance to change, poor handling of mistakes, exclusion and bias, unclear expectations and inconsistent support from leadership, unhealthy competition, overemphasis on short-term goals and lack of role models for PS (Edmondson and Roloff, 2008; Jiang et al., 2019; Remtulla et al., 2021).
Given its importance and the inherent difficulties of its establishment, employees’ PS has been one of the strategies companies look for, especially when it comes to human resources management (Carmeli and Gittell, 2009; Edmondson et al., 2016). Viewed as a key factor for competitiveness growth and organizational innovation (Higgins et al., 2022), the development of PS in the workplace has become a pressing issue and attracted the attention of both practitioners and academics (Newman et al., 2017; Ge, 2020), especially when considering different management approaches whose effects might vary according to employees’ generations (Tortorella et al., 2020). Although SL and DEI practices, and PS share behavioral manifestations such as open communication and feedback practices, they represent conceptually distinct constructs. SL practices reflect a structured management system emphasizing employee involvement in continuous improvement (Bortolotti et al., 2015). DEI captures normative commitments to fairness, representation and equitable participation (Sreedhar and Nayak, 2024). PS, in contrast, represents a shared perception regarding the interpersonal consequences of speaking up (Carmeli, 2007). Thus, SL provides structural mechanisms, DEI shapes normative inclusion boundaries and PS reflects the emergent interpersonal climate. This justifies further research on the topic and the existing interrelated management approaches, such as SL and DEI initiatives.
2.4 Theory of emergent states
Emergent states are the dynamic and collective properties arising from ongoing interactions among the team members and influence the team’s functioning and performance (Kozlowski and Ilgen, 2006). These emergent states can be cognitive, affective and motivational. Employees’ PS, an affective emergent state, emerges dynamically over time through open communication, knowledge sharing, trust-building and feedback mechanisms within a team (Edmondson, 1999; Newman et al., 2017). Implementing SL practices entails several modifications in team structures and work procedures, such as formation of multifunctional and flexible teams that share decentralized responsibilities (Fenner et al., 2023; Van Dun and Wilderom, 2012; Magnani et al., 2019). For example, SL practices such as small group problem-solving involve open discussions on ongoing and potential problems among problem-solving task forces. Similarly, kaizen events involve collaborative problem identification and continuous improvement by teams. These practices lead to an open and trustworthy work environment and encourage employees to voice ideas or share opinions, strengthening PS over time (Latif et al., 2023). In addition, literature establishes the role of DEI practices, such as diverse team composition and inclusive leadership, in encouraging participation and recognizing contributions from employees of all backgrounds (including marginalized groups like racial minorities) and fostering an environment of PS (Newman et al., 2017; Martins et al., 2013). Based on this, this study theorizes the impact of SL practices and DEI in building employees’ PS.
3. Method
To answer the RQ, we followed a survey-based approach based on data collected from key respondents from organizations that met specific selection criteria. The use of an empirical approach to acquire knowledge via direct/indirect observation or experience is quite common (Goodwin, 2005), especially when the trends or features of a group are not easily or directly observed. Surveys are also an attractive way to collect data due to their high level of representativeness, low cost, potential statistical relevance and standardized stimulus to respondents (Montgomery, 2013). As an exploratory research, no a priori hypotheses were formulated (Nilsen et al., 2020), and conclusions were drawn after the obtained results using the conceptual framework presented in Figure 1. Therefore, our research method comprised two main steps:
 The conceptual diagram titled Theoretical Lens Theory of Emergent States shows two boxes on the left labelled Soft Lean practices and Diversity, Equity and Inclusion practices, each connected by arrows to a box on the right labelled Employees psychological safety, illustrating that both organisational practice areas contribute to shaping employees' sense of psychological safety within the workplace.
Investigated conceptual framework
The conceptual diagram titled Theoretical Lens Theory of Emergent States shows two boxes on the left labelled Soft Lean practices and Diversity, Equity and Inclusion practices, each connected by arrows to a box on the right labelled Employees psychological safety, illustrating that both organisational practice areas contribute to shaping employees' sense of psychological safety within the workplace.Investigated conceptual framework
questionnaire development and data collection; and
clustering and analysis of data.
These steps are detailed as follows:
3.1 Questionnaire development and data collection
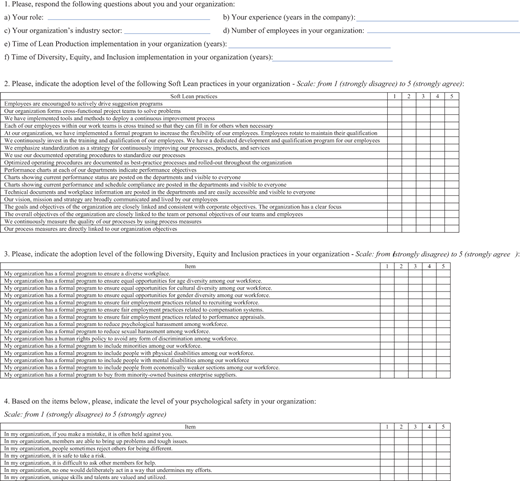
The questionnaire was structured into four parts (see Appendix). First, we collected information about respondents (e.g. roles and experience) and their respective organizations (e.g. size and industry sector). Then, utilizing the 18 practices recently proposed and empirically validated by Januszek et al. (2023), as they provide a holistic view of the people-centric, cultural and leadership aspects of Lean, we asked about the adoption level of SL practices in organizations. A five-point scale, ranging from 1 (strongly disagree) to 5 (strongly agree), was used. In the third part, we examined the adoption level of DEI practices using the scale developed by Silva et al. (2024). Studies of similar nature (e.g. Prashar et al., 2026) have also used these practices to assess the development of DEI practices in organizations. Fifteen practices were utilized and assessed through a similar five-point scale (from 1 = strongly disagree to 5 = strongly agree). Finally, we asked respondents about their PS. We assessed PS through seven items derived from the work of Carmeli (2007), which adapted the scale from Edmondson (1999). A five-point scale, varying from 1 (strongly disagree) to 5 (strongly agree), was used. The questionnaire was pretested for face and content validity by two academics and two practitioners, who suggested minor changes to improve its clarity.
To assure respondents were truly able to provide legitimate information about the phenomenon under investigation, some selection criteria were defined. First, we aimed at organizations that have been implementing LP for at least 2 years, which would give them a minimum level of exposure to its practices (Tortorella et al., 2016). Second, since LP implementation may be affected by the socioeconomic context where the company is inserted (Erthal and Marques, 2018), we focused on organizations located in nations with similar socioeconomic conditions, such as Brazil and India, which are two large-sized emerging economies with similar socioeconomic challenges. Previous research (e.g. Tortorella et al., 2024) has already considered merging data sets from both countries, and controlling for the effect of the socioeconomic context. Results indicated no significant difference between respondents from both contexts. As we did not find significant difference between respondents from both countries, we argue that both contexts may be feasible for investigating our research problem, and data sets may be merged. Third, as the pervasiveness of LP may vary across different industry sectors (Pathiratne et al., 2018), we solely involved respondents from manufacturing organizations. Fourth, due to our study’s objective, organizations should have clear initiatives of DEI implementation. This was verified through an initial question that asked respondents whether DEI practices were adopted in their organization, and to provide examples to justify the answer. Based on the depth of the provided arguments, we determined the eligible participants to join our investigation. Finally, all respondents should play a middle (e.g. coordinator or supervisor) or senior (e.g. director or manager) management role in their organizations, which would ensure a broader view of the organizational issues and practices. The establishment of these selection criteria conduced to a nonrandom choice of organizations to be surveyed, which is a common strategy in other studies on LP (e.g. Shah and Ward, 2003; Shah and Ward, 2007; Tortorella et al., 2016).
The questionnaire was adequately translated and initially sent by e-mail to 965 companies that met the selection criteria in India and Brazil. The first e-mail message containing the questionnaire was sent in October 2024, and two follow-ups were sent in the following weeks. The final sample consisted of 271 valid responses, representing a response rate of 28.08%, which is higher than the 15% average rate in management surveys (Hair et al., 2006). The data sample presented a balanced number of respondents for each contextual variable, as shown in Table 1.
Sample characteristics (n = 271)
| Characteristics | Quantity | % |
|---|---|---|
| Country | ||
| Brazil | 119 | 43.9 |
| India | 152 | 56.1 |
| Role of respondent | ||
| Middle manager | 155 | 57.2 |
| Senior manager | 116 | 42.8 |
| Work experience | ||
| ≤ 5 years | 137 | 50.6 |
| > 5 years | 134 | 49.4 |
| No. of employees | ||
| < 500 employees | 136 | 50.2 |
| ≥ 500 employees | 135 | 49.8 |
| Manufacturing sector | ||
| Chemical | 82 | 30.2 |
| Food and beverages | 59 | 21.8 |
| Metal-mechanics | 46 | 17.0 |
| Textile | 45 | 16.6 |
| Automotive | 14 | 5.2 |
| Other | 25 | 9.2 |
We checked for the possibility of nonresponse bias using Armstrong and Overton’s (1977) procedure. We examined the differences in means between the early (respondents to the first e-mail sent; n1 = 166) and the late (respondents to the two follow-ups; n2 = 105) participants utilizing the Levene’s test for equality of variances and a t-test for the equality of means. Results displayed significance levels higher than 5%, which indicates that groups were not different in terms of their means and variances, consequently disregarding any potential nonresponse bias. We also tested responses for reliability through their Cronbach’s alpha values (Meyers et al., 2006). Responses for SL practices, DEI practices, and psychological safety respectively presented alpha values of 0.804, 0.789 and 0.812, which suggested a high reliability (i.e. > 0.60). External validation of SL practices was not conducted, since these practices have already been validated in the literature (Januszek et al., 2023). Hence, we considered them as pertaining to a single dimension, SL implementation level. A similar assumption was made for the DEI implementation and psychological safety, which were denoted as single dimensions each.
3.2 Clustering and analysis of data
Clustering methods are utilized to assess relationships within a database in search of a summarized representation of data, clustering observations in a smaller number of sets (Everitt, 1980). Observations in a cluster should be similar to those assigned to the same cluster, and different from those assigned to other clusters. Hence, we carried out three clustering of observations in SPSS using questions on:
the adoption level of SL practices;
the adoption level of DEI practices; and
psychological safety as clustering variables.
In all clustering analyses conducted on the same sample of responses, we initially performed Ward’s hierarchical method to identify the number of clusters (k) using the resulting dendrograms (Gordon, 1999). Then, we applied the k-means clustering method to reorganize the observations into k clusters (Rencher, 2002).
Using the clustering results, we tested for differences in frequencies across clusters in each set using the chi-square test with contingency tables and adjusted residuals. For that, we initially checked the sample for normality using the Kolmogorov–Smirnof (KS) test, whose results indicated that the data do not follow a normal distribution (p-value < 0.05), justifying the application of a nonparametric technique. Using the dimensions obtained from the clustering analysis, we deemed these variables as categorical, allowing us to test the hypothesis that frequencies in the contingency table were independent (Tabachnick and Fidell, 2013). We examined whether the frequency of observations from the cluster of SL implementation was associated to the adoption level of DEI practices according to the level of PS. We considered significant associations with adjusted residual values larger than |1.68|, |1.96| and |2.58|, corresponding to significance levels of 0.10, 0.05 and 0.01, respectively.
4. Results
When clustering using the adoption level of SL practices as variables, we identified two clusters (see Figure 2(a). An Analysis of Variance (ANOVA) was carried out after the rearrangement of clusters to verify differences in means using data from each cluster. For all eighteen clustering variables, significant differences in means (p-values < 0.01) were found (see Table 2). The 134 observations assigned to cluster 1 presented lower average adoption levels, hence, the cluster was labeled as low SL adoption; the remaining 137 observations assigned to cluster 2 had higher average adoption levels of SL practices, and the cluster was labeled high SL adoption.
 The three horizontal dendrogram plots labelled a, b and c, where plot a shows clusters for Soft Lean practices adoption, plot b shows clusters for Diversity, Equity and Inclusion practices adoption, and plot c shows clusters for psychological safety levels, with hierarchical branching structures indicating how observations group together at different similarity levels, and each dendrogram displays multiple branches merging into larger clusters, representing patterns of adoption and variation across organisations.
Dendrograms based on Ward’s hierarchical method
The three horizontal dendrogram plots labelled a, b and c, where plot a shows clusters for Soft Lean practices adoption, plot b shows clusters for Diversity, Equity and Inclusion practices adoption, and plot c shows clusters for psychological safety levels, with hierarchical branching structures indicating how observations group together at different similarity levels, and each dendrogram displays multiple branches merging into larger clusters, representing patterns of adoption and variation across organisations.Dendrograms based on Ward’s hierarchical method
Results of the clusters ANOVA
| SL practices | Low SL (n = 134) | High SL (n = 137) | ANOVA | ||
|---|---|---|---|---|---|
| Mean | SD | Mean | SD | F-value* | |
| Employees are encouraged to actively drive suggestion programs | 2.40 | 1.20 | 2.94 | 1.11 | 14.028 |
| Our organization forms cross-functional project teams to solve problems | 2.33 | 1.10 | 3.26 | 1,06 | 56.241 |
| We have implemented tools and methods to deploy a continuous improvement process | 2.27 | 1.11 | 3.16 | 1.07 | 52.490 |
| Each of our employees within our work teams is cross trained so that they can fill in for others when necessary | 2.52 | 1.09 | 3.10 | 1.15 | 20.124 |
| At our organization, we have implemented a formal program to increase the flexibility of our employees. Employees rotate to maintain their qualification | 2.30 | 1.13 | 3.18 | 1.15 | 47.492 |
| We continuously invest in the training and qualification of our employees. We have a dedicated development and qualification program for our employees | 2.33 | 1.17 | 3.20 | 1.15 | 41.458 |
| We emphasize standardization as a strategy for continuously improving our processes, products and services | 2.34 | 1.11 | 3.02 | 1.14 | 27.877 |
| We use our documented operating procedures to standardize our processes | 2.45 | 1.04 | 2.98 | 1.20 | 15.649 |
| Optimized operating procedures are documented as best-practice processes and rolled-out throughout the organization | 2.17 | 1.14 | 2.78 | 1.16 | 25.301 |
| Performance charts at each of our departments indicate performance objectives | 2.36 | 1.09 | 3.34 | 1.18 | 59.084 |
| Charts showing current performance status are posted on the departments and visible to everyone | 2.21 | 1.06 | 3.17 | 1.21 | 63.259 |
| Charts showing current performance and schedule compliance are posted in the departments and visible to everyone | 2.31 | 1.15 | 3.34 | 1.21 | 72.326 |
| Technical documents and workplace information are posted in the departments and are easily accessible and visible to everyone | 2.33 | 1.20 | 2.96 | 1.19 | 25.596 |
| Our vision, mission and strategy are broadly communicated and lived by our employees | 2.44 | 1.14 | 3.18 | 1.19 | 36.580 |
| The goals and objectives of the organization are closely linked and consistent with corporate objectives. The organization has a clear focus | 2.50 | 1.17 | 3.07 | 1.16 | 17.228 |
| The overall objectives of the organization are closely linked to the team or personal objectives of our teams and employees | 2.42 | 1.13 | 3.06 | 1.15 | 22.290 |
| We continuously measure the quality of our processes by using process measures | 2.12 | 1.13 | 3.07 | 1.10 | 54.375 |
| Our process measures are directly linked to our organization objectives | 2.44 | 1.16 | 2.99 | 1.13 | 16.390 |
| DEI practices | Low DEI (n = 156) | High DEI (n = 115) | ANOVA | ||
|---|---|---|---|---|---|
| Mean | SD | Mean | Std. dev | F-value* | |
| My organization has a formal program to ensure a diverse workplace | 2.19 | 1.15 | 3.10 | 1.16 | 43.923 |
| My organization has a formal program to ensure equal opportunities for age diversity among our workforce | 2.39 | 1.14 | 3.19 | 1.14 | 35.316 |
| My organization has a formal program to ensure equal opportunities for cultural diversity among our workforce | 2.39 | 1.19 | 3.04 | 1.13 | 21.788 |
| My organization has a formal program to ensure equal opportunities for gender diversity among our workforce | 2.35 | 1.14 | 3.24 | 1.15 | 41.622 |
| My organization has a formal program to ensure fair employment practices related to recruiting workforce | 2.44 | 1.16 | 3.15 | 1.18 | 24.287 |
| My organization has a formal program to ensure fair employment practices related to compensation systems | 2.57 | 1.19 | 3.16 | 1.14 | 16.828 |
| My organization has a formal program to ensure fair employment practices related to performance appraisals | 2.22 | 1.18 | 3.30 | 1.11 | 66.550 |
| My organization has a formal program to reduce psychological harassment among workforce | 2.42 | 1.14 | 3.18 | 1.19 | 31.202 |
| My organization has a formal program to reduce sexual harassment among workforce | 2.40 | 1.11 | 3.40 | 1.14 | 75.536 |
| My organization has a human rights policy to avoid any form of discrimination among workforce | 2.24 | 1.08 | 3.37 | 1.16 | 83.748 |
| My organization has a formal program to include minorities among our workforce | 2.31 | 1.10 | 3.18 | 1.18 | 40.522 |
| My organization has a formal program to include people with physical disabilities among our workforce | 2.55 | 1.09 | 3.11 | 1.14 | 17.023 |
| My organization has a formal program to include people with mental disabilities among our workforce | 2.45 | 1.10 | 3.21 | 1.15 | 30.832 |
| My organization has a formal program to include people from economically weaker sections among our workforce | 2.24 | 1.14 | 3.19 | 1.17 | 56.286 |
| My organization has a formal program to buy from minority-owned business enterprise suppliers | 2.48 | 1.15 | 3.18 | 1.17 | 28.105 |
| PS | Low PS (n = 163) | High PS (n = 108) | ANOVA | ||
| Mean | SD | Mean | SD | F-value* | |
| In my organization, if you make a mistake, it is often held against you | 2.29 | 1.15 | 3.62 | 1.19 | 124.218 |
| In my organization, members are able to bring up problems and tough issues | 2.22 | 1.15 | 3.38 | 1.17 | 83.356 |
| In my organization, people sometimes reject others for being different | 2.47 | 1.03 | 3.29 | 1.17 | 42.244 |
| In my organization, it is safe to take a risk | 2.27 | 1.10 | 3.17 | 1.12 | 45.163 |
| In my organization, it is difficult to ask other members for help | 2.31 | 1.12 | 3.30 | 1.14 | 61.731 |
| In my organization, no one would deliberately act in a way that undermines my efforts | 2.29 | 1.14 | 3.27 | 1.15 | 57.758 |
| In my organization, my unique skills and talents are valued and utilized | 2.34 | 1.09 | 3.46 | 1.17 | 92.151 |
*All F-values significant at 1%
The same observations were clustered using the adoption level of the fifteen DEI practices as clustering variables. A similar procedure was used, resulting in two clusters [see Figure 2(b)]. The ANOVA yielded significant differences in means (p-values < 0.01) in all practices. Cluster 1 comprised 156 observations whose average adoption level was lower, hence being named as low DEI adoption. Cluster 2, composed of 115 observations, had higher average adoption levels of DEI practices, which justified its label of high DEI adoption.
Finally, the third cluster analysis considered the PS items. As displayed in Figure 2(c), two clusters were found, whose differences in means were significant (p-values < 0.01) (see Table 2). The first cluster corresponded to 163 observations whose average levels of psychological safety were lower, being denoted as low PS. The second cluster consisted of 108 observations that presented higher average levels, being labeled high PS.
Table 3 shows the contingency table and chi-square results for all combinations of levels of SL practices and DEI practices adoption, according to the levels of PS. Frequencies indicated the number of organizations assigned to each cluster combination. For instance, there were 112 organizations that were simultaneously regarded as low SL, low DEI and low PS. Adjusted residual values showed that in organizations where the adoption level of SL practices is lower, all associations between DEI practices and PS levels are significant at 1%. When both SL and DEI practices are poorly adopted, the frequency of organizations with lower PS (112) is significantly greater than the ones with a higher level of PS (7). When the adoption of DEI practices increases but the adoption of SL practices remains low, a less prominent difference in frequencies was observed between low PS (9) and high PS (4)0.2
Chi-square among levels of SL and DEI adoption according to PS
| Soft lean implementation | Diversity, equity and inclusion implementation | Psychological safety | Total frequency | Chi-square | |||
|---|---|---|---|---|---|---|---|
| Low PS | High PS | ||||||
| Frequency | Adjusted residual | Frequency | Adjusted residual | ||||
| Low SL | Low DEI | 112 | 3.1 | 9 | −3.1 | 121 | 9.502 |
| High DEI | 9 | −3.1 | 4 | 3.1 | 13 | (p-value < 0.01) | |
| High SL | Low DEI | 15 | 1.8 | 20 | −1.8 | 35 | 3.291 |
| High DEI | 27 | −1.8 | 75 | 1.8 | 102 | (p-value < 0.10) | |
When SL practices are highly adopted, adjusted residuals indicated a significance level of 10% for the association between DEI adoption and PS levels. For these cases, if DEI practices are not well disseminated, the difference in frequencies between organizations with lower (15) and higher (20) levels of PS is not as evident. On the other hand, when both SL and DEI practices are highly adopted, there seems to be a great increase in PS levels, leaping from a frequency of 27 organizations at a low PS to 75 organizations with higher levels of PS, as illustrated in Figure 3.
 The grouped bar charts compare organisational counts across categories of Soft Lean adoption and Diversity, Equity and Inclusion levels, where the left section represents Low Soft Lean adoption organisations and the right section represents High Soft Lean adoption organisations, each further divided into Low Diversity, Equity and Inclusion and High Diversity, Equity and Inclusion groups, with bars indicating counts for Low psychological safety and High psychological safety, and numerical values such as 112, 9, 4, 15, 20, 27 and 75 displayed above bars to show distribution differences across categories.
Relationship between SL and DEI practices according to PS levels
The grouped bar charts compare organisational counts across categories of Soft Lean adoption and Diversity, Equity and Inclusion levels, where the left section represents Low Soft Lean adoption organisations and the right section represents High Soft Lean adoption organisations, each further divided into Low Diversity, Equity and Inclusion and High Diversity, Equity and Inclusion groups, with bars indicating counts for Low psychological safety and High psychological safety, and numerical values such as 112, 9, 4, 15, 20, 27 and 75 displayed above bars to show distribution differences across categories.Relationship between SL and DEI practices according to PS levels
5. Discussion
Now we discuss our results in light of the body of knowledge. As a human-centric approach (Bhasin and Burcher, 2006; Achanga et al., 2006), the active involvement of employees in continuous improvement activities is a key requirement for truly implementing LP. As the understanding of LP evolved, the set of practices that characterize its implementation also evolved, broadening from strictly technical to sociocultural aspects as well (Soliman and Saurin, 2017). This gave rise to the emergence of SL practices (Bortolotti et al., 2015), which are supposed to encourage the proper behaviors that will support LP implementation in organizations. In this sense, it is somewhat expected that the adoption of SL practices will positively impact employees’ PS, fostering their creativity and assuring a collaborative workplace in manufacturers (Januszek et al., 2023).
However, our results suggested that such an impact can be significantly increased, and the sole adoption of SL practices might not be sufficient to achieve the necessary levels of PS in an organization. Other approaches (e.g. DEI initiatives) should be combined to boost PS levels, raising a complementary view of LP. This outcome is aligned with the concepts from the Theory of emergent states, which posit that complex systems (e.g. PS in manufacturing organizations) can exhibit new features, named “emergent properties,” which arise from the interactions between their individual components (Kozlowski and Ilgen, 2006; Waller et al., 2016). This means that employees’ PS may not be fully comprehended by assessing by SL practices separately. The Theory of emergent states assumes that new characteristics emerge from the interactions within the system (Coultas et al., 2014), such as SL practices and DEI initiatives, rather than being inherent in the individual elements, such as only SL practices.
At the same time, DEI initiatives are oriented to enhance collaboration in the workplace, allowing everyone to voice their opinions and creating a more engaging team dynamic (Labarca et al., 2024; Gündemir et al., 2024). In this sense, the positive impact on employees’ PS generated by their adoption is not a surprise, being also suggested by previous research (e.g. Woods et al., 2024; Dang et al., 2024). Nevertheless, similarly to what has been observed for SL practices, solely implementing DEI initiatives may only lead to marginal benefits, which is somewhat aligned with the indications from King (2022) and Waters et al. (2023). In other words, the potential impact of DEI practices on employees’ PS may only be fully achieved in organizations that present an adequate culture, justifying the adoption of additional management approaches to support them.
Since LP has been widely disseminated (especially in the manufacturing industry) in the past four decades (Stone, 2012; Furstenau et al., 2021), organizations have already had some levels of exposure to its practices and principles being minimally familiar with it. The adoption of SL practices in particular may trigger the establishment of the required organizational culture (Bortolotti et al., 2015; Tortorella et al., 2017; Vanichchinchai, 2023), setting the behaviors and procedures to form a fundamental basis on which organizations can build their DEI initiatives. This could catalyze the effects of DEI practices, resulting in even greater PS levels. Hence, we argue that there is a synergistic relationship between SL and DEI practices, and it positively increases employees’ PS in organizations.
6. Conclusions
This research examined the effect of the relationship between SL and DEI practices on employees’ PS. Senior and middle managers from manufacturing organizations in Brazil and India were surveyed. Our findings present relevant contributions to theory, practice and society, as detailed below.
6.1 Implications to theory
From a theoretical point of view, this study raised empirical evidence on the relationship between SL practices (a fundamental aspect of LP implementation usually underestimated by organizations) and DEI practices (a relatively more recent organizational initiative whose impacts are not yet fully understood), and its effects on employees’ PS. By integrating DEI initiatives, organizations can mitigate potential barriers to PS, such as exclusionary behaviors, biases and hierarchical constraints, thereby amplifying the effectiveness of SL practices. Although we acknowledge that SL practices may have certain overlap with DEI initiatives, they are not explicitly focused on reducing specific issues, such as exclusionary behaviors. Therefore, we argue that DEI initiatives function as a complement to SL practices. This finding is especially important for companies that are approaching DEI and LP separately. Since they have a synergistic effect on employees’ PS, it is vital that leaders see these approaches as concomitant ones and not excluding. To the best of our knowledge, this is the first study with such an objective and of this exploratory nature. Hence, we argue that our findings contribute to the literature, adding important new insights to the theories on LP, DEI and PS. For instance, although LP and SL practices, in particular, have been acknowledged as elements of a socio-technical system, their impact might be boosted when DEI initiatives are concomitantly implemented, achieving significantly higher levels of PS.
6.2 Contributions to practice
In practical terms, our investigation offers practitioners arguments to reinforce their efforts on both SL and DEI practices, especially in the manufacturing workplace (organizational context of this research). As PS becomes a key factor for increasing team performance and innovation, organizations must develop countermeasures to ensure its proper establishment among the workforce. Managers and leaders should recognize the complementary nature of SL and DEI practices and prioritize strategies that holistically address both operational efficiency and human-centric workplace dynamics. LP (more specifically SL practices) and DEI initiatives can function as a means for that, improving employees’ PS, and helping organizations anticipate potential issues and strategically achieve the expected goals.
6.3 Societal implications
From a societal perspective, fostering PS through the adoption of both SL and DEI practices is an issue that goes beyond the walls of an organization. The ability to speak up about one’s ideas without the fear of being humiliated or ashamed is something that should be valued and reinforced in modern societies. This is especially relevant when achieved through offering people equal opportunities. When properly adopted, LPper se can positively impact society (Marcon et al., 2019; Chavez et al., 2024), serving as a fundamental basis for implementing DEI initiatives. We argue that the combined effects of both SL and DEI practices can lead to more creative and engaged individuals, hence, societies with higher levels of life quality.
6.4 Limitations and future opportunities
It is important to highlight some limitations of our study. First, we only involved participants from manufacturers located in Brazil and India, leading to results that might be specific to this context. Although this undermines the generalization of our findings, it may also increase their validity to the context under study, being potentially replicable in similar contexts. Hence, further research should be conducted to test whether our findings can be expanded and/or complemented by the inclusion of different work settings. Second, despite undertaking some strict procedures and selection criteria to assure key informants were involved in the survey, we acknowledge their organizational perception might represent a limitation. Although PS can vary among individuals, our unit of analysis was the organization as a whole. Future studies could deepen into one specific organization and collect data from each individual to compare the outcomes with our research, testing the validity of our indications. Moreover, future research should explore the long-term impact of SL and DEI integration on organizational performance metrics, such as innovation rates, employee retention and overall productivity. Finally, our investigation did not encompass the operational performance results of the organizations. Organizations in which employees feel psychologically safer are expected to perform better. However, our results did not present any evidence of that. More studies should be conducted to verify this relationship, hence, presenting a more holistic approach.
Funding
No funding was provided for this research.
Data availability
The data that support the findings of this study are available from the corresponding author, GT, upon reasonable request.
Author credit information
Guilherme Tortorella was responsible for conceptualization and writing the original draft of the research; Anupama Prashar was responsible for data collection; Jorge Luis García-Alcaraz was responsible for draft review; Diego Tlapa was responsible for data analysis; Paolo Gaiardelli was responsible for consolidation of the literature; and Matteo Zanchi was responsible for revising language and formatting.
References
Appendix. Applied questionnaire