The way in which managers differ when confronted with risky options or when evaluating different alternatives constitutes a fundamental part of organizational risk management. This study aims to investigate how managerial risk-taking attitudes (i.e. ethical and financial risk-taking as a trade-off between benefit and riskiness) change over time and based on gender.
The authors conducted a cross-sectional study on a sample of Italian executives and measured their perceptions of risk-taking, risk perception and risk-benefit, all referring to the company they worked for in the ethical and financial domain. The study also collected demographic data to gather information on age and gender. The authors analyzed data collected using multilevel analysis.
The results show that perceived benefits are the main drivers of risk-taking attitudes in both domains. Age and gender are not significant direct predictors of risk, but interactions with domains reveal insightful patterns.
Overall, this study highlights the need to assess the whole pattern of relationships emerging from the range of situational variables characterizing a specific population. Concerning the organizational context, it means addressing the role of organizational variables in influencing risk-taking so as to determine the extent to which organizational policies are indeed effective in fostering efficient organizational risk management.
Introduction
Current unpredictable work environments imply that risk attitude plays a vital role in understanding managerial decision-making behaviour (Pennings and Smidts, 2000; Tufano, 1996; Tversky and Kahneman, 1981). The way managers differ when confronted with risky options or when evaluating alternatives constitutes a fundamental part of organizational risk management. However, to the best of our knowledge, little empirical research has been conducted to investigate how risk attitudes and risk behaviours may change over time and based on gender among managers.
While considerable research in the field of psychology has focused on understanding the nature of risk across the lifespan, including the characterization of older adults as risk-avoidant (Deakin et al., 2004; Rolison et al., 2012; Turner and McClure, 2003), particularly in the financial domain (Cristofaro, 2019; Mata et al., 2011; Josef et al., 2016; Tommasi et al., 2023), these findings may not fully explain the dynamics of how changes in managerial risk attitudes over time impact ensuing decision-making processes. In addition, even though psychological literature has mainly focused on the relationship between ageing and risk-taking in the financial domain (Bakshi and Chen, 1994; Rolison et al., 2012; Zamarian et al., 2008), studies investigating such a relationship among managers and within a validated theoretical framework seem to be quite outdated (see, e.g. MacCrimmon and Wehrung, 1990; Schoemaker, 1990; Pennings and Smidts, 2000; Vroom and Pahl, 1971).
Understanding how managerial risk attitudes change over time represents a key component of organizational risk management as it may be related to the development of the organizational strategy over time. To contribute to the understanding of managerial risk attitude and provide evidence-based knowledge for supporting managers’ decisions, the present contribution investigates domain-specific risk-taking (DOSPERT) attitudes (i.e. risk perceptions, risk behaviours and expected benefits from risky behaviours in the financial and ethical domains) among managers operating in a variety of different economic segments. It does so by providing a brief overview of significant developments regarding the conceptualization of risk in the psychological literature and briefly presenting a validated tool for the measure of DOSPERT. Second, the paper focuses on extending the research background underlying the investigation of the age-risk and gender-risk relationships concerning the Italian managerial population. Lastly, the paper concludes by encompassing the analysis of the relationships between ageing, gender, and risk attitude to organizational risk management.
Various authors have addressed the topic of risk-taking following the ethical and financial domains, yet these domains have been considered separately (Markiewicz and Weber, 2013; Weller et al., 2015). To our knowledge, no research has considered ethical and financial domains simultaneously using a multilevel approach. In this paper, we argue that considering both domains in parallel provides a series of insights into the processes and dynamics relating to risk-taking among managers. Financial and ethical risks do not appear to be always separated in the organizational setting but rather intertwined in managerial decision-making. A decision to engage in a risky financial venture may have ethical implications and, conversely, ethical lapses can lead to financial risks for the organization. Analyzing risk-taking behaviour, perceptions and benefits across both domains allows us to understand managerial decision-making processes. This can offer indications on how they might be implemented in organizational risk management strategies and inspire future perspectives for research-conducting and possible organizational interventions.
Literature review and hypothesis development
Conceptualizing and measuring risk
Within the psychological literature, risk-taking has often been conceptualized either as a stable personality trait, which can group individuals based on their risk-taking or risk-aversive styles (Hanoch et al., 2006), or a small cluster of sub-traits (Rolison et al., 2012). Such a conceptualization of risk attitude originates from the expected utility framework (Fishburn, 1988; von Neumann and Morgenstern, 1947; Schoemaker, 1982), which assumes risk attitude as the curvature of the utility function, derived from a series of risky choices (Keeney and Raiffa, 1976; Weber et al., 2002). That is, individual risk attitude represents a person’s standing on the continuum from risk-aversion to risk-seeking and has been considered a dispositional characteristic relatively stable over time (Weber et al., 2002). Against this background, it has been argued that risk attitude might be better described as context- and content-specific, rather than a stable personality trait (Blais and Weber, 2006; Weber et al., 2002). In this sense, preferences for a risky option may reflect both the expected benefits form it supposed to derive, as well as the attitudes towards perceived risk, which both can vary depending on the considered domain (Weber et al., 2002). Instead of focusing only on dispositional factors, individual aptitudes or stable preferences towards risk, this conceptualization of risk emphasizes contextual factors that contribute to perception of riskiness. In this framework, risk-taking is not seen as a unitary phenomenon, but rather as reflecting the relative weight a person gives to the two main motivations, namely, the risky option and its supposed return (Figner and Weber, 2011).
In these regard, the research provided evidence that risk perceptions account for differences in risk-taking behaviours among managers and entrepreneurs (Brockhaus, 1982; Cooper et al., 1988), and that factors influencing risk perceptions affect managerial risk behaviours (March and Shapira, 1987). Moreover, risk perceptions and risk benefits have been found to explain differences in risk-taking across gender and content domains (Weber et al., 2002). Similarly, results showed that apparent cultural differences in risk-taking are explained by different perceptions of risks rather than by different risk attitudes (Hoffman et al., 2014; Weber and Hsee, 1998, 1999). Likewise, the perceived benefit from a risky activity has been found to relate to the propensity to take risks and, to a lesser extent, to risk perceptions (Hanoch et al., 2006).
The DOSPERT scale has been developed to capture the nature of risk attitude as composed of risk perceptions, perceived benefits and risk behaviours across different domains (Blais and Weber, 2006). This self-report questionnaire addresses the domain-specific nature of risk across six broad domains (Weller et al., 2015), of which the financial and the ethical ones are the most relevant with respect to the managerial role. Whereas financial risk-taking constitutes a general part of managerial decision-making, a more contemporary and often politicized aspect of managerial responsibilities also includes ethical risk-taking. Studies conducted with the DOSPERT scale provided evidence of its ability to capture the domain-specific nature of real-world risk-taking (Breuer et al., 2017, Rolison et al., 2012), for example, by predicting risk behaviours in the financial domain (Markiewicz and Weber, 2013), and behaviours connected with cognitive control and anticipation of performance errors (Brown and Braver, 2007).
Age and gender differences in risky choices from a psychological perspective
Evidence from research shows that the propensity for risk behaviour increases in adolescence, peaks in young adulthood and declines with aging (Mata et al., 2016; Dohmen et al., 2011). Accordingly, studies investigating self-reported risk-taking provide consistent evidence of a decrease in risk-taking across adulthood (Bonem et al., 2015; Roalf et al., 2012; Rolison et al., 2012). Notably, the findings from research in this field underlined the need for adopting a domain-specific approach to the investigation of the risk–age relationship, because the results showed that reductions in risk-taking across the life cycle vary based on the considered domain (Bonem, et al., 2015; Rolison et al., 2012) and, specifically, that the pattern of normative age-related decline varies as a function of life domain, with some domains proving relatively stable across adulthood (Josef et al., 2016).
Gender differences in risk-taking are well documented (Figner and Weber, 2011). In a meta-analysis conducted among 150 studies, Byrnes and colleagues (1999) reported that risk-taking differences with age are likely to differ for men and women based on the considered risk domain. Research within the DOSPERT framework revealed that in the ethical and financial domains, effects of age on risk-taking attitudes interact with gender. For example, it has been reported that whilst men’s attitude towards risks in the financial domain follows different trends during the life span (see above), financial risk-taking among women varies little with age (Rolison et al., 2012). With this regard, it has been argued that gender differences in risk-taking are often mediated by culturally condition differences in the perceptions of both risks and benefits, rather than by differences in risk attitude (Weber and Johnson, 2008; Weber, 2010; Figner and Weber, 2011).
These studies provide a rich background to explore how risk attitude, considered a function of perceived risk and benefit, may vary across gender and the adult lifespan among managers. Such an investigation appears of great value because it has been argued that ecological circumstances may reduce differences in risk-taking between younger and older individuals (Mata et al., 2016), and that the specific population studied could be significant in understanding how older adults deal with risky situations (Bonem et al., 2015).
Age and gender differences in risk attitude among managers
As reported by Faccio and colleagues (2016), traditional explanations for why decision makers’ preferences and characteristics play a role in the investment selection choice include agency (Jensen, 1986), which implies that managers act as to maximize their own utility, rather than the utility of shareholders. Thus, within such a framework, the agency is likely to affect corporate decisions and outcomes. Such a consideration deserves attention because previous research reported that managers have different risk attitudes when making decisions involving personal money versus company money (MacCrimmon and Wehrung 1986, 1990), which might be explained as an effect of agency on individual risk attitude. However, with this regard, to the best of our knowledge, no previous studies have been conducted to investigate how corporate risks perceptions and benefits from these supposed to derived may influence risk-taking of managers across their lifespan, and whether gender differences occur.
Drawing on the risk–return framework of risky choice (i.e. risk-taking as a trade-off between benefit and riskiness; Weber et al., 2002), in this article, we present a cross-sectional study of a sample of executives and measure their perceptions of risk-taking, risk perception and risk-benefit, all referred to the company they worked for (see Appendix), in the ethical and financial domain. We argue that, among managers, risk perceptions would negatively affect risk-taking in both the ethical and financial domains. As opposed, expected benefits of the risky options would positively relate to risk-taking in both the considered domains. Moreover, we expect that risk-taking would reduce with age. Specifically, building on the above-mentioned evidence from research, we expect younger male managers to report higher risk-taking, especially for what concerns the financial domain. Lastly, given the well-documented evidence that women are more risk-averse than men (Faccio et al., 2016; Tipu, 2017), we expect that men, compared to women, would report higher risk-taking in both the ethical and the financial domains.
Method
Participants
Participants (n = 204, F = 88, M = 116, age range = [22,71], mean age = 40.43, SD = 9.43) were recruited from a national panel of executives, from which we identified those with responsibilities for defining and executing their company’s strategy, i.e. those that stated in their profile to be operating board attendees. Missing data are about 17% of the sample and are mostly due to 5% of participants that withdraw after the demographic questions and a 13% of participants that withdraw early during the compilation. Because the percentage of missing not at random (MNAR) data is not irrelevant, these participants were considered for the analyses. Furthermore, three participants over 61 years were removed as they were the only ones of their age and showed particularly extreme response bias. Indeed, in comparison to the other age ranges, participants over 61 years were strongly underrepresented in the initial sample. In the resulting sample (n = 166, F = 75, M = 91, age range = [22,61], mean age = 39.68, SD = 8.75), the age of female participants (mean = 37.97, SD = 7.49) is slightly lower (F(1,154) = 3.087, p = 0.08, η2p = 0.0196) than the males’ one (mean = 41.11, SD = 9.48). The proportion of women and men is homogenous within the age ranges (χ2(2) = 3.955, p = 0.14, V = 0.155), confirming that most of the abandoning participants were males.
Materials
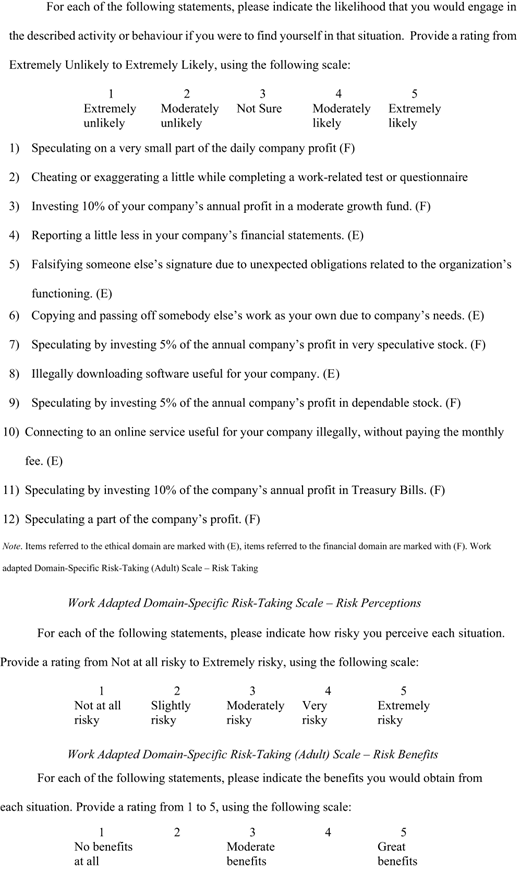
DOSPERT, perception and benefit were measured with a subset of 12 adapted items from the DOSPERT scale (Weber et al., 2002). Namely, a six-item scale with DOSPERT, perception and benefit framed in ethical terms (item example: “Speculating a part of the company’s profit”) and six-item DOSPERT, perception and benefit framed in financial terms (item example:” Speculating by investing 5% of the annual company’s profit in dependable stock”). Each subset of items was translated into Italian and adapted to the working context (see the Appendix). Participants were instructed to rate the likelihood (e.g. five-point scales, 1 = Extremely unlikely to 5 = Extremely likely) that they would engage, perceive or enjoy described activities or behaviours if they were to find themselves in a given situation.
Data analytic plan
A first step in addressing risk attitudes among managers and their relationship to gender and age was to carry out intercorrelations and analysis of covariance (ANCOVA) (Rutherford, 2000). These were performed to examine the effects of the different rating scales per each domain (i.e. financial and ethical). Notably, differences between the ethical and the financial domains and differences between genders in the three main dimensions were assessed by means of non-parametric tests (Wilcoxon signed rank and Mann–Whitney) to account for the ordered nature of the rating scales. The items composing the three scales were then arbitrarily ordered with regard to the average scores of the best predictor to visually inspect individuals’ trends. An analysis of individual plots reveals whether random intercepts and slopes can be included as part of a multilevel approach to account for both inter-individual variability in mean likelihoods of an Y (dependent variable) and one or more Xs (independent variables). In turn, we applied the asymptotic Wilcoxon–Pratt signed-rank test for the multilevel analysis.
Results
Descriptive statistics and analysis of covariances
The internal reliabilities of the three rating scales (i.e. risk-taking behaviour, risk-benefit and risk-perception) of both financial and ethical domains were derived by the mean scores of them. Table 1 provides the Cronbach α values for the three main response scales in the two domains together with their bootstrapped 95% confidence intervals (square brackets) [1]. The intercorrelations between the scales across the different domains, together with their significance level, have been listed off diagonals. As it can be noted, the α values suggest a discrete-to-good internal consistency. On the one hand, intercorrelations show the consistency of the scales across the domains, but on the other hand, coefficients show that risk-benefit, and risk-taking behaviour, which are more positively correlated in comparison with risk-perception, seem to be more independent in relation to risk-taking. This clue appears to be confirmed by ANCOVAs analyses on the three dimensions’ resulting scores.
Reliability and intercorrelations in the off-diagonal cells for the main dimensions per each domain
| 1 | 2 | 3 | 4 | 5 | 6 | |
|---|---|---|---|---|---|---|
| 1 Risk perception ethical | 0.84 [0.81, 0.88] | |||||
| 2 Risk perception financial | 0.58*** | 0.68 [0.61, 0.75] | ||||
| 3 Risk benefit ethical | −0.27*** | −0.16* | 0.92 [0.90, 0.93] | |||
| 4 Risk benefit financial | −0.11 | −0.27*** | 0.70*** | 0.84 [0.81, 0.88] | ||
| 5 Risk-taking ethical | −0.11 | −0.08 | 0.29*** | 0.20** | 0.89 [0.86, 0.91] | |
| 6 Risk-taking financial | 0.07 | −0.14 (.) | 0.23** | 0.37*** | 0.80*** | 0.86 [0.83, 0.89] |
N = 166; (.) p < 0.10; *p < 0.05; **p < 0.01; ***p < 0.001
ANCOVAs were performed on the scores of the three dimensions to inspect which one amongst risk-benefit and risk perception best behaved as predictors of risk-taking. Variability of individual plots suggested that both random intercept and slopes might be considered within a multilevel approach to account for both inter-individual variability in mean likelihood of risk-taking and variations due to different propensities towards risk perception and expected benefits.
As it can be noted, there appear to be effects of both gender and risk-benefit on risk-taking, while there is no effect of age (see Table 2). Quadratic terms for age and interactions between gender and age have been considered but have not been significant at this level of analysis. In addition, risk perception appears to be independent from the actual behaviour of individuals (i.e. risk-taking behaviour), as previously suggested by the intercorrelations.
Results of ANCOVA on risk-taking scores on gender, age, risk benefit and perception, separately on the ethical and financial domains
| Ethical | Financial | |||||
|---|---|---|---|---|---|---|
| Est. (SD) | t(156) | η2p | Est. (SD) | t(156) | η2p | |
| Intercept | 1.35 (0.63) | 2.142* | 1.36 (0.72) | 1.885 (.) | ||
| Risk benefit | 0.44 (0.10) | 4.539*** | 0.1160 | 0.52 (0.10) | 5.001*** | 0.1374 |
| Risk perception | −0.05 (0.10) | −0.480 | 0.0015 | −0.05 (0.13) | −0.418 | 0.0011 |
| Gender | 0.54 (0.16) | 3.293** | 0.0578 | 0.36 (0.16) | 2.236* | 0.0308 |
| Age | 0.008 (0.009) | 0.835 | 0.0044 | 0.005 (0.009) | 0.513 | 0.0017 |
N = 166; (.) p < 0.10; *p < 0.05; **p < 0.01; ***p < 0.001; quadratic term on age and interactions were not significant
Multilevel analyses
Before proceeding with multilevel analyses, a visual inspection of the mean scores in all the three dimensions has been performed. Results are displayed in Table 3. Means of the ethical domain are higher than those of the financial domain for what concerns risk perception only, while the opposite might hold in both risk-benefit and risk-taking. In addition, the asymptotic Wilcoxon–Pratt signed-rank test in the overall condition shows that there is a difference in the ranking behaviour between the domains with regards to the main dimensions of risk perception (Z = 3.4573, p < 0.001), risk-benefit (Z = –6.6882, p < 0.001) and risk-taking attitude (Z = –2.3288, p = 0.020). The same significant trend can be detected when comparing domains and gender, exception given for the case of males in the dimension of risk-taking attitude, which shows no differences between the ethical and the financial domains (Z = –1.0911, p = 0.28). Moreover, Mann–Whitney tests do not reveal significant differences between men and women in both domains in terms of risk perception, whereas risk-benefit only shows a difference in the ethical domain (W = 4078.5, p = 0.019). The risk-taking attitude has a significant difference in the ethical domain (W = 2665.5, p = 0.021) and a tendency in the financial domain (W = 2774.5, p = 0.052).
Means and standard deviations for the three main dimensions within the ethical and financial domains
| Risk perception | Risk benefit | Risk-taking | |||||||
|---|---|---|---|---|---|---|---|---|---|
| Overall | M | F | Overall | M | F | Overall | M | F | |
| Ethical | 3.62 (0.77) | 3.62 (0.84) | 3.63 (0.69) | 1.81 (0.85) | 1.66 (0.75) | 2.00 (0.93) | 2.56 (1.08) | 2.74 (1.10) | 2.35 (1.01) |
| Financial | 3.43 (0.64) | 3.43 (0.68) | 3.44 (0.59) | 2.17 (0.79) | 2.11 (0.72) | 2.24 (0.87) | 2.69 (1.10) | 2.52 (1.15) | 2.83 (1.05) |
n = 166
Multilevel analyses [2] were then performed to analyze the three dimensions of risk while accounting for the age and gender of participants. Age was grand mean-centred to reduce multicollinearity and was modelled with both linear and quadratic terms. All possible interactions between the fixed factors were tested. A factor domain was considered to account for the variation of the response scales across ethical and financial domains. Independent analyses were then carried out for risk-benefit and risk perception, while risk-taking was analyzed as a function of the other two response scales. In the first step (Model A), only a random intercept was considered; as the second step (Model B), a random slope for expected benefit was introduced, and, lastly, a random slope for risk perception was added (Model C). Likelihood ratio tests were used to compare models. R2 values were provided to account for the proportion of variance explained by fixed factors alone (marginal) and by both fixed and random effects (conditional).
The main results are given together for risk perception and expected benefit scales (see Table 4) and separately for risk-taking, which involves the first two as predictors (see Table 5 and Figure 1). As it can be seen in Table 4 (left side), changes in risk-benefit appear to be associated to both fixed and random effects but, as suggested by conditional R 2c and marginal R 2m, the proportion of variance explained by random effects is almost ten times larger than the proportion explained by fixed effects. Inter-subjects’ variability is comparable with the residual one. Consistent with mean visual inspection, the financial domain shows higher means than the ethical one, and males generally exhibit lower scores than females in the ethical domain, but such a difference is strongly reduced in the financial one. There is a small significant effect of the quadratic term of age as a predictor, which appears to be moderated by both gender and domain. As to risk perception, the financial domain shows lower means than the ethical one, but no differences are related to gender or age, and no significant interactions were detected.
Results of multilevel models for risk benefit and risk perception
| Risk benefit | Risk perception | |||
|---|---|---|---|---|
| Estimate | Est. (SE) | t-test | Est. (SE) | t-test |
| SD residual | 0.787 | 1.021 | ||
| SD btw subs | 0.719 | 0.550 | ||
| Intercept | 2.123 (0.115) | 18.472*** | 3.640 (0.083) | 43.621*** |
| Domain (F) | 0.206 (0.059) | 3.492*** | −0.182 (0.046) | −3.935*** |
| Gender (M) | −0.452 (0.158) | −2.856** | 0.026 (0.101) | 0.258 |
| Age | −0.008 (0.012) | 0.657 | −0.008 (0.006) | −1.385 |
| Age2 | −0.002 (0.001) | −2.019* | −0.0006 (0.0005) | −1.066 |
| Domain (F) × Age | 0.013 (0.004) | 3.21** | ||
| Domain (F) × Age2 | 0.0015 (0.0004) | 2.985** | ||
| Gender (M) × Age2 | 0.0025 (0.0014) | 1.805 (.) | ||
| R 2m = 0.060 | R 2c = 0.487 | R 2m = 0.011 | R 2c = 0.234 | |
n = 166; Domain (F) = financial domain; Gender (M) = gender male; (.) p < 0.10; *p < 0.05; **p < 0.01; ***p < 0.001
Results of multilevel models for risk-taking attitude
| Risk-taking attitude | Model A | Model B | Model C | |||
|---|---|---|---|---|---|---|
| Estimate | Est (SE) | t-test | Est (SE) | t-test | Est (SE) | t-test |
| SD residual | 0.910 | 0.814 | 0.794 | |||
| SD btw subs | 0.951 | 1.622 | Cor. −0.88 | 1.174 | Cor. –0.69 0.13–0.59 | |
| SD slope benefit | 0.545 | 0.469 | ||||
| SD slope perception | 0.215 | |||||
| Intercept | 2.268 (0.337) | 6.734*** | 2.212 (0.373) | 5.937*** | 2.238 (0.330) | 6.790*** |
| Risk perception | −0.194 (0.067) | −2.906** | −0.109 (0.062) | −1.751 (.) | −0.111 (0.071) | −1.584 |
| Risk benefit | 0.384 (0.067) | 5.733*** | 0.286 (0.106) | 2.715** | 0.281 (0.097) | 2.906** |
| Domain (F) | −0.387 (0.368) | −1.050 | −0.314 (0.340) | −0.923 | −0.338 (0.337) | −1.002 |
| Gender (M) | 0.307 (0.479) | 0.641 | 0.461 (0.524) | 0.880 | 0.476 (0.466) | 1.021 |
| Age | 0.026 (0.038) | 0.688 | 0.007 (0.042) | 0.180 | −0.002 (0.037) | −0.048 |
| Age2 | −0.003 (0.004) | −0.736 | −0.003 (0.004) | −0.651 | −0.003 (0.004) | −0.771 |
| Benefit × domain (F) | 0.174 (0.076) | 2.305* | 0.206 (0.069) | 2.989** | 0.190 (0.068) | 2.795** |
| Domain (F) × gender (M) | 1.483 (0.540) | 2.747** | 1.232 (0.500) | 2.461* | 1.108 (0.495) | 2.241* |
| Gender (M) × Age2 | 0.010 (0.004) | 2.352* | 0.010 (0.005) | 2.167* | 0.010 (0.004) | 2.309* |
| Perception × domain (F) × gender (M) | −0.246 (0.113) | −2.177* | −0.176 (0.105) | −1.679 (.) | −0.171 (0.103) | −1.649 (.) |
| Benefit × Domain (F) × Gender (M) | −0.368 (0.121) | −3.054** | −0.3011 (0.112) | −2.689** | −0.255 (0.110) | −2.308* |
| Benefit × Domain (F) × Age2 | −0.002 (0.001) | −1.934 (.) | −0.0020 (0.0009) | −2.122* | −0.0018 (0.0009) | −1.953 (.) |
| Perception × gender (M) × Age | 0.021 (0.009) | 2.436* | 0.012 (0.008) | 1.509 | 0.009 (0.009) | 1.021 |
| Benefit × Gender (M) × Age2 | −0.0031 (0.0010) | −2.890** | −0.0033 (0.0014) | −2.311* | −0.0029 (0.0013) | −2.210* |
| Domain (F) × Gender (M) × Age2 | −0.016 (0.005) | −3.049** | −0.016 (0.005) | −3.437*** | −0.016 (0.005) | −3.402*** |
| Perception × Domain (F) × Gender (M) × Age2 | 0.0023 (0.0011) | 2.078* | 0.0023 (0.0010) | 2.330* | 0.0025 (0.0010) | 2.483* |
| Benefit × Domain (F) × Gender (M) × Age2 | 0.0047 (0.0013) | 3.735*** | 0.0045 (0.0011) | 3.927*** | 0.0041 (0.0011) | 3.636*** |
| R-squared | R2m = 0.147 | R2c = 0.592 | R2m = 0.139 | R2c = 0.666 | R2m = 0.129 | R2c = 0.679 |
| Likelihood ratio test | ModA vs ModB: LRT(2) = 236.04*** | ModB vs ModC: LRT(3) = 39.014*** | ||||
N = 166; Domain (F) = financial domain; gender (M) = Gender male; (.) p < 0.10; *p < 0.05; **p < 0.01; ***p < 0.001

Lastly, multilevel models have been applied to analyze risk-taking as a function of expected benefit and risk perception while controlling for gender, domain and age of participants. Likelihood ratio tests suggest that Model C in Table 5, which encloses a random intercept together with random slopes associated to both risk perception and expected benefit, is the best model. However, it should be considered that ΔR2 between Models B and C is only 0.013, meaning that the addition of the random slope for risk perception adds very little explained variance to the model. As in the previous cases, the random part of the model explains a larger proportion of variance regarding the fixed part. In addition, the standard deviation between subjects appears to be larger than the within-subject variability. Negative values of the correlations between the random intercept and the random slope associated with risk-benefit also suggest a fanning in behaviour in which individuals with the higher intercept have the lowest slope and vice versa. On the contrary, the small correlation between the random intercept and the random slope associated with risk perception further emphasizes the small effect of the latter, which is also underlined by the statistical tendency of the fixed effect.
Signs of regression coefficients are coherent with hypotheses and previous literature, with benefit that enhances risk attitude and risk perception that decreases it. Risk-benefit appears to be the only significant predictor of risk attitude in both the financial and the ethical domains, although it is confirmed that in the financial domain, risk-benefit showed higher values (see the associated interaction). Together with domain, gender shows to interact with most of the variables considered in the model (i.e. risk-benefit, risk perception, age), developing non-linear patterns of risk attitude. Male managers in both domains show steeper curves with aging in comparison with females, who present more stable trends (see Figure 1). Age, as previously seen, appears to be a significant predictor of several interaction terms in its quadratic term, and the slope curvatures registered might be driven by the extreme responses of older males as well as for the youngest participants.
Considering the right-hand-side graph of Figure 1, for example, young male managers show higher risk-taking in the financial domain compared to older and/or female managers. Such results are in line with literature in this field, which sees a combination of factors, such as young age, male gender and (considering the role of interaction effects found) expected risk-benefit as predictors of financial risk-taking. Moreover, the left-hand-side graph of Figure 1 displays that old male managers appear inclined to risky attitudes in the ethical domain. Whereas most of the literature confirms no-linearity of the relationship between age and risk-taking in the ethical domain compared to the financial one, such attitude should also decrease with aging. This unexpected result, together with some confirmed hypotheses, will be discussed in the next section.
Discussion
A wide body of research in the field of psychology has been devoted to understanding the nature of risk across the lifespan and among gender, identifying older adults as risk-avoidant (e.g. Deakin et al., 2004; Rolison et al., 2012; Josef et al., 2016), and women as more risk-averse than men (e.g. Byrnes et al., 1999). However, these findings may not fully capture how gender differences and changes in managerial risk attitudes over time influence decision-making in varying organizational contexts. To bridge this gap in the literature and build on the risk-return framework of risky choice (Weber et al., 2002), we presented a cross-sectional study of a sample of executives and measured their risk attitudes (i.e. risk-taking, risk perception and risk-benefit) referred to the company they worked for, in the ethical and financial domain.
Based on previous research findings, we expected that risk perceptions negatively affected risk-taking in both ethical and financial domains, that expected benefits of risky options positively influenced risk-taking in both considered domains and that risk-taking decreases as one age, with younger managers reporting higher levels of risk-taking, particularly when it comes to the financial domain. Moreover, we hypothesized that men, compared to women, would have reported higher risk-taking in both the ethical and the financial domains. The results show that, among the managers in our sample, age, gender and domain are not significant predictors of risk attitude; however, the interaction terms of such variables create significant moderating effects on risk perceptions and on perceived benefits, especially for what concerns the squared age variable, which is sensitive towards lower and higher scores (i.e. younger and older managers). Perceived benefits are the main drivers of risk-taking attitude, resulting in significantly predicting it in both the considered domains. Such findings are partially in contrast with previous literature on the risk–return framework, which argued that individual differences in risk-taking attitudes vary more as a function of people’s risk perceptions rather than their expected benefits (Blais and Weber, 2006; Weber et al., 2002). Thus, our results may mirror a specific pattern of task characteristics involved in the managerial work. In line with such argument, it is worth noting that, whilst the confirmed relationship between younger male managers and higher financial risk-taking attitude is in line with previous findings (Rolison et al., 2012), our results showing higher ethical risk-taking attitude of older managers, who perceive less benefits, do not seem to be confirmed by previous literature in the field.
A possible explanation for such tricky findings may be related to the job position of senior male managers, who are likely to be accustomed to company risks, considered as an implicit part of the managerial role and who perform their roles with higher opportunities to take on ethical risks, especially if compared to their younger and/or female counterparts. Such an argument would also help explaining why female managers, who perceive higher benefits referred to risks in the ethical domain, are less disposed to take on risks in this domain. Accordingly, in our sample, perceived benefits are more closely associated with the company level than the individual level, reflecting a dispositional rather than situational risk-taking attitude. In other words, such findings may support the notion that the relationship between risk-taking and benefit might differ from the one developed within the risk–return framework when it comes to the working context, especially for what concerns the managerial role. Thus, job positions and related variables (e.g. tenure, career opportunities, rewards and compensation systems) may have an important role to play in explaining higher variances in risk-taking attitudes.
There are several limitations associated with the findings obtained from our data.
This study is cross-sectional in design, which means that generational changes and historical events have not been taken into account. However, even though these elements are likely to impact comparisons of age differences (Rolison et al., 2012), recent findings suggest that estimates obtained from cross-sectional data largely capture longitudinal changes in risk-taking propensity (Josef et al., 2016). While our findings offer new insights, their generalizability may be limited by the cultural and organizational context of our sample, primarily from one country. Future research should extend these analyses globally to understand how cultural differences influence managerial risk attitudes.
It appears that risk-taking attitude can vary based on individual differences but also with respect to the various domains of decisions (i.e. ethical and financial) and the situation in which such decisions take place (i.e. risk-taking perception, behaviour and benefits). Taken together, our findings contribute to a deeper understanding of managerial risk-taking by highlighting how perceived benefits and demographic factors interact within the organizational context. For example, the continuous emergency related to climate change requires organizations to work on their profitability while also caring for ethical aspects such as the environmental impact of their financial decisions. Our results indicate that perceived benefits represent the main drivers for both financial and ethical domain. This suggests that while financial decisions can result in more accurate decisions for organizational profitability by managers who are more apt to financial benefits, in ethical decisions, managers might decide not to follow such paths in the pursuit of profit. Studying differences in risk attitudes among managers within organization can serve as a basis for risk management strategies. Understanding how risk attitudes change over time can also serve organizations to anticipate and mitigate potential risks associated with managerial decision-making.
Notes
Analyses were carried using the open software R (R Core Team, 2016). Psychometrics properties of the scales were assessed by means of the package psych (Revelle, 2016).
Multilevel models were carried by means of the packages lme4 (Bates et al., 2015), lmerTest (Kuznetsova, Brockhoff and Christensen, 2016) and MuMIn (Barton, 2016).
References
Further reading
Appendix. Work adapted domain-specific risk-taking (adult) scale – risk-taking