This study focuses on the value of data sharing in retail supply chains in terms of its impact on manufacturers’ demand planning. It investigates how manufacturers’ access to retail data influences their forecast accuracy and enhances the alignment between retailers’ and manufacturers’ demand planning.
Based on a mixed methods approach, we first observed four consumer packaged goods manufacturers, which integrated Point of Sales data into their forecasting algorithms, and measured the resulting improvements in the forecast accuracy. Second, we conducted semi-structured interviews with two manufacturers, three retail chains and industry experts from a solution-provider company to explore the mechanisms through which retail data sharing aligns demand planning at tactical and operational levels.
The quantitative study’s results indicate that retail data integration generally does not yield significant improvements in forecast accuracy. However, qualitative exploration reveals that continued investment in data sharing is driven by its use in demand planning alignment, where it can deliver substantial tactical and operational benefits. Retail data, in the form of replenishment forecasts, enable improved planning alignment by facilitating automated routine processes, proactive exception management and enhanced synchronization of production volumes and delivery schedules.
This study contributes to the supply chain information-sharing literature by reframing the value of retail data sharing as a driver of planning alignment rather than forecast accuracy improvement. Moreover, it proposes the regular sharing of replenishment forecasts as a scalable alternative to expert-based collaborative demand planning, suitable for adoption across an extensive supplier base without requiring intensive resource commitments.
1. Introduction
… most of our top 30 suppliers subscribe to the most comprehensive data package that we offer via our retail data platform. Head of Replenishments, RetailCo2
This statement from a leading Nordic grocery retailer captures a growing industry trend: the increasing prioritization of collaborative data sharing across consumer-packaged goods (CPG) supply chains. These supply chains, which include perishable items such as fresh food, dry goods and beverages, are under rising pressure to enhance transparency and coordination. Over the past decade, companies have invested billions of euros in supply chain technologies aimed at improving forecasting and planning capabilities. Yet, both empirical and theoretical research frequently finds limited gains in forecast accuracy from such investments alone (Cachon and Fisher, 2000; Jonsson and Mattsson, 2013; Giloni et al., 2014; Schlaich and Hoberg, 2024).
Despite this, practitioners continue to believe in the operational value of downstream data, such as point-of-sale (POS) demand and retail replenishment plans, shared upstream with manufacturers. This belief is reflected in a 2024 industry study revealing that 91% of CPG manufacturers intend to deepen collaboration initiatives, citing supply chain resilience and waste reduction as key drivers [1]. Similarly, a 2022 Coresight Research/NielsenIQ survey found that 79% of retail and CPG executives consider data sharing to be more important in the post-pandemic era [2].
The importance of data sharing in retail-CPG supply chains is underscored by the sector’s distinctive challenges, such as short product shelf lives and intense competitive pressures. Misaligned forecasts can lead to stockouts, excess inventory and product spoilage, directly impacting financial and environmental performance. The perishability of products heightens the cost of supply–demand mismatches, contributing to food waste and associated sustainability concerns (Akkas et al., 2019). These conditions make retail-CPG supply chains particularly well-suited for studying the real-world impact of collaborative data use.
Building on these challenges, operations and supply chain management scholars have prominently recognized the value of information sharing in retail supply chains (e.g. Cachon and Fisher, 2000). The operational characteristics of these supply chains, such as short lead times, limited shelf lives and volatile end-customer demand, heighten the effects of information asymmetry between manufacturers and retailers. To address this asymmetry, scholars propose giving manufacturers access to granular sales data to be used alongside historical order data, to reduce uncertainty and improve forecast accuracy (Boone et al., 2019). Theoretical models quantify the benefits of reducing such asymmetry, showing that data sharing can enhance demand planning performance, under specific conditions (Gaur et al., 2005; Giloni et al., 2014; Ketzenberg et al., 2023). However, these studies also highlight important limitations, demonstrating that in many contexts, the value of this information sharing is negligible or even zero.
Empirical findings further complicate this picture. Some studies suggest that sharing granular data improves forecast accuracy (Williams et al., 2014; Hartzel and Wood, 2017), while others indicate that its benefits depend on deviations from rational ordering behavior. Cui et al. (2015) found that forecast accuracy improves only when downstream decisions deviate from rational and optimal ordering, implying that data sharing is only valuable when it conveys new information not already reflected in order patterns (see also, e.g. Kaipia et al., 2017). Beyond forecast accuracy, a parallel stream of research focuses on demand planning alignment between retailers and manufacturers. Collaborative demand planning, through joint forecasting and coordinated decision-making, has demonstrated performance improvements (Småros, 2007). However, such practices require trust and dedicated resources, and reduce retailers’ decision-making autonomy, making them difficult to scale across a broad supplier network (Simatupang and Sridharan, 2005; Choudhary et al., 2016).
These streams of literature identify two primary mechanisms through which retail data sharing can create value. First, data sharing reduces information asymmetry by providing more granular, customer-level sales data, improving demand visibility across supply chain echelons (e.g. Cui et al., 2015; Schlaich and Hoberg, 2024). Second, it enables demand planning alignment by facilitating collaborative processes that promote shared decision-making and coordination between retailers and manufacturers (e.g. Williams and Waller, 2011; Alftan et al., 2015). However, as discussed earlier in the text both mechanisms have caveats, prompting the need to revisit the value of downstream data sharing in retail supply chains, particularly considering recent industry investments in data-sharing technologies.
This paper examines how retail data sharing creates value in contemporary retail supply chains by investigating whether its benefits stem from reducing information asymmetry and increasing forecast accuracy or from improving alignment in demand planning processes. We divide our main research question into two more specific questions: (1) Does sharing of POS data increase the forecast accuracy of a CPG manufacturer? (2) How does retail data sharing increase alignment in demand planning processes? To address these questions, we employ a mixed-methods approach, integrating quantitative and qualitative analyses. First, we conduct a quantitative study involving four CPG manufacturers that piloted the integration of retail data, such as POS data, into their forecasting algorithms. We compare forecast accuracy with and without retail data to assess its impact on forecast performance. Second, we conduct a qualitative study with two manufacturers and three retail chains to explore how data sharing enhances demand planning alignment, and associated strategic, tactical and operational benefits.
The findings suggest that the primary value of retail data sharing lies not in improving forecast accuracy but in facilitating scalable planning alignment. The quantitative analysis reveals that integrating POS data does not measurably improve manufacturers’ forecast accuracy compared to models based solely on order rates. In contrast, our qualitative study indicates that retail data sharing significantly enhances manufacturers’ demand planning capabilities. Particularly retailers’ replenishment forecasts provide value through visibility into both observed and forecasted demand, as well as operational knowledge into inventory replenishment planning. These findings challenge the prevailing perspectives in literature, where the value of data-sharing is primarily linked to improving forecast accuracy and present a scalable alternative to resource intensive collaborative models. By revisiting the role of retail data sharing in contemporary retail supply chains, this study provides theoretical and managerial insights into how firms can derive value from their investments in data-sharing technologies.
The rest of the paper is organized as follows. Section 2 reviews the state-of-the-art literature on the value of retail-data sharing. Section 3 presents our research methods and research context. Section 4 presents our findings from the two studies. In Sections 5 and 6 we discuss the contributions of our findings for future research and practice, and present conclusions.
2. Literature review: information sharing for improved demand planning
Supply chain research has long examined information sharing as a means to reduce information asymmetry and align demand planning between the manufacturing and retail echelons (Choi et al., 2013). Research studies have explored its role and value from multiple perspectives, including its impact on enhancing visibility, fostering collaboration, fortifying resilience, informing product development and improving demand planning (Baah et al., 2021; Huang et al., 2023). In this section, we focus on the literature that investigates the role of information sharing in demand planning, as a measure of improving CPG manufacturers’ forecast accuracy and alignment of tactical and operational planning with retailers.
The value of information sharing for improving forecast accuracy has also been extensively studied, with studies highlighting both overall and context-specific improvements in CPG manufacturers’ demand planning. The underlying rationale is that order rate history alone does not sufficiently capture future demand patterns and therefore it should be supplemented with end customer sales data (Cui et al., 2015). Williams and Waller (2011) examined the efficacy of integrating POS data into suppliers’ forecasting processes, concluding that POS integration adds significant value, particularly in short-term planning when forecasts are aggregated from the store level to the account level. Williams et al. (2014) introduced the concept of the inventory balance effect, demonstrating that forecasts combining order history and POS data outperform those based on a single source. This effect arises as inventory policies create equilibrium between POS data and orders, thereby reducing forecast errors. Hartzel and Wood (2017) directly compared POS-based and order-based forecasts, discovering that POS data provides more accurate forecasts, especially when the order quantities are relatively low or relatively high and there is low frequency of orders. Similarly, Kaipia et al. (2017) using a design science-based intervention, found POS data integration particularly beneficial during product introductions and promotional activities. Van Belle et al. (2021) further validated the utility of sell-through data, showing notable improvements in short-term forecast accuracy.
However, other studies challenge these benefits of retail data for demand planning, and consider the retail data as a redundant source of information, given that order rates are robust. Jonsson and Mattsson (2013), using simulations, found that POS data do not add value regardless of demand type. Narayanan et al. (2019) compared POS-based and order-based forecasts, concluding that while POS data may enhance demand forecast accuracy, order history-based forecasts are more effective for order fulfillment planning. Abolghasemi et al. (2023) explored the value of POS data in a three-echelon supply chain and found that, at the distribution center level, order history-based forecasts significantly outperformed those relying on POS data. These conflicting findings suggest that while POS data integration may deliver value in specific contexts, its effectiveness is not universal. This conflicted evidence has also been noticed in some other research studies (Trapero et al., 2012; Schlaich and Hoberg, 2024). In addition, the literature focusing on forecast accuracy predominantly comprises simulations/modelling-based studies, and while some studies use real-world data in their own forecasting models; the researchers rarely collaborate with manufacturers to experiment with the impact of retail data in the industry’s in-practice forecasting models.
A parallel stream of literature examines the use of retail data beyond its impact on forecast accuracy, focusing instead on other dimensions of demand planning, such as retail inventory management and service levels. For instance, Teunter et al. (2018) incorporated inventory levels alongside forecast accuracy to assess the value of information sharing with upstream partners, particularly in responding to structured and unstructured demand changes. Their findings indicated that information sharing has negative value in the context of unstructured demand changes. Rached et al. (2016) examined the impact of information sharing on logistics costs in centralized versus decentralized decision-making scenarios, while Li and Zhang (2015) analyzed make-to-stock environments. Their findings revealed that information sharing helps ensure sufficient availability during high-demand periods and enables price reductions during low-demand periods, though they noted that high wholesale prices during demand spikes could negatively affect sales. Costantino et al. (2015) further proposed a two-pronged approach to enhance demand planning by sharing both end-customer demand data and inventory levels.
More recently, Schlaich and Hoberg (2024) explored the utility of retail data for predicting order timings for slow-moving, perishable food products. These items, despite their limited shelf lives, require production schedules to align closely with retailer orders to ensure freshness and minimize waste. Their findings demonstrate that access to POS data enhances suppliers’ ability to forecast order timings accurately, thereby improving supply chain coordination. Similarly, Chuang (2018) proposed a POS-based analytics approach to automate the detection of out-of-stock items on store shelves, replacing manual inventory audits and streamlining inventory management processes. Bassamboo et al. (2020) proposed using POS data for inventory auditing and identifying phantom inventory, items lost due to handling errors, expiration or theft that still appear as available in inventory systems.
Another, more established stream of literature examines the collaborative use of information sharing to align demand planning between the manufacturer and retailer echelons. Initiatives such as Vendor-Managed Inventory (VMI) and Collaborative Planning, Forecasting and Replenishment (CPFR) are seminal examples of these approaches (Barratt, 2003). Under VMI, suppliers assume responsibility for replenishing inventory at the retail echelon within predefined upper and lower volume limits (Whipple and Russell, 2007). Similarly, CPFR involves joint forecasting of replenishments and the implementation of mutually agreed planning decisions (Fliedner, 2003). Building on these concepts, Simatupang and Sridharan (2005) proposed a collaborative framework that integrates key elements such as performance monitoring, information sharing, decision synchronization, incentive alignment and supply chain process integration. Chang et al. (2007) further argued that, beyond partner-specific information, market and non-sensitive competitor data (excluding promotional activities), should also be shared to align demand planning of the two echelons.
Småros (2007) conducted a case study of four collaboration initiatives, ranging from full-scale CPFR to joint forecasting for promotions or new product launches, highlighting both their value and the associated challenges. The findings indicate that the value of collaboration initiatives is contingent on the production processes and forecasting needs of supply chain members. Ryu et al. (2009) analytically compared two information-sharing approaches using a simulation model: the Planned Demand Transferring Method, where downstream partners forecast and share procurement plans tier by tier, and the Forecasted Demand Distributing Method, where a central entity forecasts and simultaneously distributes demand information. The study evaluated the effectiveness of these methods in terms of inventory levels, service levels and responsiveness to demand changes. Their findings indicated that increase in demand variability shifts the balance in favor of the latter approach. Similarly, Alftan et al. (2015) proposed and implemented the Collaborative Buyer-Managed Forecasting (CBMF) approach. In this model, wholesalers receive retail data on sales, inventory and planning decisions, prepare forecasts on behalf of retailers and share them with manufacturers, who then convert these forecasts into orders while the wholesaler oversees replenishment. However, despite their benefits, these collaborative frameworks to align demand planning are typically developed and tested only with few specific retailer–supplier relationships. Their widespread adoption remains limited due to the required significant commitments that limit scaling them across a wider supplier base.
Our review of the literature reveals two open empirical questions. First, the value of retail data for improving forecast accuracy for CPG manufacturers remains a subject of debate. Empirical evidence from practice is limited, particularly regarding how manufacturers incorporate retail data into forecasting algorithms and the measurable benefits they derive. Second, the use of retail data beyond forecasting typically falls into two categories: analytical applications or collaborative frameworks such as VMI and CPFR, which seek to align demand planning between manufacturers and retailers. While promising in concept, these approaches face significant scalability challenges. Intensive collaboration requires dedicated resources and a willingness to cede some decision-making autonomy, making such models difficult to implement across a broader supplier base.
This study aims to address these questions in two ways. First, we conduct a conceptual replication study to examine the impact of retail data integration on forecast accuracy, focusing on its application within real-world forecasting processes. Our replication employs a different research design and dataset to revisit and extend prior findings on this topic (Bettis et al., 2016; Goldsby and Autry, 2011). We analyze four CPG companies as they pilot to incorporate retail data as an explanatory variable in their forecasting models and assess the resulting changes in forecast accuracy and implications for decision-making for use of the retail data. Second, we investigate alternative, more scalable uses of retail data that facilitate planning alignment without relying on rigid collaborative frameworks. Drawing on data from three retail chains and two manufacturers, we explore how retail data is shared and the mechanisms through which it enhances alignment, as well as the strategic, tactical and operational benefits that emerge from such integration.
3. Methods
We employed a mixed-methods research design to investigate the value derived from information sharing in retail supply chains, specifically through the integration of retail data into manufacturers’ demand planning processes. Retail data, in this context, refer to end-customer sales and planning-related information typically held by retailers and not readily available to suppliers. This data includes, but is not limited to, retailer sales forecasts, replenishment forecasts, POS data, sell-through data, outlet count data, promotions and assortment plans (Kaipia and Holmström, 2007; Mishra et al., 2007; Ramanathan, 2012). In this study, we define retail data to refer to all such information originating from retailers, excluding replenishment orders.
A mixed-methods approach was appropriate given the multifaceted and complementary research questions in our study (Golicic and Davis, 2012). The question of whether retail data improve forecast accuracy called for a quantitative assessment, while the broader inquiry into how retail data support demand planning alignment required qualitative exploration.
Accordingly, we first conducted a quantitative study involving four consumer packaged goods (CPG) manufacturers. We observed the companies as they, in addition to the order rates history, incorporated retail data as an explanatory variable in their forecasting algorithms. We evaluated improvements in forecast accuracy by comparing forecasts generated with and without retail data and subsequently observed how this influenced manufacturers’ decision-making processes.
Second, to explore the use of retail data in supporting planning alignment beyond forecast accuracy, we conducted an exploratory qualitative study. This involved interviews with two manufacturers, three retail chains and one demand planning solution provider. Through semi-structured interviews, we explored how retailers share their data, how manufacturers utilize this information and the resultant strategic, tactical and operational benefits. We employed thematic analysis to identify recurring patterns and insights. Together, these complementary quantitative and qualitative inquiries offer a comprehensive understanding of the practical implications of retail data integration in supply chain demand planning (Table 1).
3.1 Study 1 – the value of retail data sharing in terms of improving forecast accuracy
The first study employs a quantitative methodology to examine the value of retail data integration, specifically in the form of POS data, for improving forecast accuracy of CPG manufacturers. POS data refer to transactional information captured at the retail checkout, recording the final purchase made by the end customers (Zhu, 2013). We analyzed four anonymized case companies from the Northern European CPG sector, referred to as ChemCo, FoodCo, FrozenCo and GoodsCo. All four are clients of the same demand planning solution provider, which employs state-of-the-art forecasting facilities and methodologies.
We collaborated with these companies as they were conducting a pilot project in partnership with the solution provider company, experimenting with the use of POS data in their demand forecasting processes and observed their subsequent decision-making. The authors were introduced to these case companies through the solution provider company, with whom we had previously collaborated. From the point of view of case study sampling for research, these cases have two strengths. First, the choice of these companies was driven by the revelatory nature of their real-time experimentation with retail data integration practices (Seuring, 2008). Second, in combination these case companies provide a comprehensive representation of the CPG sector, as the selected firms exhibit diverse operational characteristics and product portfolios, for example, differences in product category, shelf life, lead times, replenishment frequency and planning horizons. This diversity enhances the external validity of the study, as it allows us to evaluate the impact of retail data integration across varying operational contexts (Seuring, 2005).
Among the case companies, ChemCo manufactures detergents and hygiene products, characterized by slow market movement and a replenishment frequency of one to two shipments per month. FoodCo and FrozenCo are food manufacturers with higher replenishment frequencies due to the perishability of their products. GoodsCo, a multinational corporation specializing in a broad range of consumer goods, primarily operates in the e-commerce sector and experiences the longest lead times among the cases, averaging 100 days.
The quantitative data collected for the pilot projects comprised the customer orders, promotion calendars, holiday events and POS data. In all cases, the data collection period spanned at least three years, allowing for the development of forecasting models using a minimum of two years of historical data. Table 2 describes the profiles of the case companies, and the data collected for the study.
Following data collection, we performed extensive data cleaning to address inconsistencies, such as missing details, coding errors or infrequently ordered items. The consulting company providing the demand forecasting services employs an explanatory forecasting approach based on regression models enhanced with Bayesian techniques. To assess the impact of retail data integration, the approach was modified by incorporating retail-specific variables, most notably POS data, as explanatory variables in the forecasting models.
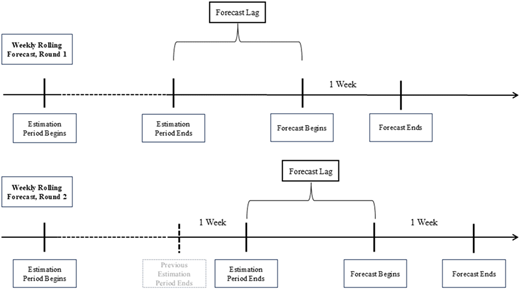
The process began with the development of a benchmark model, which served as a baseline by closely replicating the existing forecasting practices of the case companies. This involved defining key parameters such as forecast lag (the interval between the forecast estimation and prediction period), and forecast horizon (the length of the forecast period). The benchmark forecasts were generated using historical customer shipments or orders, promotion data and known holiday events. To reflect industrial operations where forecasts are continuously updated and applied, we adopted a rolling forecast approach (Figure 1), ensuring alignment with practical planning processes.
Retail data integration was achieved by incorporating outlet-level regressors into benchmark models, enhancing their explanatory power with retail-specific variables. To evaluate forecast performance, we compared the revised models (with POS data) against the benchmark models (without POS data) using two primary metrics:
Forecast Accuracy Metric: Chosen due to its scale independence and its ability to prioritize high-importance products, making it suitable for comparisons across products and companies. It was calculated at the product-week level. To ensure that a higher value indicates greater accuracy, we reversed the scale by subtracting the measure from 1, making 100% indicative of perfect accuracy. The underlying condition, forecast values being less than twice the actual sales, was verified in all cases.
Forecast Deviation Metric: Included to reflect the asymmetric consequences of under- and over-forecasting at an aggregate level, providing a complementary holistic view of forecast performance. It is calculated so that negative values indicate systematic under-forecasting, and positive values indicate systematic over-forecasting.
3.2 Study 2 – the value of retail data sharing in terms of improving demand planning alignment
The second study adopts an exploratory approach to evaluate the broader impact of retail data on manufacturers’ demand planning, particularly how it aligns manufacturers’ and retailers’ demand planning. While forecast accuracy remains an essential metric of demand planning, its performance could also be assessed through broader indicators, for example, service and inventory levels. Recognizing that the benefits of retail data integration are not limited to forecasting and observing that companies are actively establishing and advancing retail data-sharing routines, we explored the other uses of retail data sharing that support demand planning alignment.
We conducted semi-structured interviews with two manufacturers (FoodCo and ChemCo), their three respective retailers (RetailCo1, RetailCo2 and RetailCo3) and a demand planning solution provider (Table 3). The two manufacturers were selected from the first study as they represent contrasting approaches to retail data use (Barratt et al., 2011). FoodCo exemplifies advanced practices in receiving and processing retail data, whereas ChemCo primarily relies on order rates for demand planning.
The three retailers were chosen because each had recently implemented formalized retail data-sharing practices. Until about three years ago, their supplier interactions were limited to sharing replenishment orders based on lead-time agreements, occasionally placing advance orders in the case of anticipated volume fluctuations. Under the new model, however, they have established dedicated channels to share retail data, such as replenishment forecasts, promotional plans, well in advance of placing replenishment orders, and across their wider supplier base. The retailers included in the study represent a significant share of their respective markets, collectively accounting for 85% of the grocery retail market in their geographical region.
To triangulate insights from the case companies and gain a broader perspective, we also interviewed two experts from the solution provider directly involved in supporting the case companies’ demand planning and data-sharing initiatives. In addition, to gather a wider geographic perspective on retail data sharing, we interviewed three experts from the solution provider who were not directly involved with these chosen companies, but their experience ranges across the US, UK and major European countries. These experts offered global perspectives that extended beyond the specific geographical focus of the participating manufacturers and retailers.
A total of ten semi-structured interviews were conducted to explore three key themes: (1) the motivations and challenges for retail data sharing, (2) the practices of retail data sharing and (3) the use cases and associated benefits derived from retail data sharing. This approach enabled us to explore the data and the mechanisms through which retail data sharing improves demand planning alignment between the manufacturer and retailer echelons. Additionally, we discussed why retail data are not shared in some cases, whether due to practical challenges or because the data are perceived to offer limited value in those contexts.
4. Findings
This section presents the findings from the two complementary studies investigating the value of retail data integration. The results from Study 1 indicate that retail data integration generally does not lead to improvements in forecast accuracy. The findings from Study 2 reveal that retail data sharing improves demand planning alignment between the manufacturer and retailer echelons, through the sharing of regularly updated replenishment forecasts.
4.1 Study 1 – the value of retail data sharing in terms of improving forecast accuracy
The quantitative analysis of the four case companies reveals that, in general, integrating POS data into forecasting models does not significantly improve forecast accuracy, compared to forecasting models based on order rates. Table 4 provides detailed results from the four companies, showing minimal or no improvement in forecast accuracy or forecast deviation. These findings align with prior research studies suggesting that order rates often already contain the information captured by retail data, rendering the latter redundant in most cases.
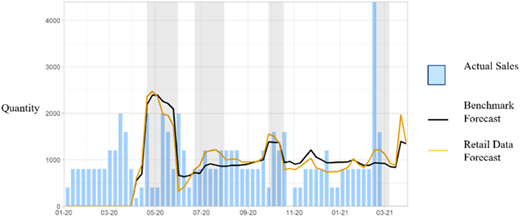
We identified two specific scenarios, promotional events and assortment changes, in which the integration of retail data led to noticeable improvements in forecast accuracy. For instance, at ChemCo, approximately 9% of the product portfolio was affected by assortment changes. For these items, forecast models incorporating retail data outperformed the benchmark models based solely on order history. Likewise, both ChemCo and FrozenCo reported improved forecasting performance during promotional periods when retail data were included. Figure 2 illustrates this effect: during a promotional event (highlighted in grey), the model that integrated retail data significantly enhanced forecast accuracy relative to the benchmark.
Despite the observed benefits in specific cases, all four companies ultimately concluded that the overall improvements in forecast accuracy were insufficient to warrant a transition to retail data-based forecasting. Demand planners and solution provider experts noted that existing order-rate-based models already captured most of the relevant demand signals. As a result, firms opted to retain their current forecasting frameworks for routine replenishment, while relying on retailers’ advance ordering practices to manage exceptional scenarios such as promotions. These advance orders support manufacturers’ tactical planning by allowing them to accommodate seasonal or marketing-driven demand deviations without modifying baseline forecasts through automated adjustments.
These findings are consistent with prior research that has reported limited incremental gains from retail data integration (Narayanan et al., 2019; Abolghasemi et al., 2023). However, the case companies did not discard retail data entirely. Instead, they expressed continued interest in its potential to support broader demand planning objectives, a theme examined in greater depth through the qualitative phase of the study.
4.2 Study 2 – the value of retail data sharing in terms of improving demand planning alignment
This study was motivated by the growing interest from both manufacturers and retailers in advancing the practice of retail data sharing. On the one hand, manufacturers are increasingly purchasing access to retail data; on the other, retailers are expanding the scope and granularity of data shared with suppliers. This prompted our second research question: does retail data sharing improve demand planning alignment even when it does not enhance forecast accuracy? If so, what types of data and data-sharing mechanisms contribute to this improved alignment? The second study adopted an exploratory approach where we focused on the different practices and benefits of retail data sharing.
Given that four of the five case companies involved in the second study had recently implemented retail data-sharing initiatives, and that our research questions were well defined in advance, we were able to structure the data collection process accordingly. Prior to the interviews, participants were contacted via email and provided with an outline of the interview themes. This preparation helped focus the discussions and enabled participants to bring relevant examples and data.
The interviews explored topics such as the types of retail data shared, the frequency and maturity of sharing practices, the benefits realized and the challenges encountered. For instance, when discussing the nature and frequency of data sharing, participants were prompted to consult internal records. When exploring benefits, interviewees were asked to describe specific incidents or observed improvements. The benefit categories largely emerged inductively during the interviews, supported by the clarity of the guiding questions and the practitioners’ direct experience with examples of value gained from data sharing.
Additionally, participants were asked to reflect on challenges associated with retail data sharing, particularly in contexts where sharing was limited or absent. These discussions helped differentiate between value-based limitations and more practical or organizational barriers. Further details on the interview protocol and analysis procedures are provided in Appendix.
4.2.1 Practices of retail data sharing
Our exploration revealed distinct motivations among retailers and manufacturers concerning retail data sharing. While suppliers naturally benefit from data for improved demand planning, retailers require clear incentives to justify sharing data due to inherent privacy and competitive concerns.
We identified three primary motivations driving retailers’ willingness to share data. First, retailers recognize the importance of strengthening the entire supply chain, understanding that improved upstream planning ultimately benefits their own performance. Second, retailers share data to ensure better service from suppliers, often through specific commitments regarding replenishment reliability, responsiveness during promotional events and reduced stockouts. Such commitments are often backed by penalties or service-level agreements in case of non-compliance. Third, retail data represents an additional revenue stream, as retailers can commercialize data access by selling it to suppliers. These motivations are not necessarily mutually exclusive. Our findings suggest that larger retailers are motivated by a combination of all three factors, whereas the smaller retailers emphasized improved service-level commitments as their primary motivation.
Our analysis further indicated that retail data sharing practices vary significantly across different markets and operational contexts. For instance, geographical and cultural factors significantly influence openness towards data-sharing. Nordic retailers, characterized by close-knit industry relationships, are relatively open to data sharing to enhance collaboration. In the US and UK markets, regulatory frameworks often compel retailers to share data to reduce market power disparities between large and smaller supply-chain partners. Additionally, power dynamics between retailers and suppliers, determined by factors like market share, brand influence, etc., significantly shape retail data-sharing arrangements. Powerful suppliers, for instance, can negotiate greater access to retail data, influencing both the scope and granularity of the shared information. In addition, the operational characteristics, such as lead times and perishability of products, also influence the retail data sharing practices.
We discovered three major practices of retail data sharing: retailers’ information portals, scheduled periodic reporting and third-party solution providers. Large retailers typically develop dedicated information sharing platforms to share regularly updated information with suppliers. These platforms provide varying levels of access to suppliers, depending on the nature of relationships or the suppliers’ paid subscription. These different packages vary in terms of granularity, scope and freshness of shared data. Smaller retailers commonly rely on periodic reports, shared on a weekly or monthly basis, due to resource constraints. Finally, some companies delegate data management entirely to third-party solution providers, who forecast retailer demand first and subsequently share refined forecasts with suppliers.
Retailers share diverse types of retail data, including sales forecasts, replenishment forecasts, POS data, inventory levels, promotional plans and product-level assortment data (Table 5 describes the data sharing practices of the companies included in the analysis). Among these different types, the most shared data, available in most basic and often free of cost packages, is the replenishment forecasts. These are defined as retailers’ projections for replenishment orders to be delivered by suppliers, in terms of product volumes, delivery time and location. Retailers share these forecasts well in advance of issuing replenishment orders, with regular periodic updates. Unlike replenishment orders, these forecasts are not binding commitments from either party. However, they provide valuable forward-looking visibility into upcoming requirements, enabling better alignment in manufacturers’ tactical planning processes. The distinct value of replenishment forecasts is further described in the subsequent section.
4.2.2 Use cases and benefits of retail data sharing
Our findings indicate that retail data sharing adds substantial value by significantly enhancing manufacturers’ demand planning. An important benefit arises from the replenishment forecasts shared by retailers, which help in aligning the manufacturers’ tactical and operational planning closely with retailer demands. By comparing their own forecasts with those provided by retailers, manufacturers can identify and address major discrepancies, creating value through three primary mechanisms: (1) automation of routine planning processes, (2) synchronization of volumes and delivery schedules and (3) proactive exception management. Furthermore, these replenishment forecasts, in combination with other types of retail data, also yield strategic benefits. The perceived value was consistently affirmed by both manufacturers and retailers in our sample, who reported improvements in service levels and inventory performance, along with strong intentions to increase the granularity and scope of data sharing. These findings were further reinforced by solution provider insights, which highlighted the widespread applicability and relevance of these practices. We present the operational and tactical benefits first, followed by a discussion of strategic implications. Table 6 summarizes the thematic analysis of these findings.
Retail data sharing, in the form of replenishment forecasts, significantly contributes to the automation of routine planning processes, reducing manual workload and ad hoc communication. Conventionally, when only replenishment orders are shared upstream, manufacturers and retailers engage in frequent meetings to align their medium and long-range plans. Discrepancies between retailer demand and manufacturer forecasts, such as product-type mismatches or delivery-date conflicts, typically emerge only after orders are placed, triggering reactive coordination. In contrast, regularly updated replenishment forecasts give suppliers forward-looking visibility into projected demand at the product and delivery-day level. This enables more efficient production and delivery plans and early identification of discrepancies, minimizing late adjustments and reducing the need for ongoing discussions. For instance, one retailer noted that approximately 90% of their replenishments are now automated, equating to almost a million replenishment order lines daily. Such automation is made possible by the periodic sharing of the updated replenishment forecasts and the resulting alignment of tactical plans.
Similarly, replenishment forecasts also enable the synchronization of volume and delivery schedules with increased granularity. This synchronization is particularly valuable for short shelf-life products, where minor timing discrepancies may severely impact product availability, reduced shelf-life at the POS and result in losses. Practitioners reported that misaligned volume and delivery schedules often lead to waste and increased operational costs. The two-stage process, where replenishment forecasts precede replenishment orders, mitigates such risks by enabling closer alignment of supplier planning with retailer’s replenishment planning. Moreover, early sharing of replenishment forecasts, helps reduce human errors, that are typically encountered during the ordering process. The retailers and suppliers in our sample described multiple instances where human errors either shifted the delivery dates or product volumes, and these errors were addressed through this synchronization.
In addition, replenishment forecasts enable proactive management of exception events, such as promotional campaigns or assortment changes. Exception events present substantial challenges for demand planners, as they deviate significantly from historical demand trends, often requiring expansions or reconfigurations in production capacities. Traditionally, retailers needed to issue advance orders, negotiate prices and commit early, significantly increasing the workload for planning teams and reducing operational flexibility. Retail data sharing alleviates this pressure, as campaigns and assortment adjustments become increasingly visible through replenishment forecasts. Thus, manufacturers can proactively organize their tactical planning to meet these anticipated changes. This provides an extended window for manufacturers to adjust their production and procurements, and greater flexibility for retailers as it reduces their immediate commitment obligations, resulting in mutual operational benefits.
In addition to tactical and operational advantages, retail data sharing also provides important strategic benefits. Primarily, it enhances trust and strengthens relationships among supply chain partners. While initial trust is essential to begin data-sharing initiatives, the regular exchange of detailed planning data fosters deeper integration and more concrete collaboration across the supply chain. Manufacturers reported increased confidence in long-term planning as retail data validated their expectations and decisions. This increased visibility informed their long-term resource allocation decisions, such as machinery investments, labor recruitment and production capacity adjustments.
Furthermore, detailed retail data access also improves manufacturers’ capabilities for new product development. Detailed sales data help them gauge their market performance and discover the upcoming demand trends. It guides innovation and informs strategic marketing decisions. Additionally, information sharing enhances compliance with sustainability mandates by reducing waste, as more informed and synchronized planning lowers the carbon footprint across the entire supply chain.
4.2.3 Challenges for retail data sharing
Despite these evident benefits, our study identified several challenges that hinder companies from establishing retail data sharing practices. Insights from ChemCo, which has been relatively conservative in adopting retail data sharing, were particularly valuable in highlighting these challenges. Experts from the solution provider further clarified these barriers by describing challenges retailers commonly face across broader operational and geographic contexts. In addition, we identified several potential safeguards and practical solutions that may help overcome these obstacles.
A prominent issue is data privacy and confidentiality. Retailers often express concerns regarding sensitive information exposure, fearing competitive disadvantages if shared data, such as POS information, promotional plans or market insights, are misused or accessed inappropriately. Retailers typically address these risks through strategies such as delayed data releases, dedicated user authentication portals with controlled access and non-disclosure agreements (NDAs). Another major challenge is the significant initial investment required for setting up retail data-sharing practices. Establishing these systems requires upfront investments in IT infrastructure, data-processing routines, personnel training and the alignment of internal processes. Moreover, misalignment of technology and data formats across diverse ERP systems complicates the integration effort, increasing costs and implementation complexity. This issue is compounded by the lack of data competency among partner companies, who may lack necessary analytical capabilities or sufficient technological infrastructure.
In addition, the lack of perceived value, especially in terms of tangible and financial parameters, is also a challenge. While some improvements, such as synchronized planning or enhanced collaboration, are easily described, they can be difficult to quantify in monetary terms, creating uncertainty regarding the expected return on investment. Without clearly quantifiable outcomes, decision-makers often hesitate to commit fully to comprehensive data-sharing initiatives. Table 7 summarizes the key challenges identified in establishing effective retail data-sharing practices.
5. Discussion
Our findings contribute to the demand planning literature by offering new empirical insights into the use and value of retail data sharing. The quantitative analysis reveals that integrating granular sales data (POS) does not significantly improve manufacturers’ forecast accuracy compared to models based solely on order rates. Corroborating earlier analytical research findings, these results suggest that if a retailer’s replenishment decisions are predictable and algorithm-driven, data sharing offers little additional value for forecast accuracy improvement. In contrast, the qualitative findings highlight that retail data sharing supports manufacturers’ planning processes in other meaningful ways. Specifically, we identified three means of planning alignment: automation of routine planning tasks, synchronization of volume and delivery schedules and proactive exception management. In addition, retail data sharing also yields strategic benefits, for example, informed new product development, and enhanced trust, etc. These benefits, however, are contingent on overcoming several practical barriers, such as data incompatibility and concerns over data misuse.
Prior research in retail supply chains has emphasized the importance of increasing the granularity of data shared with manufacturers, arguing that critical information is potentially lost when retailers aggregate consumer sales into replenishment orders (Cachon and Fisher, 2000). When manufacturers rely solely on historical order rates to generate forecasts, they may overlook underlying consumer demand patterns, leading to misalignment in tactical and operational planning. Therefore, providing manufacturers access to the granular data, used internally by retailers, could potentially compensate for this loss and align the demand plans across both partners (Van Belle et al., 2021).
However, this premise rests on the assumption that retailers’ replenishment behaviors are either opaque or highly variable. If, instead, retailers follow rational and predictable ordering processes, then manufacturers may achieve similar forecast accuracy using historical order data alone (Cui et al., 2015; Raghunathan, 2001). Consequently, historical order rates shared by retailers may already capture most of the relevant demand information, leaving minimal incremental benefit from detailed sales data (Steckel et al., 2004). This underscores an increasingly relevant limitation: as retailers’ replenishment processes are becoming highly automated with a predictable ordering behavior, sharing POS data may offer little additional value for demand forecasts. Our quantitative findings reinforce this view. We observed no practically relevant improvement in forecast accuracy when manufacturers incorporated POS data into their forecasting models, suggesting that the information contained in the historical order rates is sufficient for routine demand forecasting.
In addition to sharing aggregated data, another factor contributing to ineffective demand planning is that retailers base their replenishment plans not only on sales data and forecast but also tactical inventory planning, operational constraints and preparation to upcoming events (Narayanan et al., 2019). As a result, the orders received by manufacturers reflect not only consumer demand but also retailer and location-specific planning decisions, leading to potential misalignment of planning between manufacturers and retailers. Previous literature has recognized this challenge of demand misalignment and proposed collaboration-based demand planning approaches to address this, focusing on either transferring planning responsibilities to manufacturers or enabling shared decision-making between partners. However, these approaches require manual effort, significant trust and sharing decision-making autonomy (Sari, 2008; van den Bogaert and van Jaarsveld, 2022). Therefore, despite their conceptual appeal, these models have seen limited adoption in practice due to the high resource requirements, the need for close inter-firm trust and the associated loss of decision-making autonomy for retailers (Hollmann et al., 2015).
Our findings suggest that the regular sharing of updated replenishment forecasts by retailers enhances manufacturers’ demand planning, as these forecasts address both previously noted issues: they incorporate retailers’ internal plans and inputs while also reflecting the sales data. Replenishment forecasts refer to projected replenishment orders and represent the retailer’s expectations for inventory needs in terms of product volumes and delivery timing. They combine the retailer’s demand forecasts with operational information, reflecting an internally optimized, capacity-constrained replenishment plan. In addition, sharing replenishment forecasts preserves retailers’ decision-making autonomy, requires relatively fewer dedicated resources and can be scaled across a broader supplier base without requiring extensive relational or resource commitments. This approach enables retailers to inform a broader set of suppliers effectively, achieving better alignment without the complexity and resource demands of highly collaborative frameworks such as VMI or CPFR. Replenishment forecasts can be shared through periodic updates or, more effectively, via dedicated information portals where retailers regularly post updated projections. Manufacturers use these forecasts, at the product and daily level, to compare against their own planning and align production and operational plans accordingly.
Replenishment forecast sharing contributes to aligning tactical and operational planning in supply chains in three ways. First, it reduces the need for extensive manual communication and coordination between retailers and suppliers. Although many supply chain collaboration initiatives are based on increased information exchange, such communication, when handled manually, can be highly resource-intensive (Panahifar et al., 2015). Also, in traditional scenarios where only replenishment orders are shared, substantial ongoing coordination is required between retailers and suppliers (Danese, 2007). For example, manufacturers and retailers often hold frequent meetings to compare forecasts and coordinate tactical plans (Dreyer et al., 2018). However, when updated replenishment forecasts are regularly shared, suppliers can continuously align their plans in response, significantly reducing the need for repetitive communication. This automated exchange also enhances the quality and timeliness of shared information, supporting more efficient and responsive coordination (Somapa et al., 2018). Manual communication is then reserved for addressing significant discrepancies, enabling targeted clarification or adjustments. This approach is especially valuable when managing a large supplier base, as it automates routine coordination, optimizes the ordering process and helps reduce administrative costs (Wu et al., 2016).
Second, the regular sharing of updated replenishment forecasts facilitates automated synchronization of planning between supply chain partners, at the level of specific products, stores and daily delivery schedules. By comparing forecasts, suppliers and retailers can identify discrepancies early and address them proactively, reducing the risk of misalignment (Holweg et al., 2005; Ivanov, 2024). By gaining visibility into upcoming demand at this level of detail, suppliers can efficiently plan their production and distribution activities. Such synchronization is especially critical for short shelf-life products, where even a one-day misalignment can result in stockouts or significantly reduced product usability (Saarinen et al., 2024). It also enables reductions in both waste and safety stock levels by aligning supply more closely with actual demand. Beyond inventory distribution planning, this level of visibility supports capacity planning, workforce scheduling and the establishment of flexibility buffers across operations (Salmela and Huiskonen, 2019). Additionally, it enables suppliers to optimize both production and transportation, for instance, by producing closer to target store-locations and planning more efficient delivery routes (Maskey et al., 2020).
Third, sharing replenishment forecasts significantly enhances the management of exceptions in demand planning. Exception events, whether triggered by unpredictable demand fluctuations or retailer-driven decisions such as promotions and assortment changes, remain a persistent challenge for supply chain coordination (Ettouzani et al., 2012; García-Arca et al., 2020). While advance ordering can serve as a mechanism for signaling demand, it often leads to late and poorly communicated changes, complicating upstream planning and reducing responsiveness. In traditional replenishment-order-only scenarios, retailers often delay order placement to maintain flexibility, which in turn places increased pressure on suppliers to respond with short lead times (Moussaoui et al., 2016). In contrast, sharing replenishment forecasts provides a more proactive approach to exception management. Retailers can signal anticipated deviations, such as promotional events or assortment changes, without committing to firm orders, giving suppliers valuable lead time to adjust production schedules, allocate capacity and build operational flexibility (Nothacker, 2021). This early and flexible visibility enables suppliers to manage exceptions more effectively and maintain greater operational stability.
Retail data sharing extends beyond using replenishment forecasts to align demand planning, as other data types, including inventory statuses and POS data, provide strategic benefits by improving product development, market analyses and strategic decision-making. However, replenishment forecasts distinctly stand out because of their immediate operational and tactical value, significantly enhancing the alignment of supply chain activities. Additionally, replenishment forecasts offer a clear and measurable impact on tactical planning, facilitating synchronization of volumes, reducing waste, enhancing service levels and streamlining routine planning tasks. These forecasts can be shared through the same information mechanisms originally designed for sharing POS data and can deliver many of the benefits targeted by collaborative models, such as planning synchronization and exception management, in a more scalable way due to lower resource requirements. This may help explain why retailer forecasts are often prioritized and shared broadly with suppliers, typically free of charge or at minimal cost, as they offer clear and tangible benefits, provided that trust exists between partners, the necessary data competencies are in place and data-sharing routines are well established.
6. Conclusion
This study investigated how retail data sharing creates value in retail supply chains by focusing on two questions: whether it improves manufacturers’ forecast accuracy or contributes to demand planning alignment between manufacturers and retailers. We employed a mixed-methods approach, beginning with a quantitative study assessing the impact of retail data on forecast accuracy, followed by an exploratory qualitative study examining the data and mechanisms through which retail data support planning alignment. Our findings indicate that retail data integration does not significantly improve forecast accuracy. However, the regular sharing of updated replenishment forecasts facilitates tactical and operational planning alignment across retail supply chains.
Theoretically, this study contributes to the demand forecasting and demand planning literature by reframing the value of retail data sharing. While prior research presents conflicting evidence on the value of retail data for improving forecast accuracy, our findings indicate that integrating such data into forecasting models does not add significant value in practice, assuming an underlying rational ordering behavior. Instead, we highlight replenishment forecast sharing as a more effective mechanism for improving manufacturers’ demand planning. The value of this data lies in enabling planning automation and handling of exceptions and planning changes instead of enhanced forecast accuracy.
These forecasts, when regularly updated and shared, offer forward-looking visibility and can be disseminated using the same infrastructures that could be used for sharing POS data. We further propose sharing of replenishment forecasts as a scalable alternative to traditional collaborative frameworks such as CPFR or VMI, which, despite their conceptual appeal, face well-documented barriers related to resource intensity, coordination costs and loss of decision-making autonomy. In contrast, replenishment forecasts sharing preserves autonomy while enabling alignment, thus making it more feasible to implement across a wider supplier base.
From a managerial perspective, our findings offer actionable insights for improving demand planning in retail supply chains. We recommend that retailers frequently share updated replenishment forecasts with their suppliers to enhance planning responsiveness and operational flexibility. Smaller retailers can leverage third-party service providers or collaborate with manufacturers to develop suitable data-sharing platforms. To ensure effective implementation, data-sharing agreements should address concerns related to confidentiality, access rights and fair use. Moreover, successful data-sharing practices depend on the foundation of trust between supply chain partners; planning teams on both sides should invest in developing collaborative working relationships.
While this research provides valuable insights, it is subject to several limitations. Our quantitative findings are based on a limited sample of four CPG case companies evaluating the impact of POS data integration on demand forecasting. In addition, the study is based on a pilot project, and the results may differ from those observed in more mature settings where POS data integration is an established practice. In such cases, companies may have already improved data integration practices, and organizational learning curves may have progressed further, potentially leading to different outcomes. Similarly, the qualitative insights come from an exploratory study involving five companies and experienced solution providers. Although our results identify mechanisms by which retail data sharing generates value, larger-scale quantitative studies are needed to validate these findings and comprehensively measure their generalizability. Future research could also explore the contingencies influencing the utility of replenishment forecasts. Additionally, expanding the range of shared data types and examining their effects across broader supply chain dimensions, such as sustainability, resilience and cost efficiency, would further contribute to the subject.
Appendix Interview questionnaire
The interview process was semi-structured; however, the discussions revolved around the following main questions. The interviewees were contacted in advance and provided with an outline of the interview themes.
Types of Data Shared
What types of retail data do you currently receive from retailers or share with your suppliers?
Data-Sharing Mechanisms
How is this data shared with partners?
Frequency of Data Sharing
How frequently is retail data shared (or updated) between partners?
Use of Retail Data for Demand Forecasting
Do you currently use POS or other retail data in your demand forecasting processes?
If yes, is it combined with order history, or is it used independently?
Other Uses of Retail Data
Beyond demand forecasting, what additional planning purposes is retail data utilized?
Can you provide specific examples of how these data are used?
Benefits and Outcomes
How do you realize the benefits from retail data sharing?
Have you observed any specific improvements or changes after initiating data-sharing practices?
Operational and Planning Decisions
Which operational or planning decisions benefit the most from retail data sharing?
Could you provide specific examples or scenarios?
Prerequisites for Data Sharing
In your opinion, what are the necessary prerequisites or conditions for successful retail data sharing?
Challenges in Data Sharing
What major challenges or barriers have you encountered related to data sharing?
Future Development and Improvements
What improvements would you like to see in your data-sharing practices in the future?
Data coding and analysis
Predefined Codes: The transcribed interviews were first coded using predefined categories aligned with the research questions (e.g. types of data shared, frequency, data sharing mechanisms and challenges described in Table 5).
Emergent Codes: Themes related to the benefits of retail data sharing emerged inductively from the narratives. For instance, categories such as synchronization of delivery schedules were explicitly mentioned in some interviews and described in closely related terms in others. (Table A1)
Cross-Case Comparison and Validation: Themes were cross-validated across all interviews to ensure that they were not unique to individual cases.
Further Categorization: The aggregate dimensions were further classified into strategic or tactical and operational benefits, based on common definitions in the operations planning literature and the expected timeframe for realization of these benefits.