
The purpose of the study is to examine the impact of internal and external barriers on Lean-Green manufacturing during its post-implementation phase. Examining the impact of Lean-Green manufacturing on the environmental, economic and social performance of organisations is also an aim of the study. The study further explores the inter-relationships between environmental, economic and social performance.
Data was gathered from the Zimbabwean manufacturing industry, of which 302 valid responses were obtained and analysed through structural equation modelling using SMART PLS.
The results showed that both internal and external barriers impede organisations from improving economic, social and environmental performance measures, and hence, deserve attention.
The study concentrated on Zimbabwe’s manufacturing industry; hence, the results may need further validation before they can be adopted by other countries and industries.
Through analysing the impact of internal and external barriers on Lean-Green, organisations can understand which barriers greatly affect them and they can allocate resources accordingly to address them.
Existing studies focused on identifying and ranking the barriers faced during Lean-Green implementation. This study identifies the Lean-Green barriers that are faced post-implementation and examines their relationship with Lean-Green Manufacturing and sustainable performance. Thus, outlining a clear picture of the extent to which these barriers hinder the attainment of sustainable development improvements.
1. Introduction
The sustainability concept has been acknowledged as a way to increase the competitive advantage of a firm (Kumar et al., 2016). As a result, manufacturing organisations are adopting various methodologies to improve their sustainable performance, and these include Lean Manufacturing (LM) and Green Manufacturing (GM) (Machingura et al., 2024c). The simultaneous adoption of Lean and Green has recently piqued the interest of researchers and many benefits have been reported, including improvement in economic, social and environmental performances (Machingura et al., 2024a). Although several authors highlighted the benefits of simultaneously implementing LM and GM, attaining such benefits is impeded by a lot of barriers (Prasad et al., 2022).
Various researchers such as Ullah et al. (2021), Robertsone et al. (2022) have highlighted the barriers that are faced when implementing LM and GM, which are generally the same and should reasonably be the same for Lean-Green implementation., However, organisations still face several challenges during the post-implementation phase (Saif et al., 2021) in trying to make Lean-Green attain its intended goal. Thus, it may not be sufficient to only examine the barriers faced during the implementation process, but also those faced post-implementation as these can hinder the achievement of sustainable performance. Several authors have classified Lean-Green implementation into three stages namely, pre-implementation (also called the unfreeze phase), implementation (also called the change phase) and post-implementation (also called the re-freeze phase) (Lewin, 1947). According to AlManei et al. (2018), the unfreeze stage is when organisations decide to make a change by implementing Lean-Green and they choose an implementation framework consisting of several Lean-Green practices. The change stage is when the organisations are implementing the Lean-Green practices and the re-freeze stage is about establishing stability on the changes made. Post-implementation, companies embrace the change, standardize the new practices and make them the new norm. It was stated that implementation benefits may be realised at each of these stages. These stages have also been compared to Kotter’s (1996) eight-step leading change model, which outlined that change in an organisation can be grouped into three stages: creating the climate for change (akin to pre-implementation); engaging and enabling the organisation (akin to implementation) and sustaining the change (akin to post-implementation). The goal is to encourage organisations to understand that, guided by this stage classification framework, the implications of Lean-Green barriers (and benefit realisation) do not end at the implementation stage, but are also encountered afterwards, hence, they should aim towards effective change management. Also, if such barriers are not identified and mitigated, firms might fail to realise improvements in sustainable performance, leading to the perception that Lean-Green has no tangible benefits. Since organisations aim to improve their sustainable performance, it is important to demonstrate how such barriers impede the improvement process.
A few studies have explored the relationship between LM or GM barriers and organisational performance. For instance, Mathiyazhagan et al. (2017) used Structural Equation Modelling (SEM) to investigate the barriers to green supply chain adoption and their influence on economic benefits and market image. In addition, Jabbour et al. (2016) also applied SEM and developed a model that shows the connection between the barriers and operational and green performance. Mittal and Sangwan (2014a, b) focused on testing the connection between internal, economic and policy barriers that affect the performance of organisations. The future research suggestions by other authors have motivated our research. For instance, Jabbour et al. (2016) recommended the need to investigate the influence of these barriers on organisational performance in different countries other than Brazil. Kaswan et al. (2021) highlighted the need for SEM in exploring the relationships between barriers rather than over-relying on methods like decision-making trial and evaluation laboratory (DEMATEL) and best worst method (BWM). To the best familiarity of the authors, no research has been done that developed a structural equation model to assess how external and internal barriers encountered post Lean-Green implementation phase impact sustainable performance.
Jabbour et al. (2016) classified barriers as internal and external, Mittal and Sangwan (2014a, b) classified them as policy, economic and internal barriers, whilst Mittal et al. (2016) classified them as economic, technical and organisational. In this study, barriers were categorised into external and internal barriers as done by Jabbour et al. (2016) as all barriers are either internal or external to the organisations. Internal barriers are hindrances that occur inside the organisation, for example, lack of top management commitment and lack of training (Anis et al., 2019). External barriers are the hindrances that occur outside the organisation, for example, uncertain future legislation (Jabbour et al., 2016). This study is divided into two parts; firstly, it investigates the impact of internal and external barriers on hindering the improvements targeted by those companies that have implemented Lean-Green Manufacturing. Secondly, it explores the potential of Lean-Green in improving the triple bottom line (3BL). However, this may fail to be attained if external and internal barriers are not addressed. Consequently, the study’s objectives are:
To investigate how the external and internal barriers hinder Lean-Green achievements in terms of the environmental, social and economic performance of organisations.
To examine how environmental, economic and social performance influences one another.
The influence of Lean Green Manufacturing on the 3BL needs to be understood as most studies focused much on their individual effect; hence, less literature is available on their joint impact on sustainable performance. Understanding the inter-relationship between the 3BL is crucial as such knowledge gives a clear picture of how they influence one another. The study utilises data from Zimbabwe manufacturing companies. Zimbabwe is a developing country facing many economic challenges, including a high rate of inflation (Machingura et al., 2024b). Thus, identifying barriers helps managers, stakeholders and policymakers to understand these barriers, become prepared and reduce the risks of failing to achieve their intended targets (Cherrafi et al., 2017a, b). During the implementation stage, a lot of resources are used; thus, on top of the failure to realise the performance improvements, organisations can encounter a loss of resources that would have been used during the implementation process, hence, further burdening the manufacturing organisations.
The paper is structured as follows, section one covered the introduction, section two will explore the literature review and the methodology is in section three. The results are presented in section four showing the measurement model and results on hypotheses. The discussion and conclusion are covered in sections five and six, respectively.
2. Literature review
2.1 Lean Manufacturing
Lean is a system that uses fewer inputs than traditional mass production to produce the same output while providing more variety to the end customer (Kovilage, 2021). LM aims to eradicate waste and enhance value (Abu et al., 2019). Non-value-adding activities are recognised as waste, hence there is a need to eliminate them. Manufacturing organisations adopt LM to reduce waste and lead time, and to increase the variety of products (Narkhede et al., 2020).
2.2 Green Manufacturing
Organisations are also striving to be environmentally friendly by adopting GM practices. GM aims to reduce the negative environmental impacts and the consumption of materials to conserve them for future generations (Viles et al., 2021). This is attained through the elimination of environmental waste like waste water and gas emissions (Abualfaraa et al., 2020).
2.3 Lean-Green and sustainable development
Sustainable development is a development aiming to fulfil the needs of the existing population without jeopardising future populations' capacity to fulfil their requirements (Kovilage, 2021). For the past years, organisations have been implementing LM and GM individually to increase organisational performance. Nawanir et al. (2020) reported that the adoption of Lean in Malaysian Small and Medium Enterprises (SMEs) leads to improvement in the 3BL. A study across various developed countries by Longoni and Cagliano (2015) highlighted that the involvement of employees and managers affects the alignment of LM practices, which tends to affect social and environmental performance. Furthermore, in the Malaysian manufacturing sector, Iranmanesh et al. (2019) found that LM improves sustainable performance. In addition, studies in Ghana noted that GM positively impacts the 3BL (Afum et al., 2020a, b)
Organisations have been enthusiastic about implementing methodologies like LM and GM that help them become sustainable and increase their competitive advantage (Kumar et al., 2016). A study in the United Kingdom packaging SMEs concluded that joining LM and GM has a synergistic and positive influence on organisational performance. LM and GM have a greater impact on the 3BL on both customers’ and suppliers’ sides than when implemented individually (Huo et al., 2019). Also, research done by Green et al. (2018) within the US manufacturing firms realised greater improvements in environmental sustainability and operational performances when LM and GM were combined.
2.4 Lean-Green barriers
Organisations have to understand the barriers they are likely to face in trying to attain improvements in sustainable performance and developing ways to tackle them. Numerous researchers have identified the Lean and Green barriers; for example, Cherrafi et al. (2017a, b) noted a lack of government support, Sarhan et al. (2013) highlighted a lack of awareness and organisational culture. Abu et al. (2019) indicated that barriers to Lean organisations are related to the activities of employees, including lack of knowledge.
Lean-Green barriers are usually categorised as either external or internal, and such classifications help decision makers in organisations, governments and other stakeholders to tackle them efficiently and effectively (Jabbour et al., 2016). Internal barriers and external barriers are latent variables and they are measured using the items found in the literature. These items are represented by IB1 to IB10 for internal barriers and EB1 to EB7 for external barriers as outlined in Table 1.
Internal and external barriers
| Barrier classification | Barriers | Description | Authors | |
|---|---|---|---|---|
| Internal Barriers (IB) | IB1 | Lack of top management commitment | The commitment of managers and support is important as they provide resources and knowledge, amongst others | Luthra et al. (2011), Mittal and Sangwan (2014b), Kumar et al. (2015), Abolhassani et al. (2016), Kumar et al. (2016), Mittal et al. (2016), Cherrafi et al. (2017a, b), Mathiyazhagan et al. (2017), Kaur et al. (2018), Machingura and Zimwara (2020), Narkhede et al. (2020), Osman et al. (2020), Sindhwani et al. (2020), Singh et al. (2020) |
| IB2 | Lack of awareness/information | Inadequate information on existing technology options | Mittal and Sangwan (2014b), Kumar et al. (2015), Cherrafi et al. (2017a, b), Mathiyazhagan et al. (2017), Kaur et al. (2018), Machingura and Zimwara (2020), Osman et al. (2020), Singh et al. (2020) | |
| IB3 | Lack of organisational resources | Organisations' ability to attain improvements in organisational performance is hampered by a lack of technical and human resources | Mittal and Sangwan (2014b), Mittal et al. (2016), Mathiyazhagan et al. (2017), Sindhwani et al. (2020) | |
| IB4 | Ineffective technology | The latest technologies are required to meet the requirements for proper Lean-Green results | Luthra et al. (2011), Mittal and Sangwan (2014b), Kumar et al. (2015), Jabbour et al. (2016), Kumar et al. (2016), Machingura and Zimwara (2020), Narkhede et al. (2020), Osman et al. (2020), Sindhwani et al. (2020), Singh et al. (2020) | |
| IB5 | Lack of training and education | A lack of appropriate training may impede familiarising employees with relevant skills | Kumar et al. (2015), Jabbour et al. (2016), Kumar et al. (2016), Cherrafi et al. (2017a, b), Kaur et al. (2018), Machingura and Zimwara (2020), Osman et al. (2020), Singh et al. (2020) | |
| IB6 | Resistance to change | Changing workers' mindsets from the traditional way of working is difficult. As a result, it is necessary to identify the employees who are hesitant to embrace new technologies and provide training to them, emphasising the benefits of Lean-Green | Abolhassani et al. (2016), Jabbour et al. (2016), Cherrafi et al. (2017a, b), Narkhede et al. (2020), Osman et al. (2020), Singh et al. (2020) | |
| IB7 | Fear of failure | Is the fear of failing to attain intended improvements, leading to financial losses or the fear of product failure, resulting in a loss of competitive advantage | Abolhassani et al. (2016), Cherrafi et al. (2017a, b), Kaur et al. (2018) | |
| IB8 | Poor quality of human resources | Employees have been recognised as a critical resource for those firms in their quest for success | Luthra et al. (2011), Kumar et al. (2015), Kumar et al. (2016), Cherrafi et al. (2017a, b), Kaur et al. (2018), Narkhede et al. (2020), Osman et al. (2020), Sindhwani et al. (2020) | |
| IB9 | Company culture | Organisations are unwilling to leave the traditional way of operation and methodologies that have worked enough for them | Mittal et al. (2016), Cherrafi et al. (2017a, b), Machingura and Zimwara (2020), Osman et al. (2020), Singh et al. (2020) | |
| IB10 | Financial constraints | Funds must be invested to reap economic, social and environmental benefits | Kumar et al. (2016), Mittal and Sangwan (2014a, b), Kumar et al. (2015), Jabbour et al. (2016), Cherrafi et al. (2017a, b), Kaur et al. (2018), Machingura and Zimwara (2020), Narkhede et al. (2020), Osman et al. (2020), Singh et al. (2020) | |
| External Barriers (EB) | EB1 | Weak legislation | Legislation and regulation are essential tools for the suitable governance of businesses as they offer a critical framework of operation | Mittal and Sangwan (2014b), Mittal et al. (2016) |
| EB2 | Low enforcement of laws and corruption | Ineffective adoption of laws, corruption and an insufficient monitoring mechanism | Mittal and Sangwan, (2014a), Mittal and Sangwan (2014b) | |
| EB3 | Low public pressure | Low pressure from key social actors such as community, non-governmental organisations or politicians | Mittal and Sangwan (2014b) | |
| EB4 | Uncertain future legislation | Future legislation may have unanticipated consequences for large investments in newer technologies | Mittal and Sangwan (2014b), Jabbour et al. (2016), Osman et al. (2020) | |
| EB5 | Lack of government support | Many companies, especially SMEs, find it challenging to generate large initial capital and, as a result, require government assistance | Luthra et al. (2011), Cherrafi et al. (2017a, b), Mathiyazhagan et al. (2017), Kaur et al. (2018), Machingura and Zimwara (2020), Singh et al. (2020) | |
| EB6 | Low customer demand | Due to price-sensitive and uninformed customers, there is a low demand from them | Mittal and Sangwan (2014b), Kumar et al. (2016), Mathiyazhagan et al. (2017), Kaur et al. (2018), Osman et al. (2020) | |
| EB7 | Uncertain benefits | Uncertainty about the benefits that can be obtained after large investments have been made | Mittal and Sangwan (2014b), Kumar et al. (2015), Abolhassani et al. (2016), Kumar et al. (2016), Osman et al. (2020) | |
Source(s): Authors’ own work
Lean-Green barriers are related to the barriers of other methodologies, such as Total Quality Management (TQM). This is expected since TQM is also regarded as one of the Lean practices. Some TQM barriers found include lack of teamwork, ineffective training (Ansari, 2022), lack of top management involvement, lack of awareness and resistance to change (Kumar et al., 2020). However, some barriers, such as the mismatch between TQM strategy and business goals and the lack of TQM culture are specific to TQM (Kumar et al., 2020). However, much focus was on investigating the implementation barriers, not post-implementation.
2.5 Hypothesis development
Barriers have a negative influence on attaining improvements in sustainable performance. Mittal and Sangwan (2014b) examined the impact of internal, economic and policy barriers and concluded that internal barriers are the root cause of failures and they should be tackled first. Jabbour et al. (2016) showed that internal barriers negatively influence accomplishing improved green operational practices. Furthermore, Cherrafi et al. (2017a, b) highlighted that barriers, whether internal or external, equally affect Lean-Green Manufacturing. Thus, organisations need to understand these barriers so that they know how to prioritise them and manage the resources effectively and efficiently (Jabbour et al., 2016; Kumar et al., 2016; Cherrafi et al., 2017a, b). Thus, it can be hypothesised that,
External barriers negatively affect Lean-Green manufacturing.
Internal barriers negatively affect Lean-Green manufacturing.
Several studies highlighted that the individual implementation of LM and GM improves sustainable performance dimensions. For instance, a research conducted in the Indian SMEs pointed out that Lean has a positive influence on economic, environmental and social performance (Sajan et al., 2017). Another study by Nawanir et al. (2020) also highlighted that LM positively influences the 3BL. Research by Afum et al. (2020a) among Ghanaian SMEs found that GM positively affects these three dimensions of sustainability. According to Fercoq et al. (2016), Green et al. (2018), Machingura et al. (2024c), combined Lean and Green showed greater impact than when implemented separately. Therefore, we proposed that,
Lean-Green Manufacturing positively affects environmental performance.
Lean-Green Manufacturing positively affects economic performance.
Lean-Green Manufacturing positively affects social performance.
If waste, effluent and air emissions are reduced, the health and comfort of workers and the community are improved; hence, the relationship between the organisations, communities and workers is enhanced. Environmental pollution causes tension between communities as their plants and animals may be affected. Inefficient waste management may cause health and social problems for both workers and communities (Sajan et al., 2017). Thus, we can hypothesise that;
Environmental performance positively affects social performance.
Investing in environmental sustainability issues, like minimising energy consumption, waste and material consumption, is linked to financial gains (Sajan et al., 2017). According to Li (2014) improvement in environmental performance can decrease the cost of raw material and waste disposal, thus, reducing production costs and improving financial performance. Furthermore, a reduction in non-value-adding activities, material and energy use leads to economic benefits due to the reduction in operational costs (Machingura et al., 2024c). The application of environmental management techniques reduces the penalties for non-compliance (Afum et al., 2020a). In addition, improvement in environmental performance makes organisations realise improvements in quality, responsiveness, profit, efficiency and customer satisfaction (Garza-Reyes, 2015). This improves the company’s image and market performance (King and Lenox, 2001). Sajan et al. (2017) found that improved environmental sustainability leads to enhanced economic sustainability. Thus, we can postulate that,
Environmental performance positively affects economic performance.
Improved working conditions and workplace safety reduce the frequency of accidents, resulting in reduced fines for environmental accidents. Furthermore, improved labour relations, community relations, health and safety, reduced worker and community complaints and fewer environmental fines have an impact on the financial performance of organisations. Moreover, improved worker management reduces injuries and mental and physical challenges; hence, the workers are motivated to perform better, leading to an improved production rate (Machingura and Muyavu, 2024). Sila and Cek (2017) also established that social performance is the greatest contributor to economic performance. Furthermore, Barnett and Salomon (2012) found that organisations that have large social performance attain higher financial performances. It can therefore be hypothesised that,
Social performance positively affects economic performance.
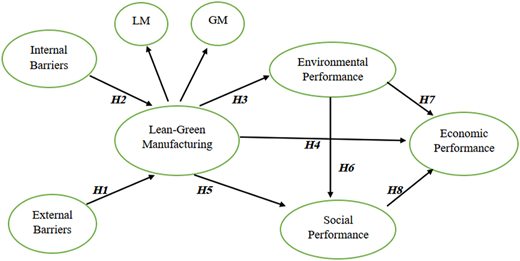
Figure 1 shows the higher-order model that was developed. Lean-Green Manufacturing is a higher-order variable consisting of LM and GM as lower-order variables. The model is in two parts. Firstly, the model shows how internal and external barriers affect Lean-Green. Secondly, it shows how Lean-Green could improve the three pillars of sustainable performance if it is not affected by the barriers.
3. Research methodology
3.1 Development of the questionnaire
To assess the impact of internal and external barriers on sustainable performance, a questionnaire was developed. The questionnaire was divided into 4 categories. Category 1 concentrated on the demographic information, while category 2 evaluated the extent of Lean-Green implementation. Category 3 explored the Lean-Green barriers that impede organisations from accomplishing improvements in sustainable performance, while category 4 explored how Lean-Green improves the 3BL. A 5-point Likert scale was adopted, where strongly disagree was represented by a rating of 1 and strongly agree by 5. The questions were adopted from (Kamble et al., 2020; Machingura et al., 2024b, c). To improve the validity, pretesting of the questionnaire was done by industry and academic experts (Murillo-Luna et al., 2011; Jabbour et al., 2013; Belhadi et al., 2018; Cherrafi et al., 2018; Huo et al., 2019). This allows the modification of the questionnaire by adding, removing and rephrasing some of the questions.
3.2 Data collection
782 questionnaires were randomly distributed to potential participants in the manufacturing sector of Zimbabwe that are listed by the confederation of Zimbabwe industries. A leading qualifying question was asked to find out if organisations have implemented Lean-Green and only those that have implemented it were asked to complete the questionnaire. Emails, phone calls (Jabbour et al., 2013; Huo et al., 2019; Belhadi et al., 2020) and WhatsApp (Diabat and Govindan, 2011) were used to communicate with the respondents to check if the questionnaire was completed. People who are familiar with the study area were selected to partake in the survey, as a result, we chose those with high posts like operations managers, quality managers and Safety, Health and Environment (SHE). More than one questionnaire was distributed in each company to ensure that the data was unbiased (Longoni and Cagliano, 2015). Initially, 313 responses were returned, and after data screening, 302 valid and useable responses were obtained. 11 responses were deemed inappropriate and were rejected. The response rate obtained is, therefore, 38.6%.
4. Results
4.1 Respondent’s profile
As shown in Table 2, the majority of the respondents (29.5%) were from the food and beverage industry. The automotive and ceramic industries had the least number of respondents, contributing 1.7% each.
Industry type
| Industry type | Number of respondents | Sample % |
|---|---|---|
| Food and beverage | 89 | 29.5 |
| Chemicals and petrochemicals | 24 | 7.9 |
| Plastic and rubber | 33 | 10.9 |
| Pharmaceutical | 6 | 2.0 |
| Agrochemical | 17 | 5.6 |
| Wood and furniture | 19 | 6.3 |
| Electronics and electrical | 27 | 8.9 |
| Fertilizer | 7 | 2.3 |
| Textiles | 15 | 5.0 |
| Leather | 6 | 2.0 |
| Paper | 10 | 3.3 |
| Ceramic | 5 | 1.7 |
| Steel | 13 | 4.3 |
| Tiles and bricks | 11 | 3.6 |
| Automotive | 5 | 1.7 |
| Battery | 7 | 2.3 |
| Foundry | 8 | 2.6 |
Source(s): Authors’ own work
4.2 Measurement scale analysis
SMART PLS version 3 was employed in assessing the proposed relationships between the factors through SEM. Before testing the relationships on the factors, reliability and validity assessment of the scale was done. Internal consistency and reliability were explored using Cronbach’s alpha and composite reliability. The values for composite reliability and Cronbach’s alpha were greater than the recommended smallest value of 0.7 showing high consistency and reliability (Hair et al., 2017). The convergent validity was determined using the Average Variance Extracted (AVE) where all obtained values were above the minimum recommended value of 0.5; therefore, they were considered acceptable (Cohen, 1988). The validity and reliability results are outlined in Table 3.
Validity and reliability results
| Cronbach’s alpha | Composite reliability | AVE | |
|---|---|---|---|
| Economic performance | 0.885 | 0.913 | 0.636 |
| Environmental performance | 0.88 | 0.908 | 0.623 |
| External barriers | 0.866 | 0.908 | 0.712 |
| Green manufacturing | 0.888 | 0.909 | 0.529 |
| Internal barriers | 0.841 | 0.88 | 0.513 |
| Lean manufacturing | 0.897 | 0.916 | 0.521 |
| Lean-Green | 0.725 | 0.82 | 0.536 |
| Social performance | 0.915 | 0.933 | 0.667 |
Source(s): Authors’ own work
The Heterotrait–Monotrait (HTMT) ratio was employed in assessing the discriminant validity. All the variables exhibited discriminant validity as they were less than 0.85 (Hair et al., 2017) (See Table 4).
HTMT values
| Economic performance | Environmental performance | EB | GM | IB | LM | Lean-green | |
|---|---|---|---|---|---|---|---|
| Environmental performance | 0.763 | ||||||
| EB | 0.311 | 0.161 | |||||
| GM | 0.668 | 0.606 | 0.405 | ||||
| IB | 0.309 | 0.235 | 0.802 | 0.501 | |||
| LM | 0.669 | 0.611 | 0.416 | 0.814 | 0.504 | ||
| Lean-Green | 0.719 | 0.628 | 0.627 | 0.822 | 0.636 | 0.823 | |
| Social performance | 0.755 | 0.831 | 0.271 | 0.513 | 0.217 | 0.517 | 0.615 |
Source(s): Authors’ own work
4.3 Structural model evaluation
Collinearity among the factors was determined using the Variance Inflation Factor (VIF) and the obtained values were from 1 to 3.148. This indicates that the model had no collinearity problem as the values were below 5 (Maware and Adetunji, 2020). The coefficient for determination (R2) was also used for model assessment. According to Maware and Adetunji (2019a), R2 of 0.26, 0.13 and 0.02 represents big, average and low effects respectively. As shown in Table 4 and Figure 2, the model explained 28.5%, 30.9%, 81%, 83.2%, 83.6% and 60% of the variance in Lean-Green Manufacturing, environmental sustainability, economic sustainability, GM, LM and social sustainability, respectively. Therefore, the model explained a large percentage of variance in all the variables.
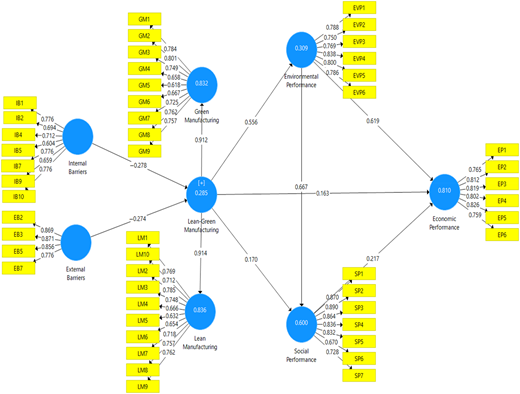
Figure 2 also shows the model’s path weights. Accordingly, Lean-Green Manufacturing is strongly related to environmental performance compared to economic and social performance, as indicated by their path weights of 0.556, 0.163 and 0.170, respectively. The strength of the relationships between environmental performance and social performance and between environmental performance and economic performance are relatively the same as indicated by their path weights of 0.667 and 0.619, respectively. The path weights between internal barriers with Lean-Green Manufacturing and between external barriers with Lean-Green Manufacturing were −0.278 and −0.274 respectively indicating that the strength of their relationships are relatively the same.
The effect size (f 2) and Stone-Geisser’s (Q 2) were used for further model evaluation. To find the Q2 values, the blindfolding method was performed in SMART PLS. The Q2 values above 0 for a specific reflective endogenous variable indicate its predictive relevance (Famiyeh et al., 2018). Table 5 indicates that the Q2 values were above 0, indicating a large predictive relevance. In addition, the f 2 indicates how the R2 values change due to the omission of a certain exogenous variable (Maware and Adetunji, 2019b). This indicates the omitted construct’s effect on the endogenous construct. According to Hair et al. (2017), effect size values of 0.35, 0.15 and 0.02 represent big, average and low effects, respectively. As highlighted in Table 5, the association between environmental performance and social performance, between environmental performance and economic performance and between Lean-Green and environmental performance showed large effects, while the rest of the relationships showed medium effects.
f2 and Q2 values
| f2 | Q2 | ||||
|---|---|---|---|---|---|
| Environmental performance | Economic performance | Social performance | Lean-green manufacturing | ||
| Environmental performance | 0.788 | 0.767 | 0.172 | ||
| Social performance | 0.263 | 0.372 | |||
| Lean-Green manufacturing | 0.448 | 0.159 | 0.189 | 0.114 | |
| External barriers | 0.208 | ||||
| Internal barriers | 0.212 | ||||
| GM | 0.421 | ||||
| LM | 0.418 | ||||
| Economic performance | 0.493 | ||||
Source(s): Authors’ own work
Bootstrapping was performed in SMART PLS to assess if the proposed hypotheses were valid or not. A re-sample of 5,000 runs was used as recommended by Hair et al. (2017). The results indicate that internal barriers and external barriers had a significant negative relationship with Lean-Green Manufacturing. Thus, when internal and external barriers increase, the chances of improving sustainable performance through Lean-Green implementation decreases. The results further highlighted that Lean-Green Manufacturing has a positive relationship with social, environmental and economic performance. Bootstrapping results are shown in Table 6.
Bootstrapping results
| Hypothesis | Effect of | On | Path coefficient | t-statistics | p values | Verdict |
|---|---|---|---|---|---|---|
| H7 | Environmental performance | Economic performance | 0.619 | 9.883 | 0 | Accepted |
| H6 | Environmental performance | Social performance | 0.667 | 9.635 | 0 | Accepted |
| H1 | External barriers | Lean-green manufacturing | −0.274 | 2.71 | 0.009 | Accepted |
| H2 | Internal barriers | Lean-green manufacturing | −2.78 | 2.76 | 0.007 | Accepted |
| H4 | Lean-Green manufacturing | Economic performance | 0.163 | 2.857 | 0.004 | Accepted |
| H3 | Lean-Green manufacturing | Environmental performance | 0.556 | 6.983 | 0 | Accepted |
| H5 | Lean-Green manufacturing | Social performance | 0.170 | 2.377 | 0.018 | Accepted |
| H8 | Social performance | Economic performance | 0.217 | 2.519 | 0.012 | Accepted |
Source(s): Authors’ own work
Bootstrapping was further used to explore the effect of external and internal barriers on the three sustainability dimensions. Table 7 depicts that these barriers indirectly hinder the improvement in economic, social and environmental performance.
Influence of internal and external Lean-Green barriers on sustainability
| Effect of | On | Path coefficient | t-statistics | p values | Effect |
|---|---|---|---|---|---|
| Internal barriers | Environmental performance | −0.155 | 3.226 | 0.011 | Significant |
| Internal barriers | Economic performance | −0.174 | 4.153 | 0.006 | Significant |
| Internal barriers | Social performance | −0.151 | 3.219 | 0.017 | Significant |
| External barriers | Environmental performance | −0.153 | 3.223 | 0.013 | Significant |
| External barriers | Economic performance | −0.126 | 1.974 | 0.042 | Significant |
| External barriers | Social performance | −0.148 | 0.232 | 0.036 | Significant |
Source(s): Authors’ own work
5. Discussion
Organisations around the world are striving to be sustainable; hence, they are adopting various methods like Lean and Green. Studies have been reporting the effect of Lean and Green on enhanced sustainability. This study investigated how Lean-Green barriers hamper organisations from achieving their goal of improving sustainable performance. It also investigated the connection between Lean-Green and the 3BL and further explored the interrelationships between the 3BL performance measures. The results show that both internal and external barriers negatively impact Lean-Green Manufacturing and sustainability. As the barrier’s significance increases, the chances of organisations being able to attain their target diminish. Also, the results of this research have shown that both external barriers and internal barriers have relatively equal and negative impacts on Lean-Green Manufacturing. This contradicts the results obtained by Jabbour et al. (2016) in Brazil, who showed that only internal barriers have a significant negative impact on Green operations and not external barriers; hence manufacturing organisations in Brazil are making efforts to improve their external activities compared to those in Zimbabwe. Also, compared to Brazil, Zimbabwe encounters high socio-economic challenges, including a high rate of inflation signifying that it faces a lot of external hindrances.
Internal barriers related to humans, such as lack of training and education and lack of awareness, are key to attaining sustainable development. Workers need to be trained, involved and encouraged to establish a favourable organisational culture (Jabbour et al., 2016; Thanki and Thakkar, 2018). Overcoming the financially related internal barriers, such as financial constraints and ineffective technology, is also important for organisations to realise improvements in sustainable performances. Organisations need to source resources and allocate them appropriately as improper allocation can cause failures (Thanki and Thakkar, 2018). In addition, overcoming external barriers related to the government, such as lack of government support, is critical for Lean-Green to achieve its intended goal as some organisations have inadequate resources.
Organisations need to put mechanisms to overcome external barriers. For instance, to overcome low public pressure, there is a need to educate the public and stakeholders on Lean-Green benefits and how they can make organisations adopt it (Mittal and Sangwan, 2014b). Organisations need to focus on customer value by understanding that customers are kings and should be heard. In overcoming the lack of government support, organisations can engage various relevant government departments and make them understand their importance and what they expect from them. Overcoming uncertainty of benefits requires communication of these benefits through providing case studies of organisations that successfully adopted Lean-green and the benefits they attained. Also, organisations can start with pilot projects, starting small, assessing the benefits attained and making adjustments where appropriate.
The results further show that Lean-Green positively impacts the 3BL performance measures. Thus, for firms to attain enhanced performance, there is a need to jointly implement LM and GM. Various authors have noted that if LM and GM are jointly adopted they result in better improvements than when one of them is adopted (Dües et al., 2013; Fercoq et al., 2016; Green et al., 2018; Machingura et al., 2024b). The study also demonstrated how the 3BL measures influence one another. The 3BL measures have a positive relationship; hence, the improvement of one of them improves the other two dimensions. For example, an improvement in environmental performance causes an improvement in economic and social performance, as also noted by Sajan et al. (2017), Afum et al. (2020b). Therefore, if organisations are able to improve one of these performance measures by eliminating Lean-Green barriers, the overall sustainable performance is enhanced.
6. Conclusion
This research focused on investigating the effect of internal and external barriers faced post-implementation and how they affect the improvements in sustainable performance. It also explored the connection between Lean-Green and sustainability, and the inter-relationships between the 3BL measures. In addressing this fact, data from Zimbabwe manufacturing companies was employed. Both the internal and external barriers were found to have negative relationships with Lean-Green and sustainable performance. Thus, by reducing these barriers, organisations are likely to attain improvements in sustainable performance. Hence, organisations should understand these barriers and devise ways to overcome them. Also, Lean-Green was found to positively impact the 3BL, whilst, the 3BL showed positive inter-relationships.
6.1 Research implications
Companies that have successfully implemented Lean-Green Manufacturing should understand that even after the implementation process, they can still face challenges that hinder them from attaining their intended goal. Thus, this enables them to allocate resources accordingly. Managers should devise ways to address the internal barriers as they are related to policy and economic activities (Mittal and Sangwan, 2014a, b). Understanding the internal barriers will help organisations eliminate them within their capacity before focusing on external barriers. In addition, knowledge of external barriers will enable organisations to engage with the respective authorities. Additionally, the results of this research have demonstrated the relationship between environmental, social and economic performance. Thus, by minimising the degree of influence of these internal and external barriers, enhanced performance in environmental, social and economic performance is attained.
6.2 Limitations and future research areas
This study focused on the Zimbabwean manufacturing sector; therefore, the results obtained may not generalise to other nations. Zimbabwe is under socio-economic challenges characterised by a high rate of inflation; hence the impacts of some of the barriers may be particular to the Zimbabwean situation. It may be helpful to conduct such a study in other countries and compare the results. Also, this research focused on manufacturing companies. Although Lean-Green was initially developed for manufacturing organisations, it can also be applied to other sectors such as services, logistics, construction and healthcare. Hence, further research can be carried out in such sectors and the results can be compared with those of manufacturing industries. Furthermore, the research did not differentiate between SMEs and large enterprises, which is crucial as these barriers may vary depending on company size since SMEs have limited resources. Thus, further research can be done to examine if the size of the organisation can play a moderating role.
Funding: The research is funded by UP Post-Doctoral Fellowship (UP PhD) Programme: Grant Source: Dri - Cost Centre: A0x816.
